| Param | Original file | Final file |
|---|---|---|
| Filename | modeM0/AS1A10_073T08_9000004112_28649cztM0_level2.evt | modeM0/AS1A10_073T08_9000004112_28649cztM0_level2_quad_clean.evt |
| Size (bytes) | 560,528,640 | 102,101,760 |
| Size | 534.6 MB | 97.4 MB |
| Events in quadrant A | 3,492,514 | 676,897 |
| Events in quadrant B | 3,471,310 | 681,144 |
| Events in quadrant C | 3,469,941 | 652,398 |
| Events in quadrant D | 6,082,371 | 609,328 |
| Mode M0 | |||
|---|---|---|---|
| Quadrant | BADHDUFLAG | Total packets | Discarded packets |
| A | 0 | 14540 | 1 |
| B | 0 | 14464 | 1 |
| C | 0 | 14469 | 1 |
| D | 0 | 22752 | 1 |
| Mode SS | |||
|---|---|---|---|
| Quadrant | BADHDUFLAG | Total packets | Discarded packets |
| A | 0 | 138 | 0 |
| B | 0 | 138 | 0 |
| C | 0 | 138 | 0 |
| D | 0 | 138 | 0 |
| Mode M9 | |||
|---|---|---|---|
| Quadrant | BADHDUFLAG | Total packets | Discarded packets |
| A | 0 | 5 | 0 |
| B | 0 | 5 | 0 |
| C | 0 | 5 | 0 |
| D | 0 | 5 | 0 |
| Quadrant | Total seconds | Saturated seconds | Saturation percentage |
|---|---|---|---|
| A | 6774 | 151 | 2.229111% |
| B | 6775 | 159 | 2.346863% |
| C | 6775 | 305 | 4.501845% |
| D | 6775 | 522 | 7.704797% |
Noise dominated data is calculated using 1-second bins in cleaned event files. If a bin has >2000 counts, and if more than 50% of those come from <1% of pixels, then it is considered to be noise-dominated and hence unusable.
| Quadrant | # 1 sec bins | Bins with >0 counts | Bins with >2000 counts | High rate bins dominated by noise | Noise dominated (total time) | Noise dominated (detector-on time) | Marked lightcurve |
|---|---|---|---|---|---|---|---|
| A | 7284 | 6775 | 21 | 21 | 0.29% | 0.31% | 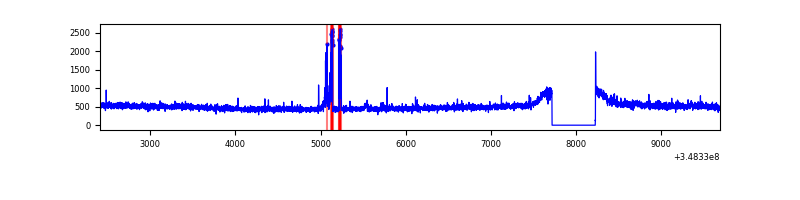 |
| B | 7285 | 6776 | 3 | 3 | 0.04% | 0.04% | 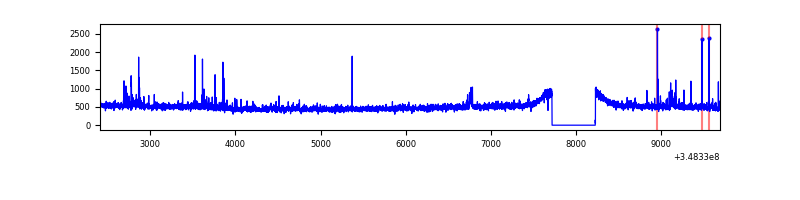 |
| C | 7285 | 6776 | 0 | 0 | 0.00% | 0.00% | 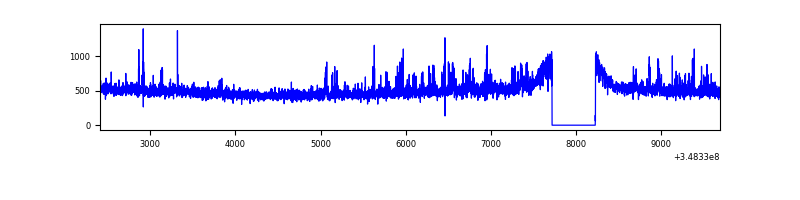 |
| D | 7285 | 6776 | 434 | 434 | 5.96% | 6.40% | 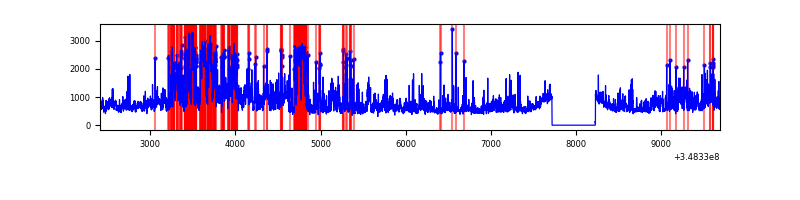 |
Top three noisy pixels from each quadrant. If the there are fewer than three noisy pixels in the level2.evt file, extra rows are filled as -1
| Pixel properties | Quadrant properties | ||||||
|---|---|---|---|---|---|---|---|
| Quadrant | DetID | PixID | Counts | Sigma | Mean | Median | Sigma |
| A | 15 | 174 | 109418 | 625.76 | 861 | 843 | 173.5 |
| A | 12 | 16 | 44669 | 252.59 | 861 | 843 | 173.5 |
| A | 13 | 254 | 14306 | 77.59 | 861 | 843 | 173.5 |
| B | 10 | 245 | 37720 | 225.25 | 848 | 828 | 163.8 |
| B | 0 | 156 | 28275 | 167.58 | 848 | 828 | 163.8 |
| B | 4 | 80 | 27093 | 160.36 | 848 | 828 | 163.8 |
| C | 14 | 238 | 187224 | 977.66 | 813 | 821 | 190.7 |
| C | 14 | 254 | 85212 | 442.62 | 813 | 821 | 190.7 |
| C | 7 | 247 | 15352 | 76.21 | 813 | 821 | 190.7 |
| D | 1 | 52 | 1425460 | 7235.34 | 817 | 797 | 196.9 |
| D | 8 | 195 | 1131108 | 5740.43 | 817 | 797 | 196.9 |
| D | 12 | 233 | 268933 | 1361.76 | 817 | 797 | 196.9 |
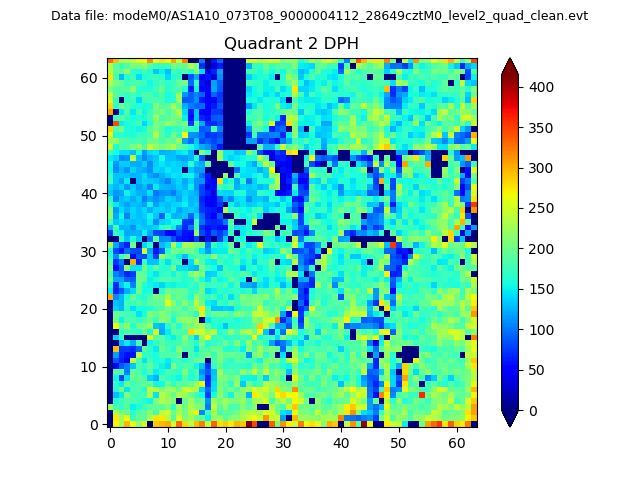
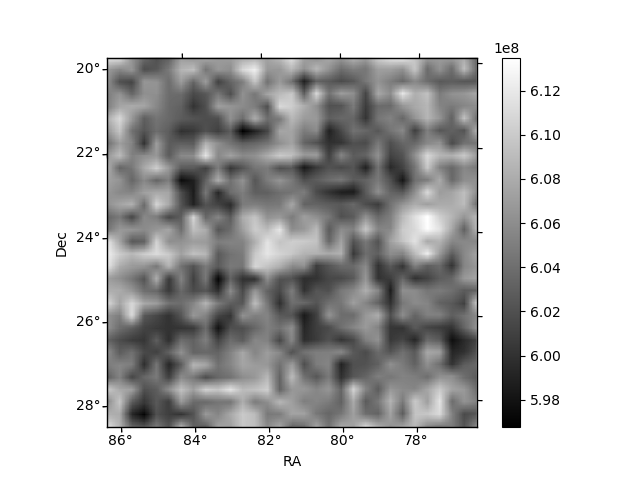
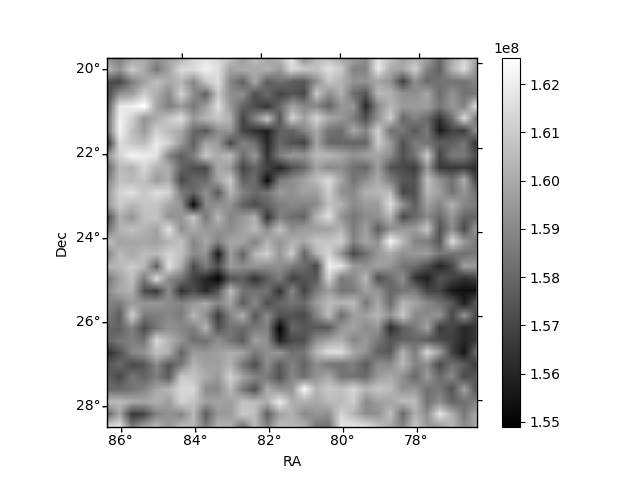
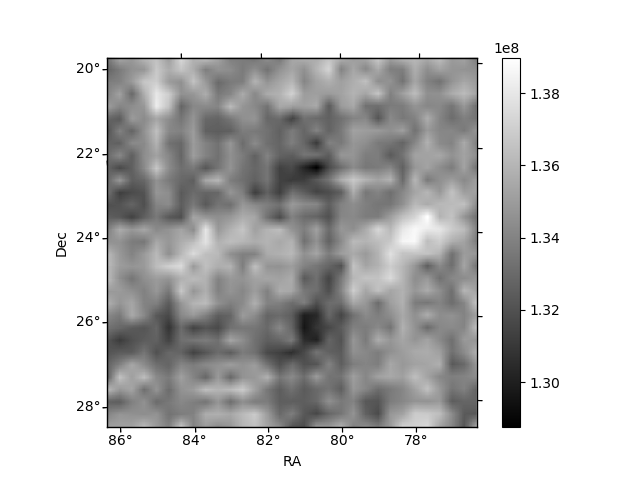
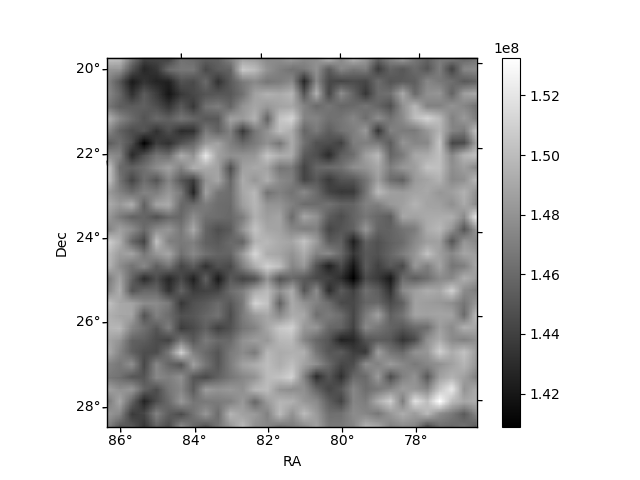
Histogram calculated using DETX and DETY for each event in the final _common_clean file
| Quadrant A | 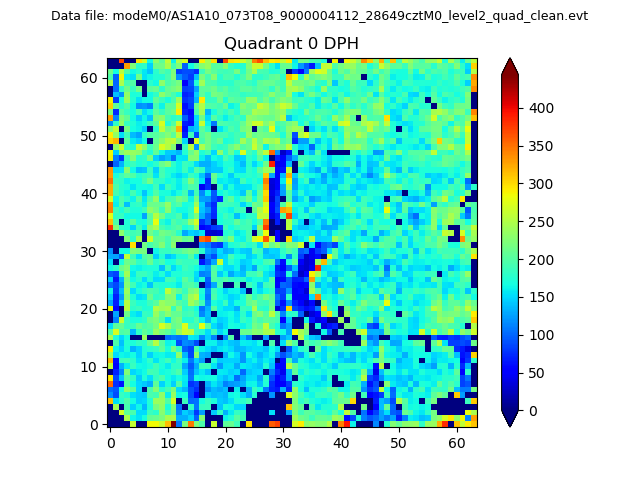 |
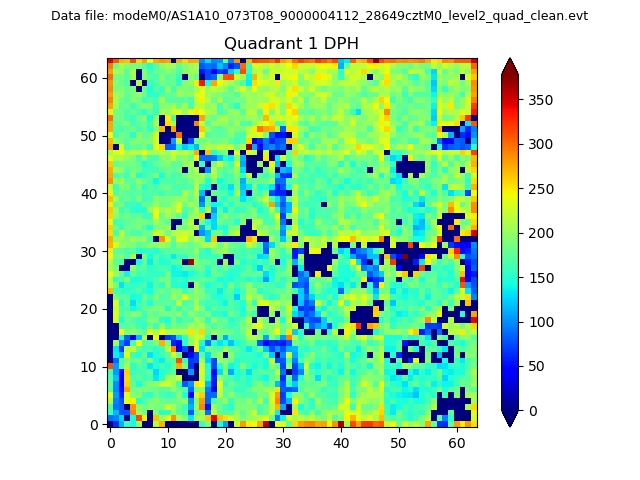 |
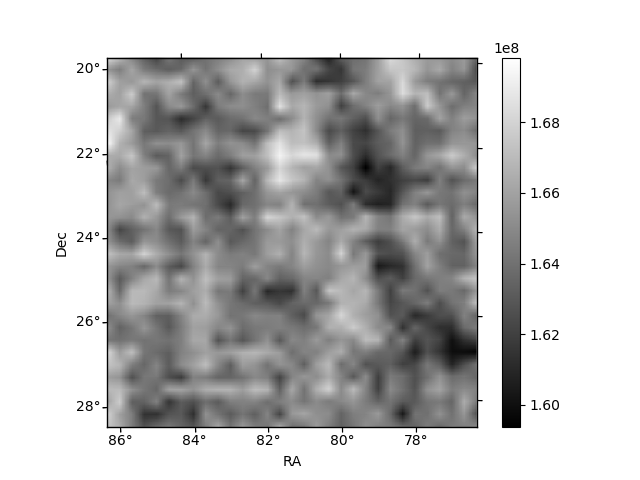
Quadrant B |
|---|---|---|---|
| Quadrant D | 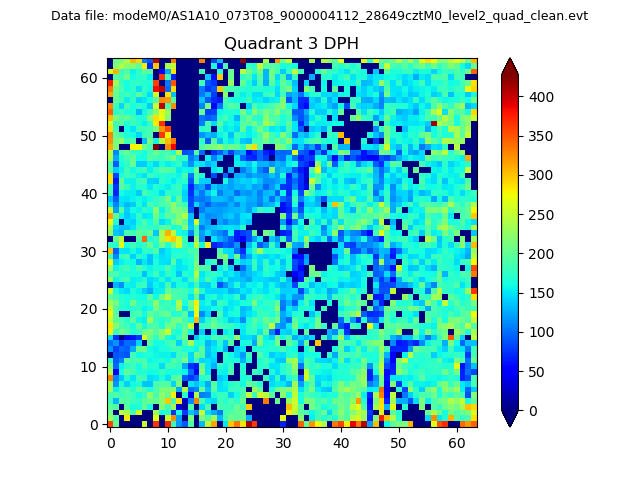 |
 |
Quadrant C |
| Plot type | Count rate plots | Images |
|---|---|---|
| Comparison with Poisson distribution Blue bars denote a histogram of data divided into 1 sec bins. Red curve is a Poisson curve with rate = median count rate of data. |
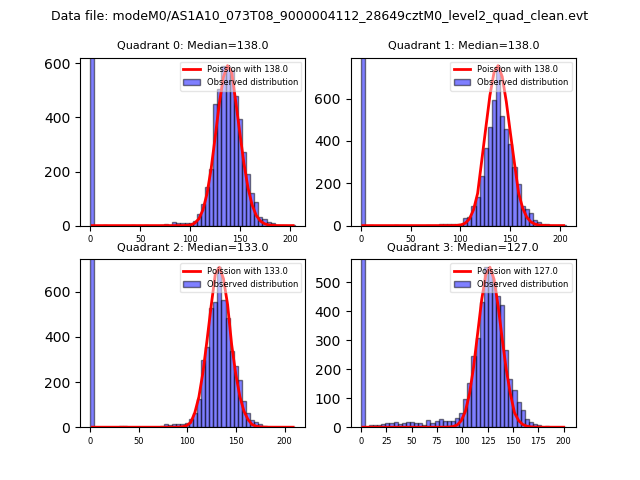 |
 |
| Quadrant-wise count rates Data is divided into 100 sec bins |
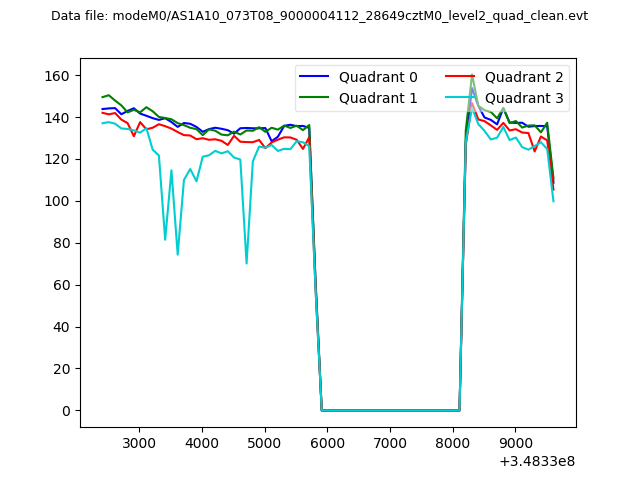 |
|
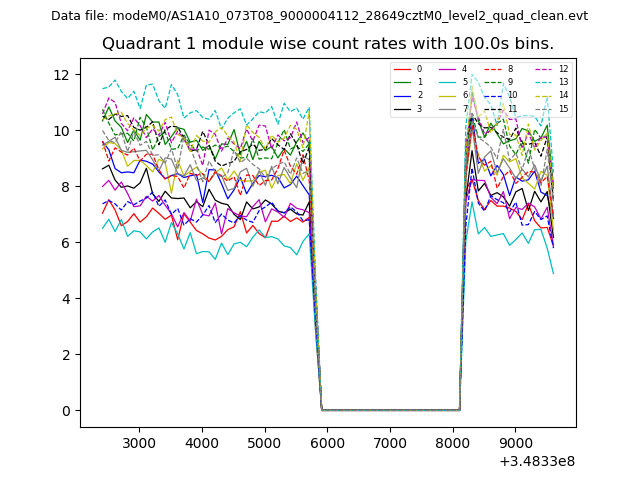
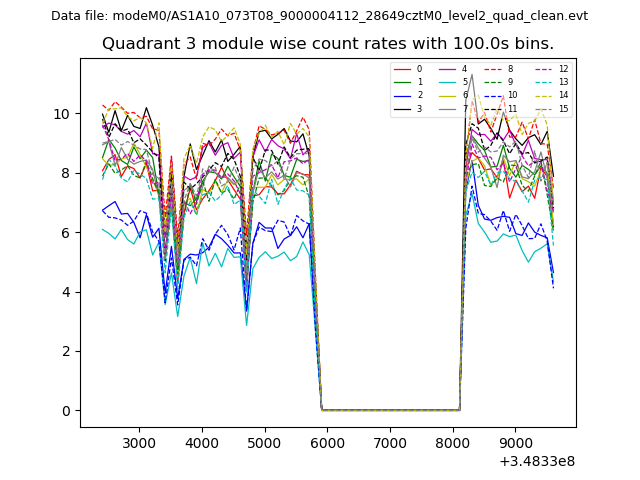
| Module-wise count rates for Quadrant A Data is divided into 100 sec bins |
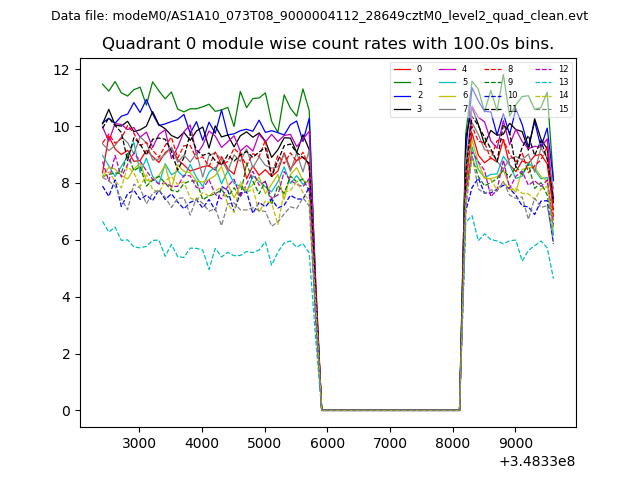 |
 |
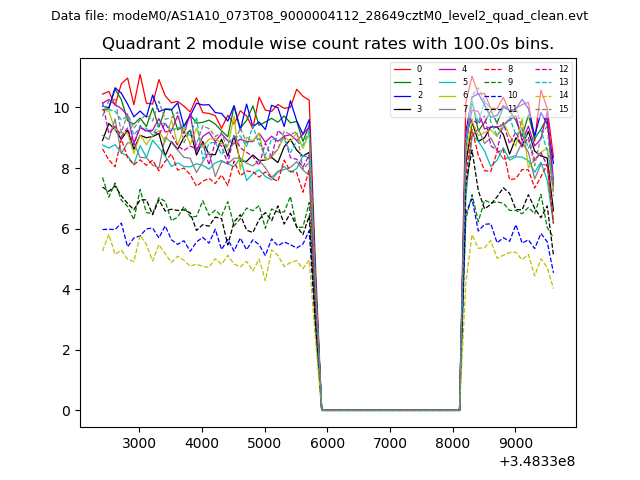
| Module-wise count rates for Quadrant B Data is divided into 100 sec bins |
 |
 |
| Module-wise count rates for Quadrant C Data is divided into 100 sec bins |
 |
 |
| Module-wise count rates for Quadrant D Data is divided into 100 sec bins |
 |
 |
| Parameter | Plot |
|---|---|
| CZT HV Monitor | 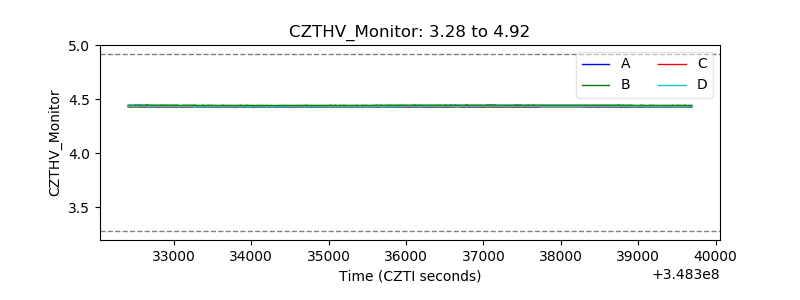 |
| D_VDD | 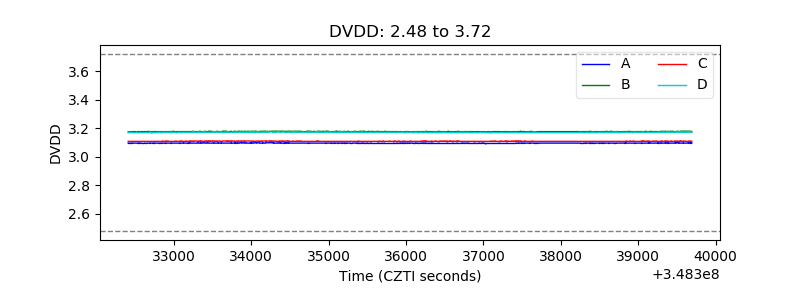 |
| Temperature 1 | 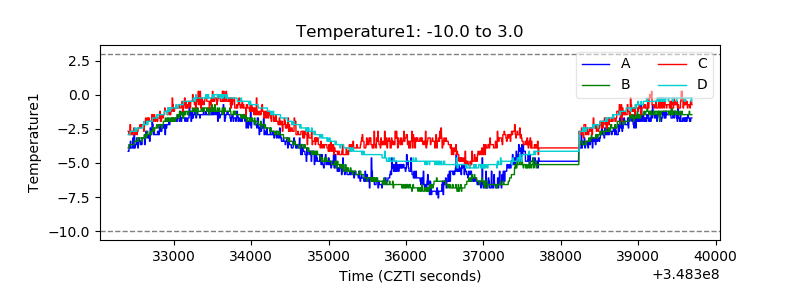 |
| Veto HV Monitor | 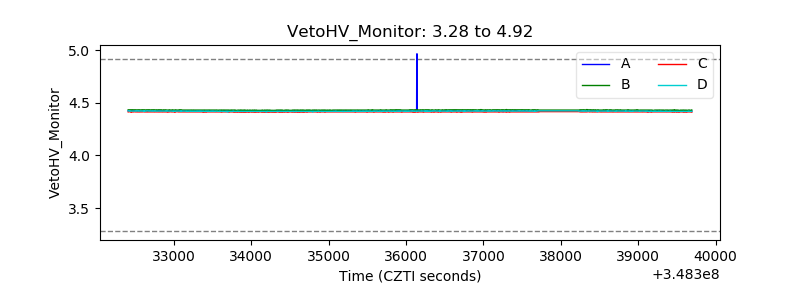 |
| Veto LLD | 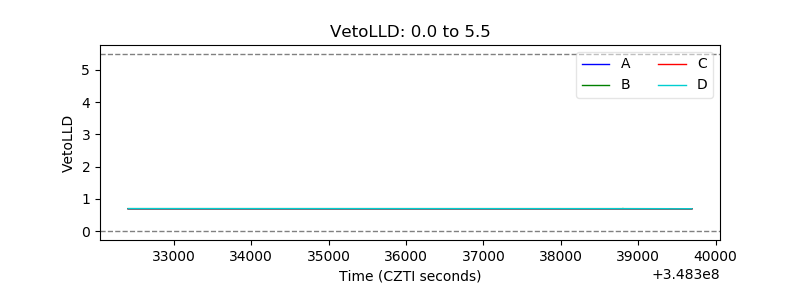 |
| Alpha Counter | 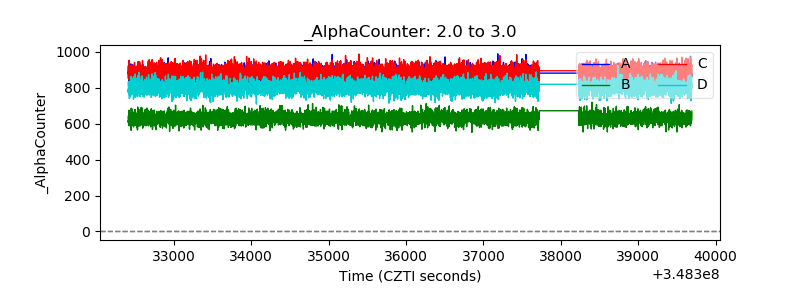 |
| _CPM_Rate | 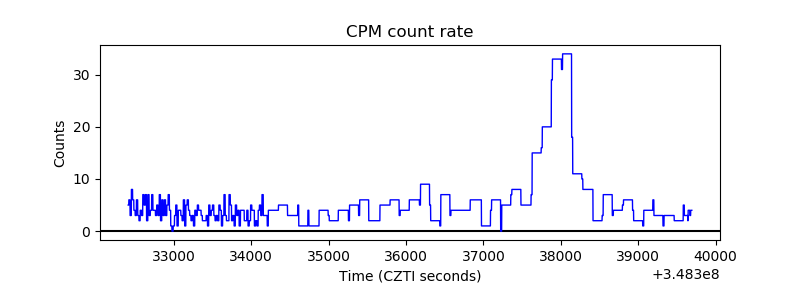 |
| CZT Counter | 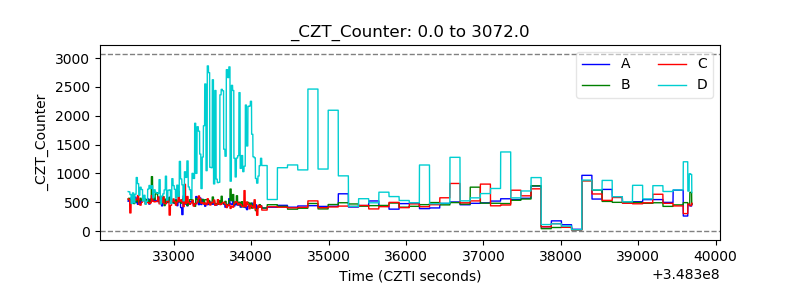 |
| +2.5 Volts monitor |  |
| +5 Volts monitor |  |
| _ROLL_ROT | 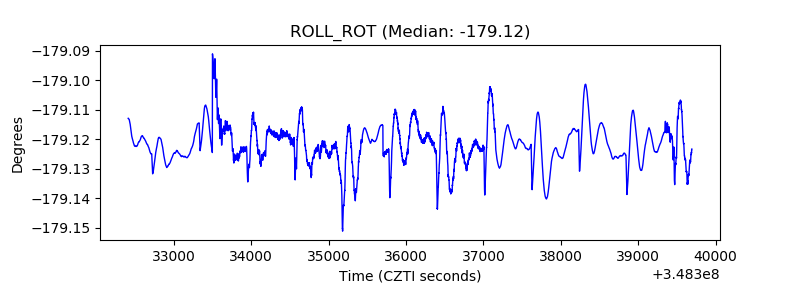 |
| _Roll_DEC | 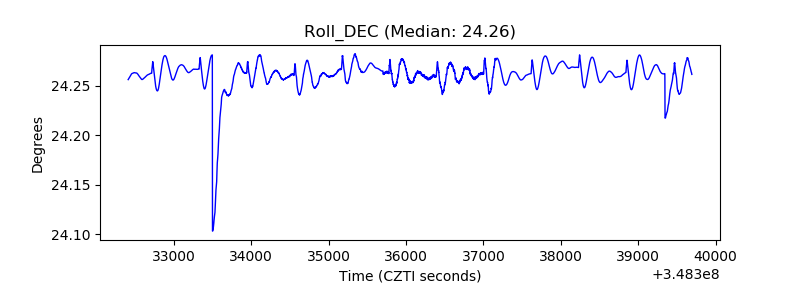 |
| _Roll_RA | 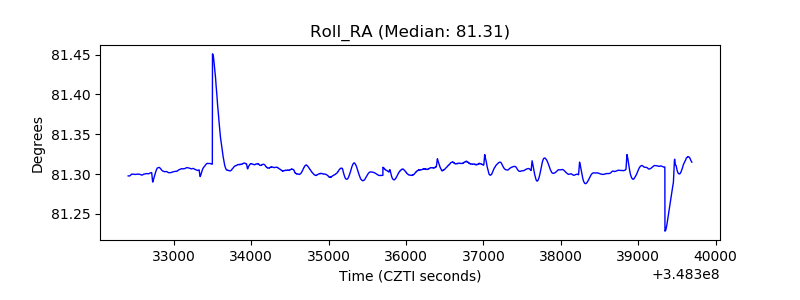 |
| Veto Counter | 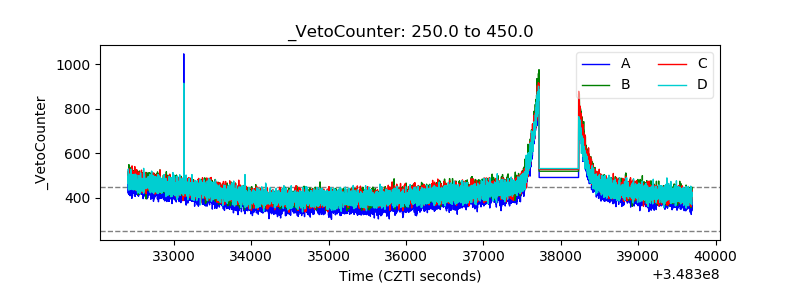 |