| Param | Original file | Final file |
|---|---|---|
| Filename | modeM0/AS1A10_073T08_9000004112_28650cztM0_level2.evt | modeM0/AS1A10_073T08_9000004112_28650cztM0_level2_quad_clean.evt |
| Size (bytes) | 674,884,800 | 113,688,000 |
| Size | 643.6 MB | 108.4 MB |
| Events in quadrant A | 4,950,351 | 734,920 |
| Events in quadrant B | 3,962,668 | 755,127 |
| Events in quadrant C | 4,017,619 | 724,793 |
| Events in quadrant D | 6,982,311 | 687,290 |
| Mode M0 | |||
|---|---|---|---|
| Quadrant | BADHDUFLAG | Total packets | Discarded packets |
| A | 0 | 19655 | 1 |
| B | 0 | 16695 | 1 |
| C | 0 | 16822 | 1 |
| D | 0 | 26123 | 3 |
| Mode SS | |||
|---|---|---|---|
| Quadrant | BADHDUFLAG | Total packets | Discarded packets |
| A | 0 | 156 | 0 |
| B | 0 | 156 | 0 |
| C | 0 | 156 | 0 |
| D | 0 | 156 | 0 |
| Mode M9 | |||
|---|---|---|---|
| Quadrant | BADHDUFLAG | Total packets | Discarded packets |
| A | 0 | 1 | 0 |
| B | 0 | 1 | 0 |
| C | 0 | 1 | 0 |
| D | 0 | 1 | 0 |
| Quadrant | Total seconds | Saturated seconds | Saturation percentage |
|---|---|---|---|
| A | 7774 | 539 | 6.933368% |
| B | 7775 | 275 | 3.536977% |
| C | 7775 | 409 | 5.260450% |
| D | 7774 | 498 | 6.405969% |
Noise dominated data is calculated using 1-second bins in cleaned event files. If a bin has >2000 counts, and if more than 50% of those come from <1% of pixels, then it is considered to be noise-dominated and hence unusable.
| Quadrant | # 1 sec bins | Bins with >0 counts | Bins with >2000 counts | High rate bins dominated by noise | Noise dominated (total time) | Noise dominated (detector-on time) | Marked lightcurve |
|---|---|---|---|---|---|---|---|
| A | 7814 | 7776 | 308 | 308 | 3.94% | 3.96% | 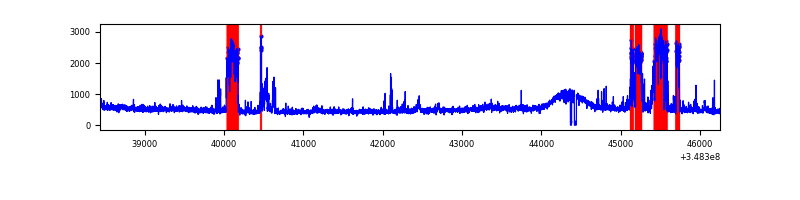 |
| B | 7815 | 7777 | 8 | 8 | 0.10% | 0.10% | 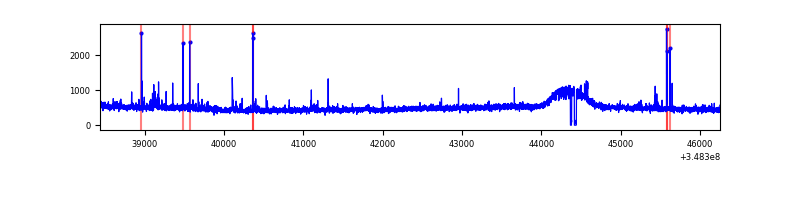 |
| C | 7815 | 7777 | 0 | 0 | 0.00% | 0.00% | 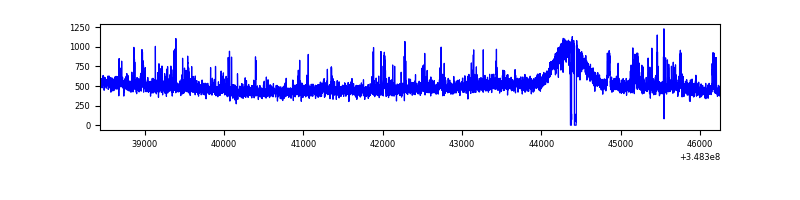 |
| D | 7814 | 7776 | 364 | 364 | 4.66% | 4.68% | 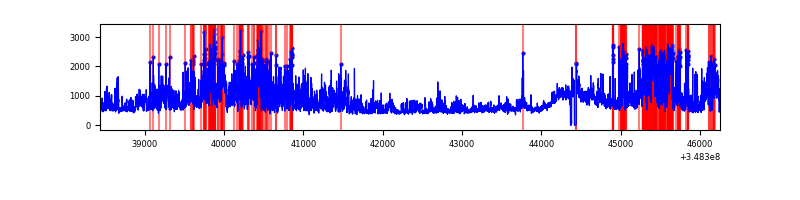 |
Top three noisy pixels from each quadrant. If the there are fewer than three noisy pixels in the level2.evt file, extra rows are filled as -1
| Pixel properties | Quadrant properties | ||||||
|---|---|---|---|---|---|---|---|
| Quadrant | DetID | PixID | Counts | Sigma | Mean | Median | Sigma |
| A | 15 | 174 | 1104996 | 5531.14 | 984 | 964 | 199.6 |
| A | 12 | 16 | 35316 | 172.1 | 984 | 964 | 199.6 |
| A | 13 | 254 | 14071 | 65.67 | 984 | 964 | 199.6 |
| B | 3 | 209 | 23539 | 117.97 | 979 | 953 | 191.5 |
| B | 12 | 111 | 23521 | 117.87 | 979 | 953 | 191.5 |
| B | 5 | 172 | 22803 | 114.12 | 979 | 953 | 191.5 |
| C | 14 | 238 | 217715 | 973.09 | 942 | 951 | 222.8 |
| C | 14 | 254 | 101381 | 450.85 | 942 | 951 | 222.8 |
| C | 7 | 247 | 18139 | 77.16 | 942 | 951 | 222.8 |
| D | 1 | 52 | 1864850 | 8067.53 | 954 | 931 | 231.0 |
| D | 8 | 195 | 1172920 | 5072.68 | 954 | 931 | 231.0 |
| D | 12 | 233 | 193768 | 834.65 | 954 | 931 | 231.0 |
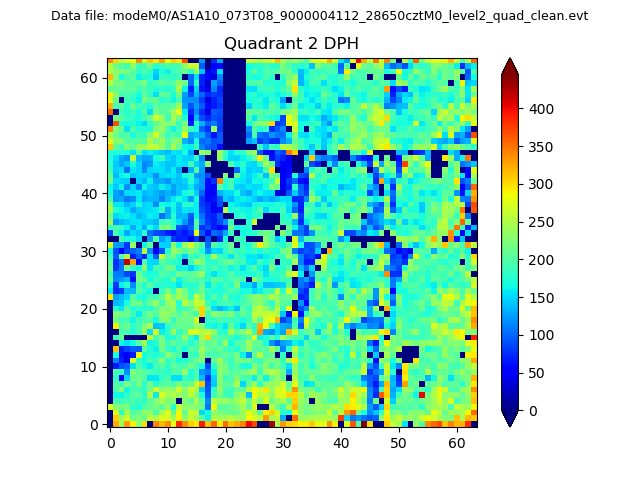
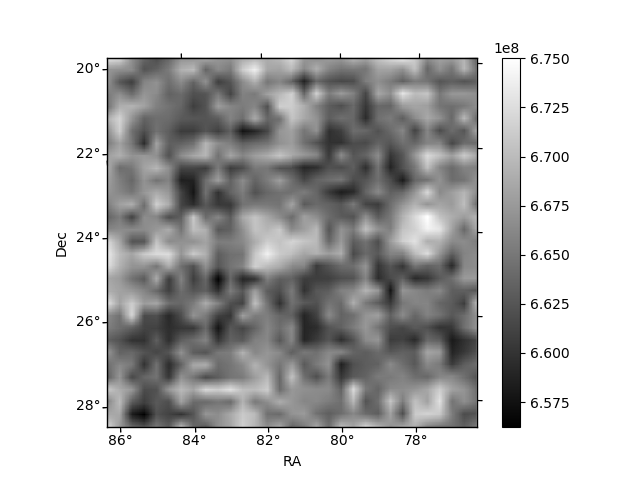
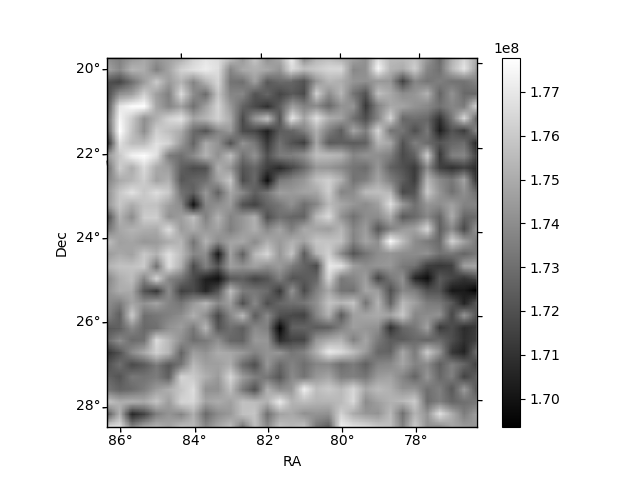
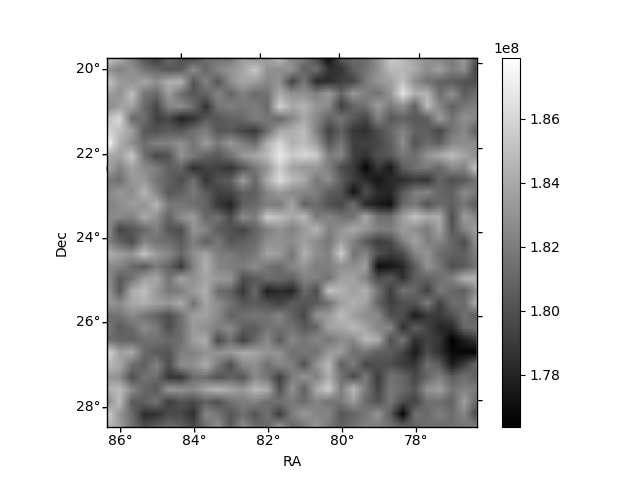
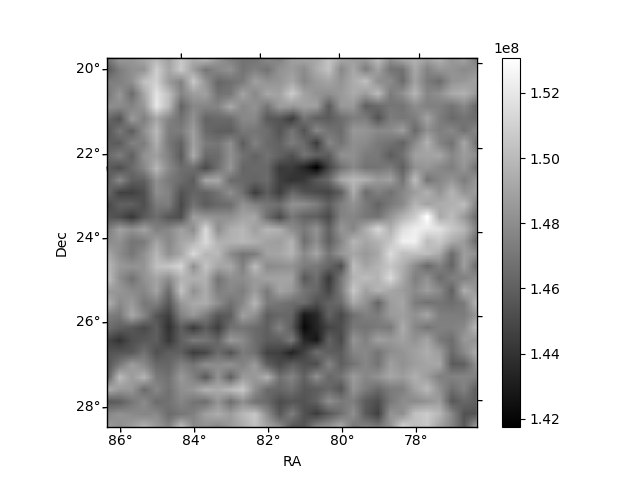
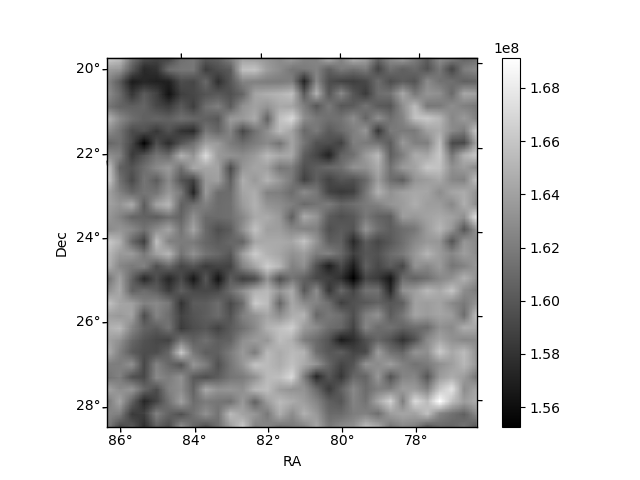
Histogram calculated using DETX and DETY for each event in the final _common_clean file
| Quadrant A | 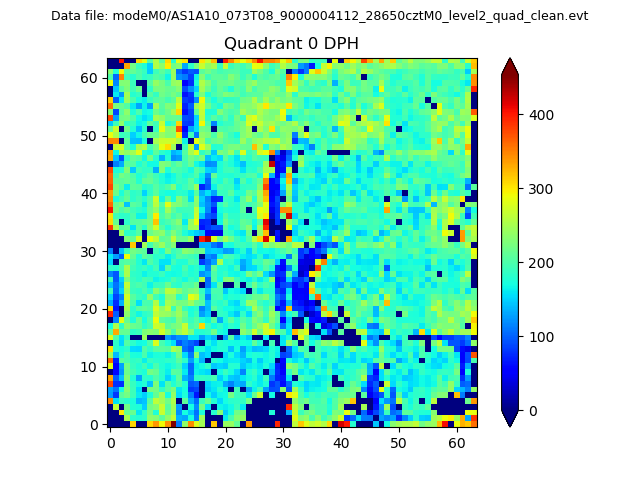 |
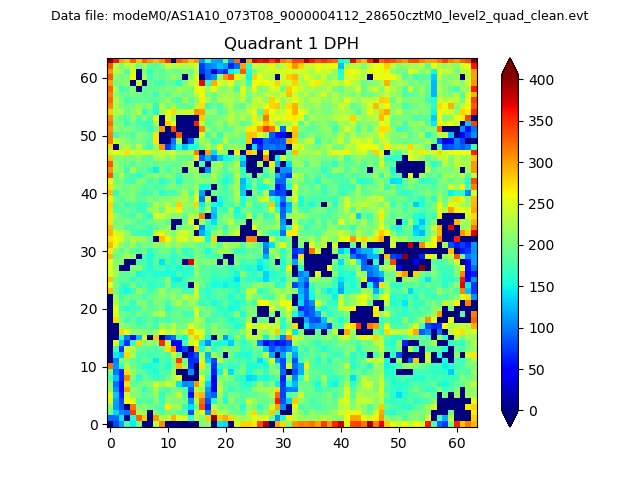 |
Quadrant B |
|---|---|---|---|
| Quadrant D | 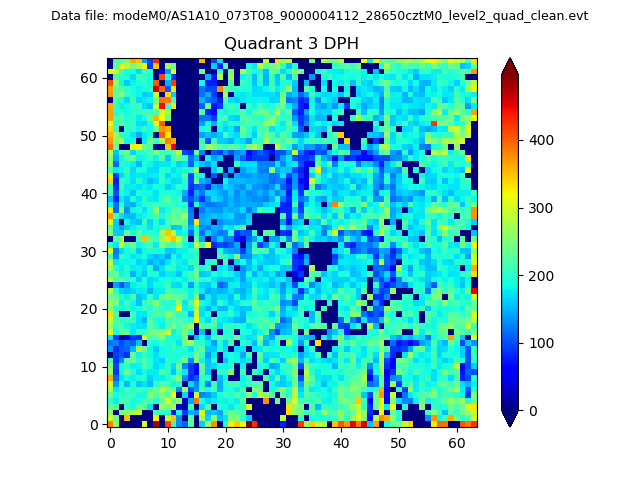 |
 |
Quadrant C |
| Plot type | Count rate plots | Images |
|---|---|---|
| Comparison with Poisson distribution Blue bars denote a histogram of data divided into 1 sec bins. Red curve is a Poisson curve with rate = median count rate of data. |
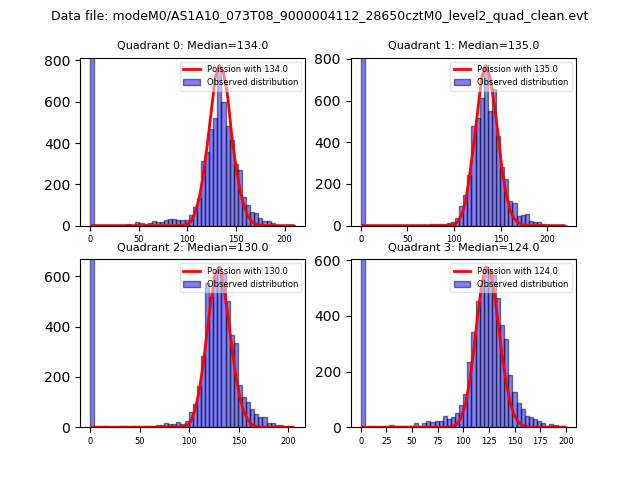 |
 |
| Quadrant-wise count rates Data is divided into 100 sec bins |
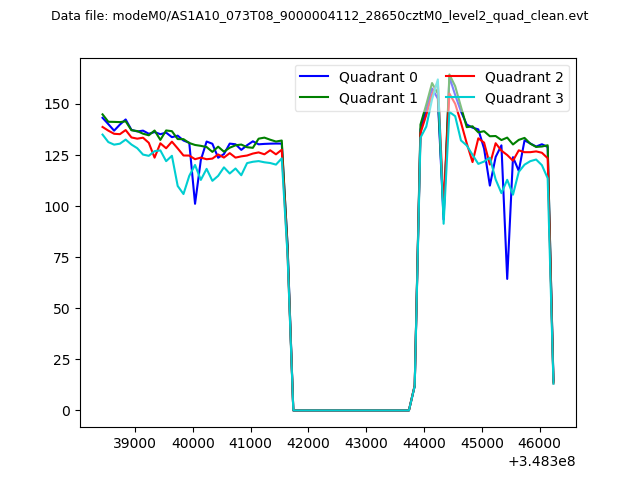 |
|
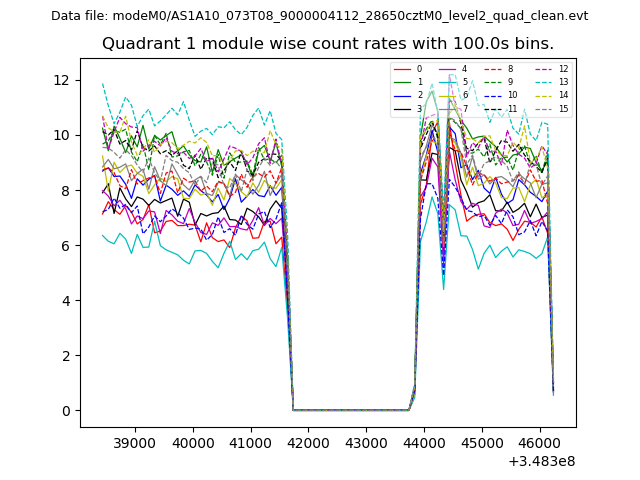
| Module-wise count rates for Quadrant A Data is divided into 100 sec bins |
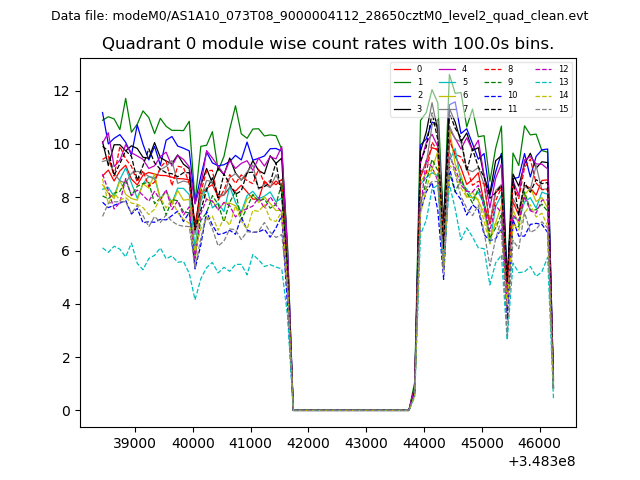 |
 |
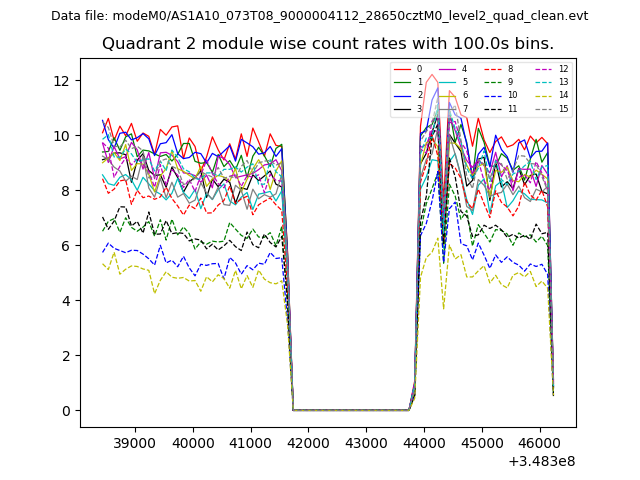
| Module-wise count rates for Quadrant B Data is divided into 100 sec bins |
 |
 |
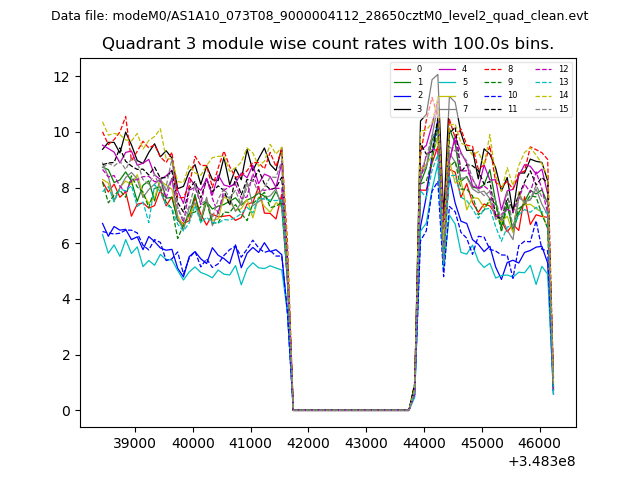
| Module-wise count rates for Quadrant C Data is divided into 100 sec bins |
 |
 |
| Module-wise count rates for Quadrant D Data is divided into 100 sec bins |
 |
 |
| Parameter | Plot |
|---|---|
| CZT HV Monitor | 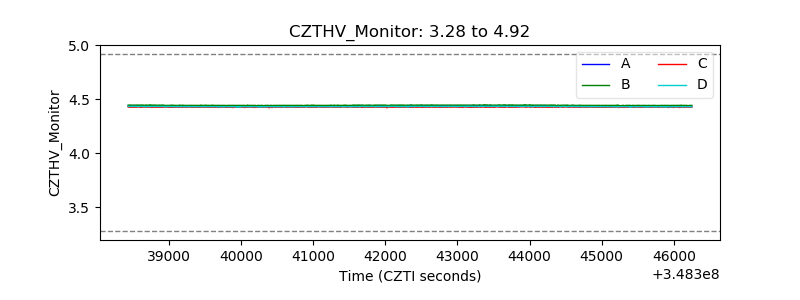 |
| D_VDD | 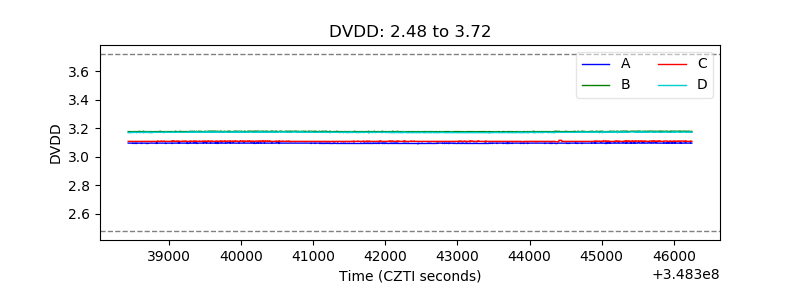 |
| Temperature 1 | 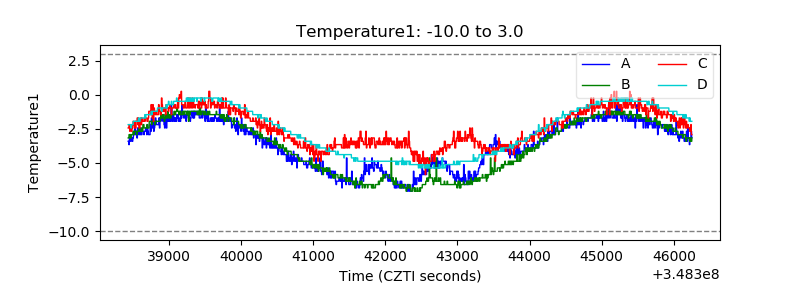 |
| Veto HV Monitor | 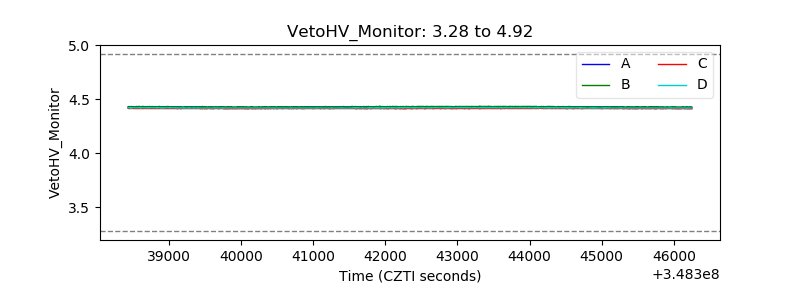 |
| Veto LLD | 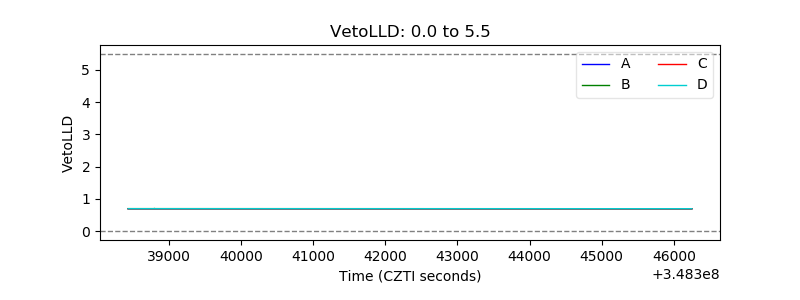 |
| Alpha Counter | 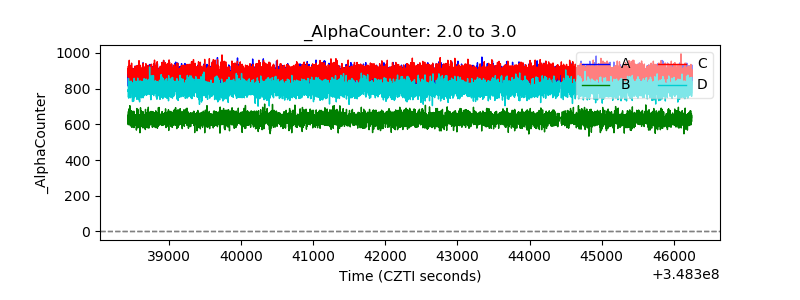 |
| _CPM_Rate | 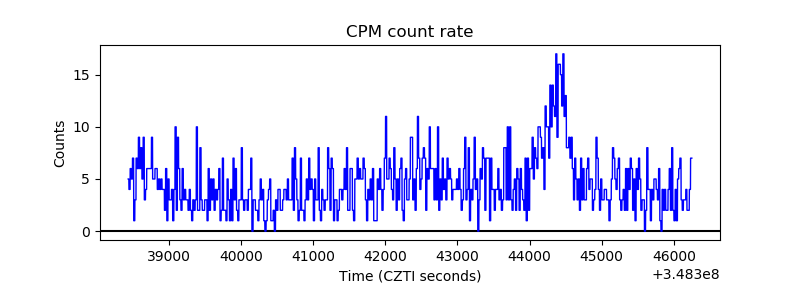 |
| CZT Counter | 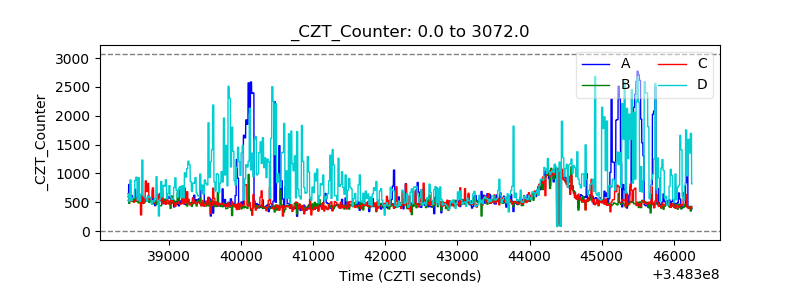 |
| +2.5 Volts monitor | 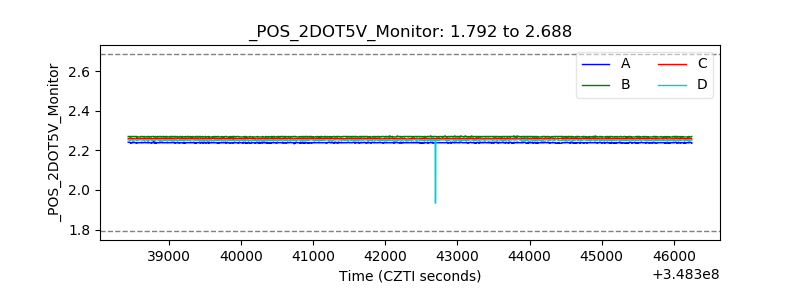 |
| +5 Volts monitor |  |
| _ROLL_ROT | 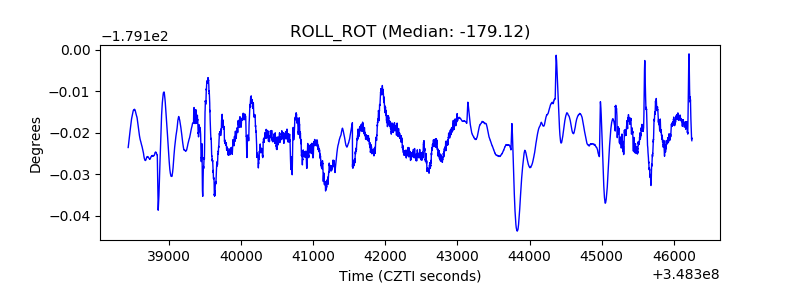 |
| _Roll_DEC | 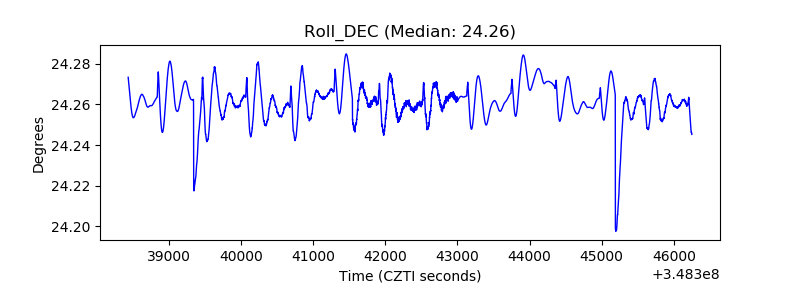 |
| _Roll_RA | 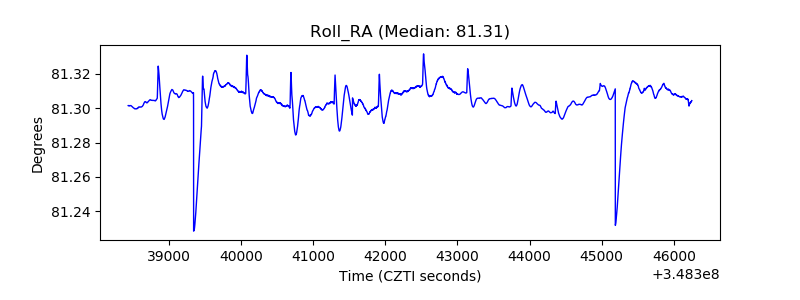 |
| Veto Counter | 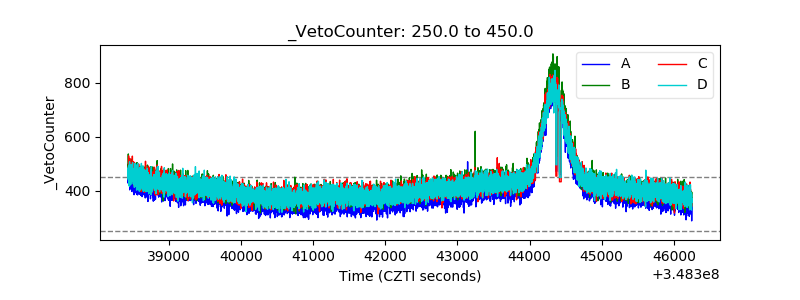 |