| Param | Original file | Final file |
|---|---|---|
| Filename | modeM0/AS1A10_073T08_9000004112_28651cztM0_level2.evt | modeM0/AS1A10_073T08_9000004112_28651cztM0_level2_quad_clean.evt |
| Size (bytes) | 734,676,480 | 113,451,840 |
| Size | 700.6 MB | 108.2 MB |
| Events in quadrant A | 4,775,861 | 743,042 |
| Events in quadrant B | 4,121,784 | 758,350 |
| Events in quadrant C | 4,037,719 | 731,010 |
| Events in quadrant D | 8,784,849 | 658,289 |
| Mode M0 | |||
|---|---|---|---|
| Quadrant | BADHDUFLAG | Total packets | Discarded packets |
| A | 0 | 19318 | 2 |
| B | 0 | 17253 | 2 |
| C | 0 | 16991 | 3 |
| D | 0 | 31571 | 2 |
| Mode SS | |||
|---|---|---|---|
| Quadrant | BADHDUFLAG | Total packets | Discarded packets |
| A | 0 | 158 | 0 |
| B | 0 | 158 | 0 |
| C | 0 | 158 | 0 |
| D | 0 | 158 | 0 |
| Mode M9 | |||
|---|---|---|---|
| Quadrant | BADHDUFLAG | Total packets | Discarded packets |
| A | 0 | 3 | 0 |
| B | 0 | 3 | 0 |
| C | 0 | 3 | 0 |
| D | 0 | 3 | 0 |
| Quadrant | Total seconds | Saturated seconds | Saturation percentage |
|---|---|---|---|
| A | 7835 | 517 | 6.598596% |
| B | 7836 | 319 | 4.070955% |
| C | 7835 | 435 | 5.552010% |
| D | 7835 | 1217 | 15.532865% |
Noise dominated data is calculated using 1-second bins in cleaned event files. If a bin has >2000 counts, and if more than 50% of those come from <1% of pixels, then it is considered to be noise-dominated and hence unusable.
| Quadrant | # 1 sec bins | Bins with >0 counts | Bins with >2000 counts | High rate bins dominated by noise | Noise dominated (total time) | Noise dominated (detector-on time) | Marked lightcurve |
|---|---|---|---|---|---|---|---|
| A | 8055 | 7838 | 248 | 248 | 3.08% | 3.16% | 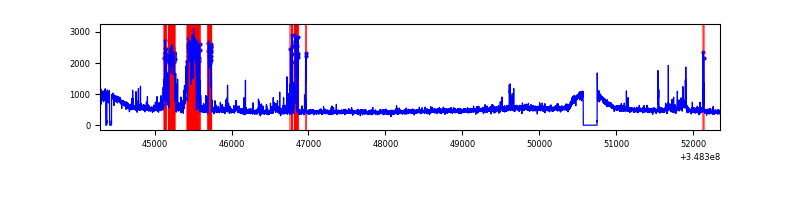 |
| B | 8056 | 7839 | 9 | 9 | 0.11% | 0.11% | 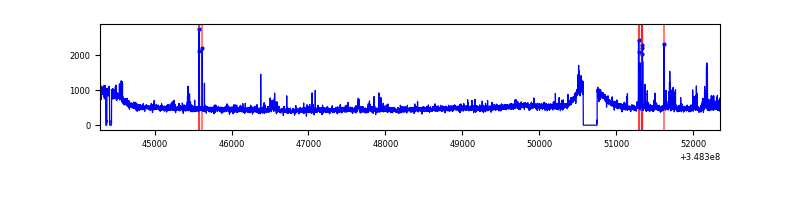 |
| C | 8055 | 7838 | 0 | 0 | 0.00% | 0.00% | 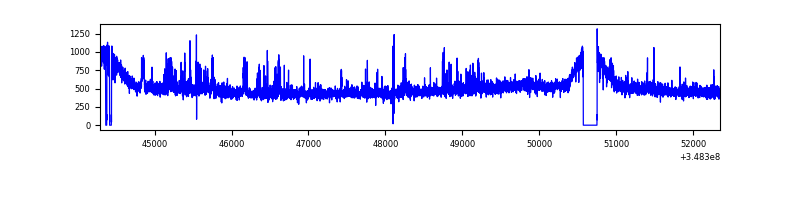 |
| D | 8055 | 7838 | 1043 | 1043 | 12.95% | 13.31% | 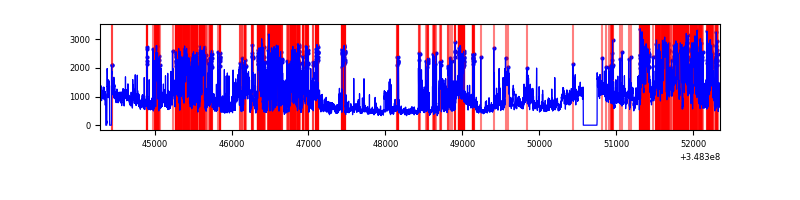 |
Top three noisy pixels from each quadrant. If the there are fewer than three noisy pixels in the level2.evt file, extra rows are filled as -1
| Pixel properties | Quadrant properties | ||||||
|---|---|---|---|---|---|---|---|
| Quadrant | DetID | PixID | Counts | Sigma | Mean | Median | Sigma |
| A | 15 | 174 | 911963 | 4484.24 | 995 | 976 | 203.2 |
| A | 13 | 254 | 13910 | 63.67 | 995 | 976 | 203.2 |
| A | 3 | 137 | 9783 | 43.35 | 995 | 976 | 203.2 |
| B | 10 | 245 | 116062 | 602.01 | 989 | 963 | 191.2 |
| B | 5 | 172 | 33105 | 168.11 | 989 | 963 | 191.2 |
| B | 12 | 111 | 24125 | 121.15 | 989 | 963 | 191.2 |
| C | 14 | 238 | 216770 | 951.12 | 950 | 956 | 226.9 |
| C | 14 | 254 | 95954 | 418.67 | 950 | 956 | 226.9 |
| C | 7 | 247 | 14662 | 60.4 | 950 | 956 | 226.9 |
| D | 1 | 52 | 3757134 | 16723.9 | 930 | 904 | 224.6 |
| D | 8 | 195 | 1251949 | 5570.04 | 930 | 904 | 224.6 |
| D | 12 | 233 | 131288 | 580.51 | 930 | 904 | 224.6 |
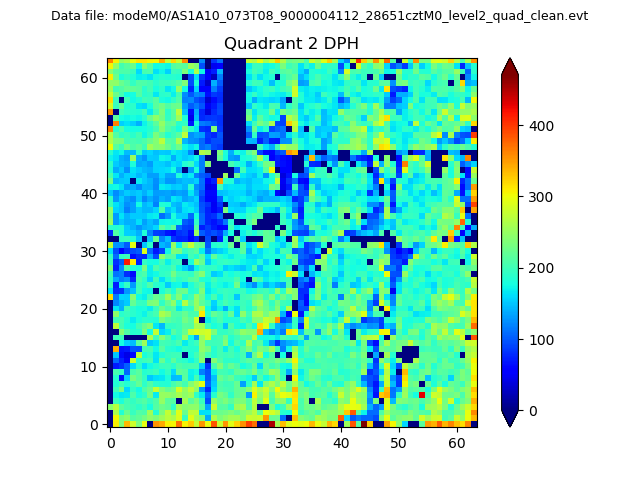
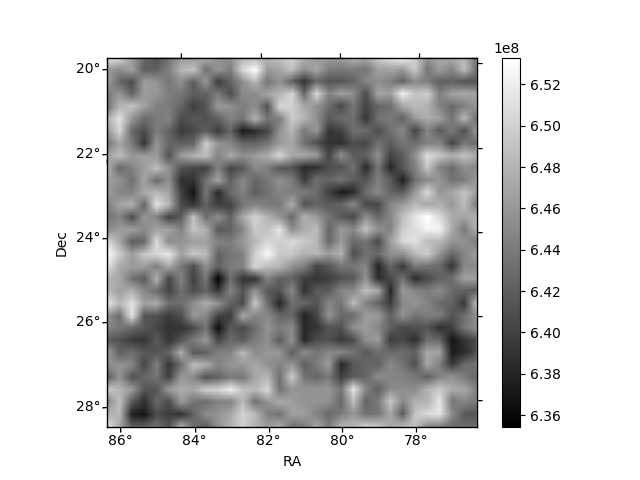
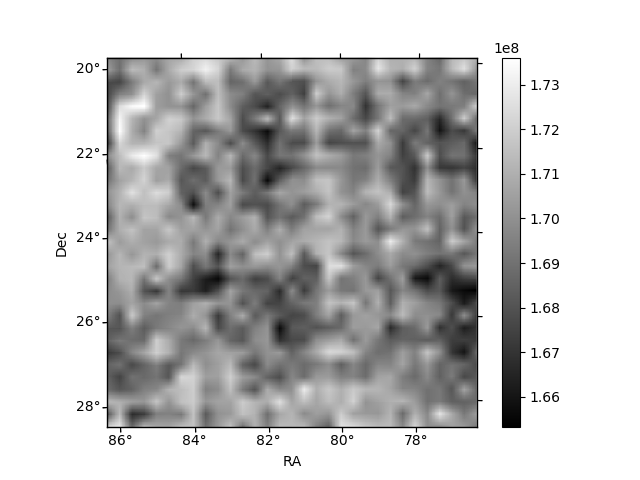
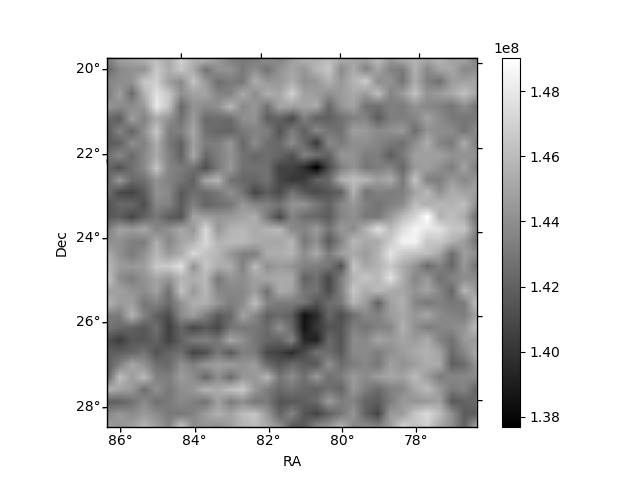
Histogram calculated using DETX and DETY for each event in the final _common_clean file
| Quadrant A | 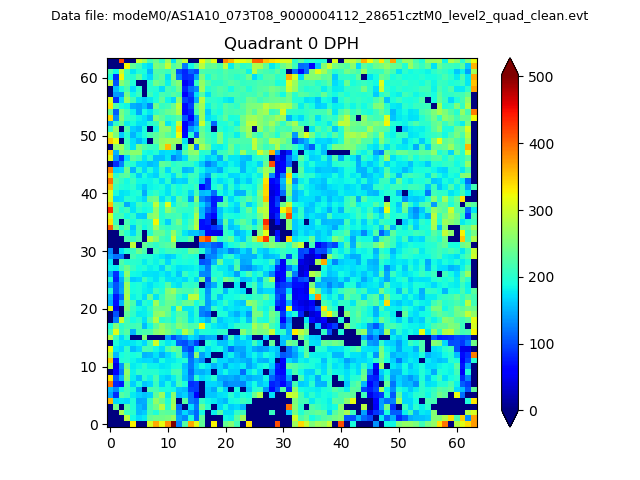 |
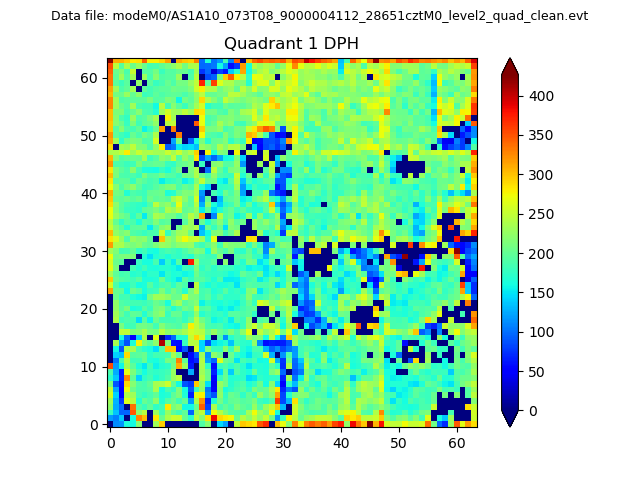 |
Quadrant B |
|---|---|---|---|
| Quadrant D | 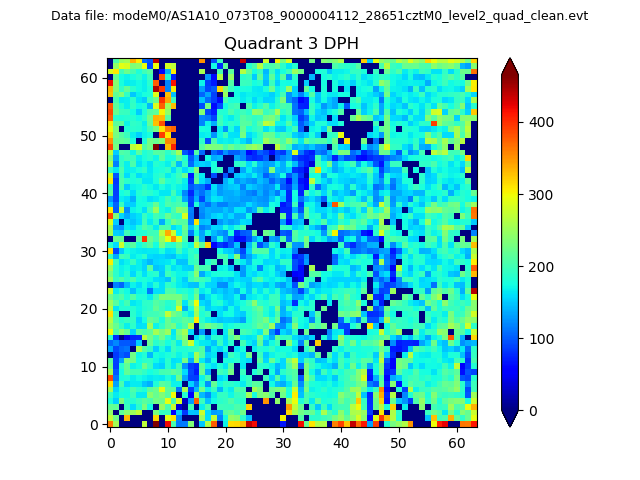 |
 |
Quadrant C |
| Plot type | Count rate plots | Images |
|---|---|---|
| Comparison with Poisson distribution Blue bars denote a histogram of data divided into 1 sec bins. Red curve is a Poisson curve with rate = median count rate of data. |
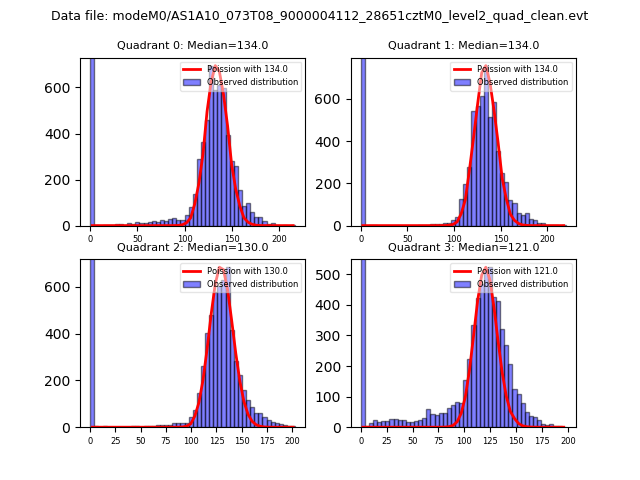 |
 |
| Quadrant-wise count rates Data is divided into 100 sec bins |
 |
|
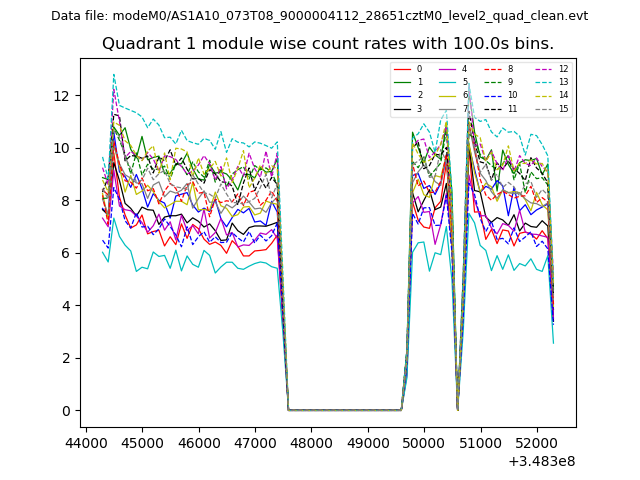
| Module-wise count rates for Quadrant A Data is divided into 100 sec bins |
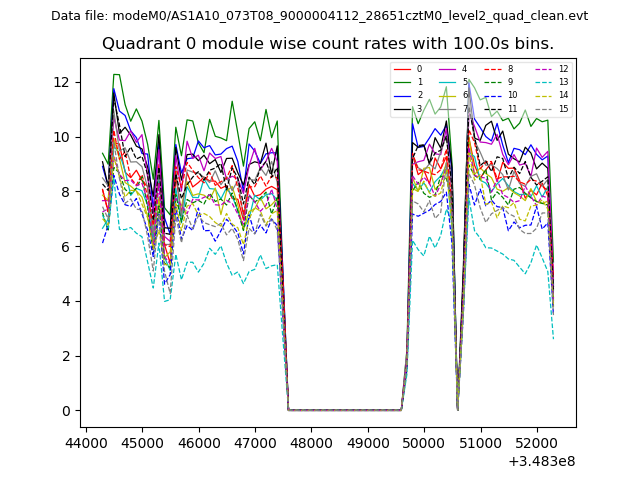 |
 |
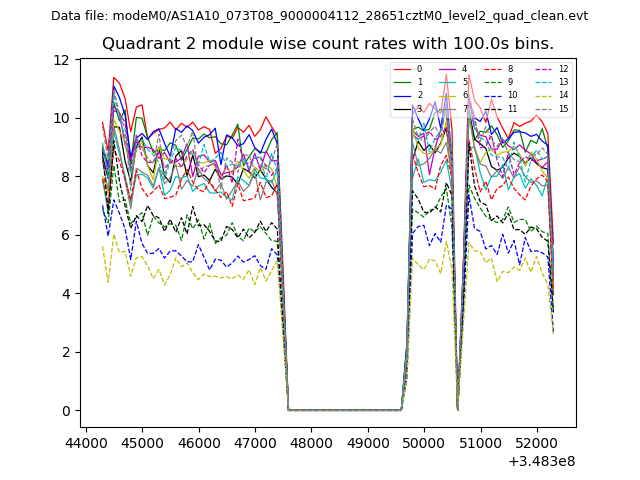
| Module-wise count rates for Quadrant B Data is divided into 100 sec bins |
 |
 |
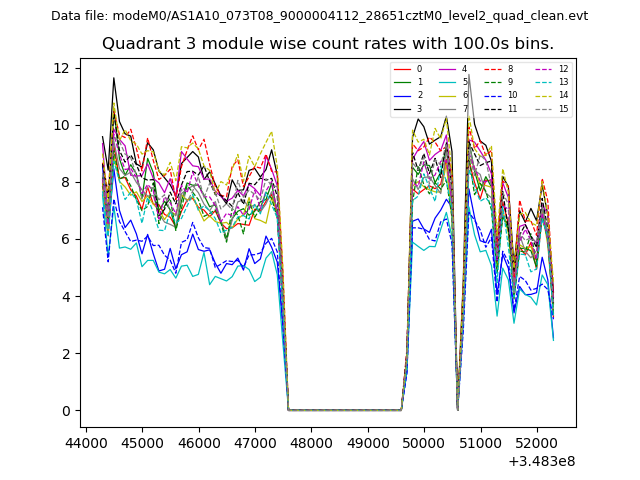
| Module-wise count rates for Quadrant C Data is divided into 100 sec bins |
 |
 |
| Module-wise count rates for Quadrant D Data is divided into 100 sec bins |
 |
 |
| Parameter | Plot |
|---|---|
| CZT HV Monitor | 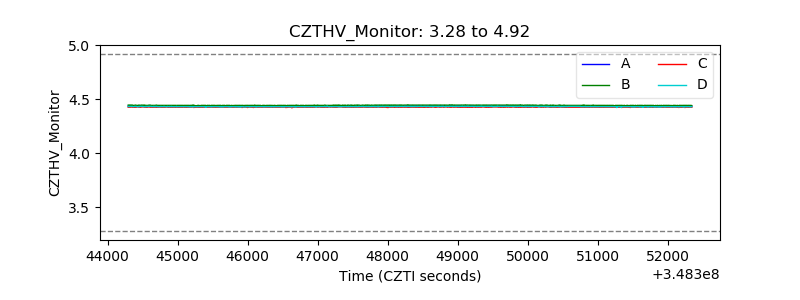 |
| D_VDD |  |
| Temperature 1 | 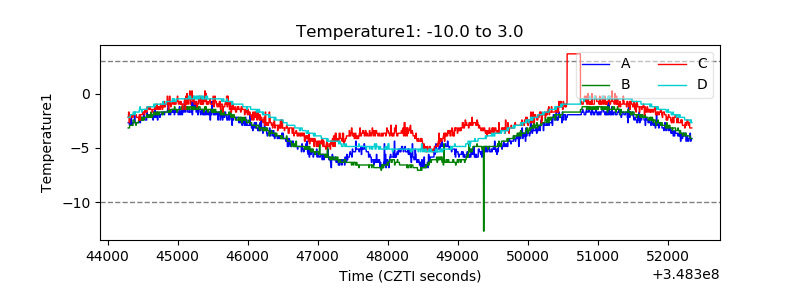 |
| Veto HV Monitor | 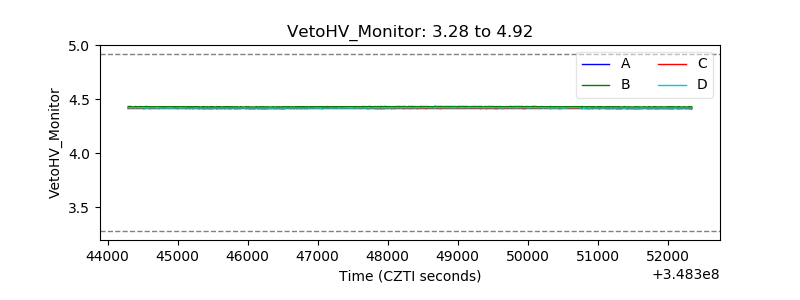 |
| Veto LLD | 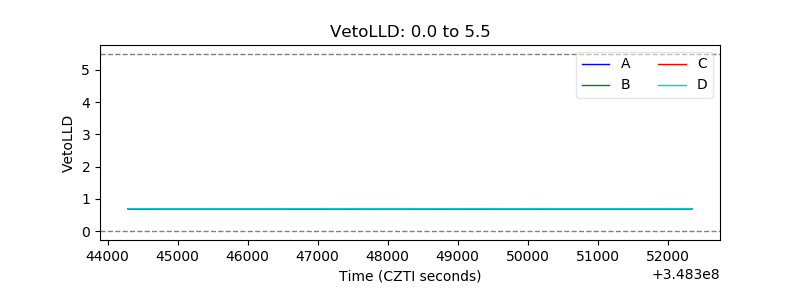 |
| Alpha Counter | 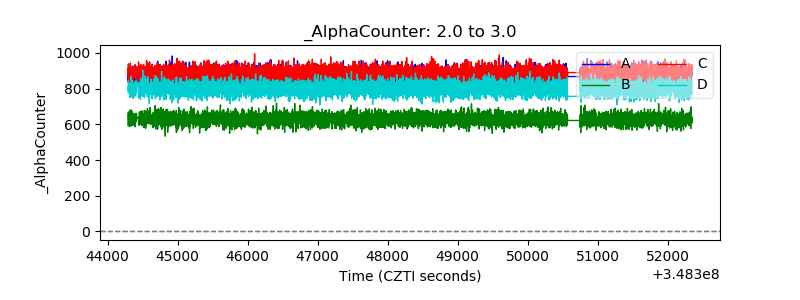 |
| _CPM_Rate | 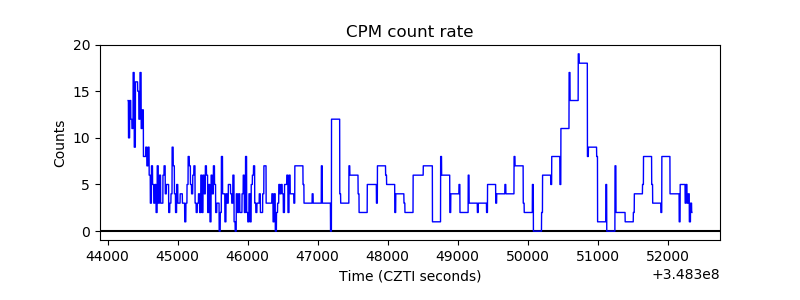 |
| CZT Counter | 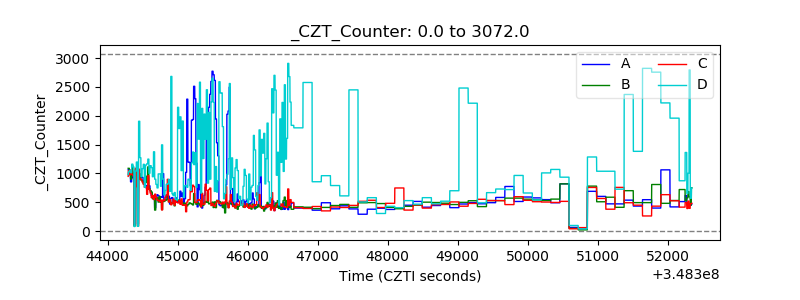 |
| +2.5 Volts monitor |  |
| +5 Volts monitor |  |
| _ROLL_ROT | 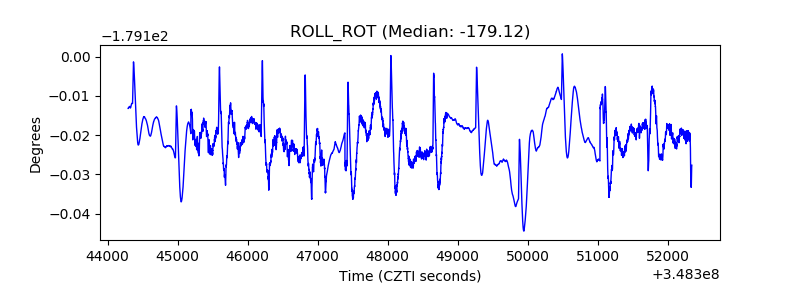 |
| _Roll_DEC | 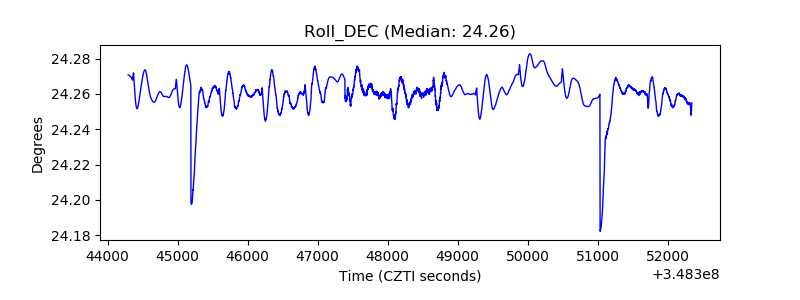 |
| _Roll_RA | 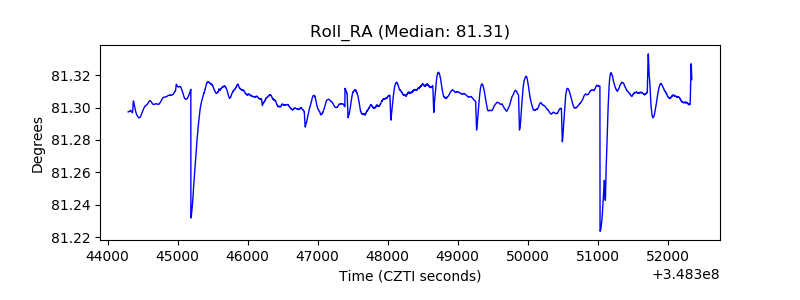 |
| Veto Counter | 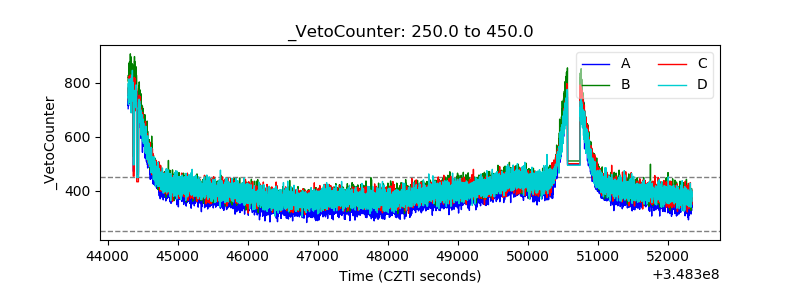 |