| Param | Original file | Final file |
|---|---|---|
| Filename | modeM0/AS1A10_073T08_9000004112_28654cztM0_level2.evt | modeM0/AS1A10_073T08_9000004112_28654cztM0_level2_quad_clean.evt |
| Size (bytes) | 1,547,686,080 | 233,136,000 |
| Size | 1.4 GB | 222.3 MB |
| Events in quadrant A | 9,213,794 | 1,525,833 |
| Events in quadrant B | 9,847,070 | 1,530,789 |
| Events in quadrant C | 8,906,429 | 1,470,902 |
| Events in quadrant D | 17,663,614 | 1,264,933 |
| Mode M0 | |||
|---|---|---|---|
| Quadrant | BADHDUFLAG | Total packets | Discarded packets |
| A | 0 | 39539 | 3 |
| B | 0 | 41103 | 3 |
| C | 0 | 38156 | 3 |
| D | 0 | 64970 | 3 |
| Mode SS | |||
|---|---|---|---|
| Quadrant | BADHDUFLAG | Total packets | Discarded packets |
| A | 0 | 372 | 0 |
| B | 0 | 372 | 0 |
| C | 0 | 372 | 0 |
| D | 0 | 372 | 0 |
| Mode M9 | |||
|---|---|---|---|
| Quadrant | BADHDUFLAG | Total packets | Discarded packets |
| A | 0 | 19 | 0 |
| B | 0 | 19 | 0 |
| C | 0 | 19 | 0 |
| D | 0 | 19 | 0 |
| Quadrant | Total seconds | Saturated seconds | Saturation percentage |
|---|---|---|---|
| A | 18399 | 148 | 0.804392% |
| B | 18399 | 200 | 1.087016% |
| C | 18399 | 484 | 2.630578% |
| D | 18400 | 2555 | 13.885870% |
Noise dominated data is calculated using 1-second bins in cleaned event files. If a bin has >2000 counts, and if more than 50% of those come from <1% of pixels, then it is considered to be noise-dominated and hence unusable.
| Quadrant | # 1 sec bins | Bins with >0 counts | Bins with >2000 counts | High rate bins dominated by noise | Noise dominated (total time) | Noise dominated (detector-on time) | Marked lightcurve |
|---|---|---|---|---|---|---|---|
| A | 20259 | 18402 | 53 | 53 | 0.26% | 0.29% | 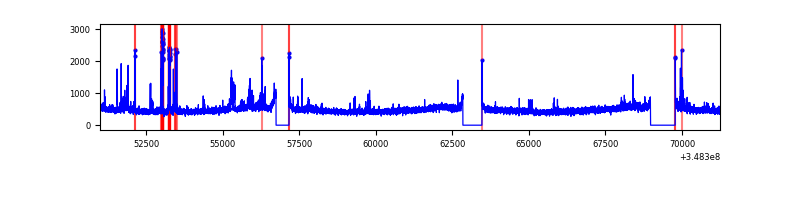 |
| B | 20259 | 18402 | 36 | 36 | 0.18% | 0.20% | 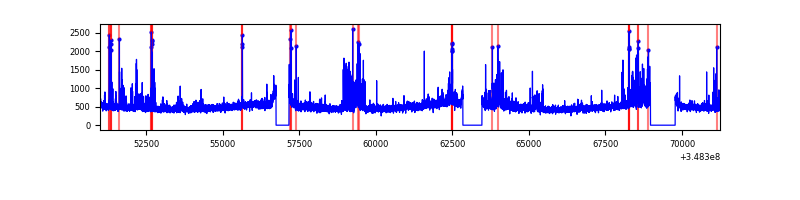 |
| C | 20259 | 18402 | 4 | 4 | 0.02% | 0.02% | 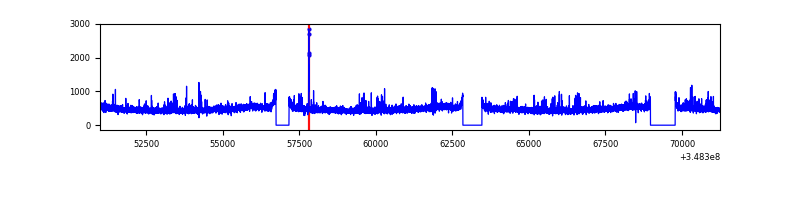 |
| D | 20260 | 18403 | 2367 | 2367 | 11.68% | 12.86% | 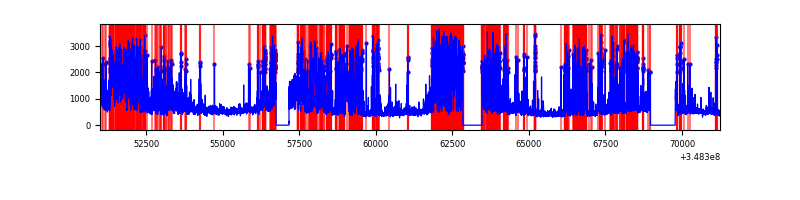 |
Top three noisy pixels from each quadrant. If the there are fewer than three noisy pixels in the level2.evt file, extra rows are filled as -1
| Pixel properties | Quadrant properties | ||||||
|---|---|---|---|---|---|---|---|
| Quadrant | DetID | PixID | Counts | Sigma | Mean | Median | Sigma |
| A | 15 | 174 | 564918 | 1261.4 | 2212 | 2169 | 446.1 |
| A | 12 | 16 | 46358 | 99.05 | 2212 | 2169 | 446.1 |
| A | 14 | 238 | 40300 | 85.47 | 2212 | 2169 | 446.1 |
| B | 10 | 245 | 1084572 | 2596.61 | 2193 | 2140 | 416.9 |
| B | 12 | 111 | 52430 | 120.64 | 2193 | 2140 | 416.9 |
| B | 11 | 111 | 47211 | 108.12 | 2193 | 2140 | 416.9 |
| C | 14 | 238 | 444721 | 890.31 | 2114 | 2133 | 497.1 |
| C | 14 | 254 | 168642 | 334.95 | 2114 | 2133 | 497.1 |
| C | 2 | 16 | 38169 | 72.49 | 2114 | 2133 | 497.1 |
| D | 1 | 52 | 8191467 | 17195.29 | 1980 | 1927 | 476.3 |
| D | 8 | 195 | 1338862 | 2807.12 | 1980 | 1927 | 476.3 |
| D | 13 | 104 | 236140 | 491.77 | 1980 | 1927 | 476.3 |
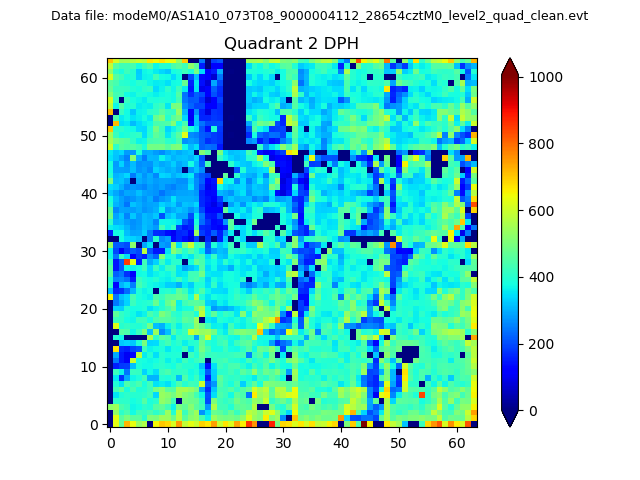
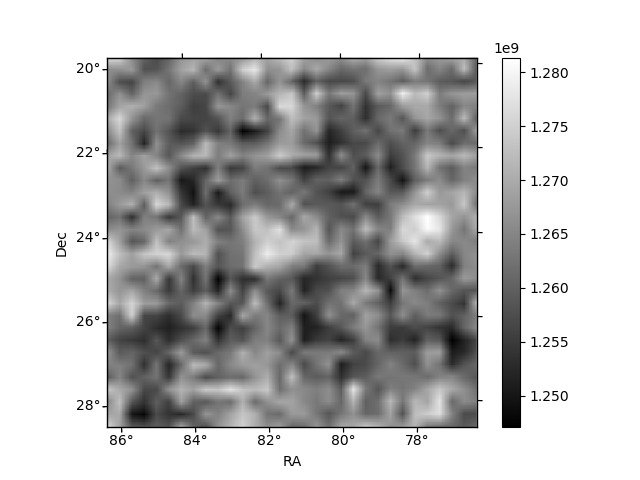
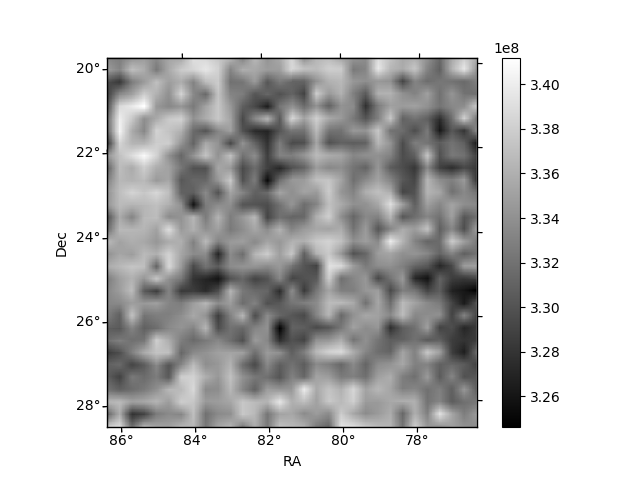
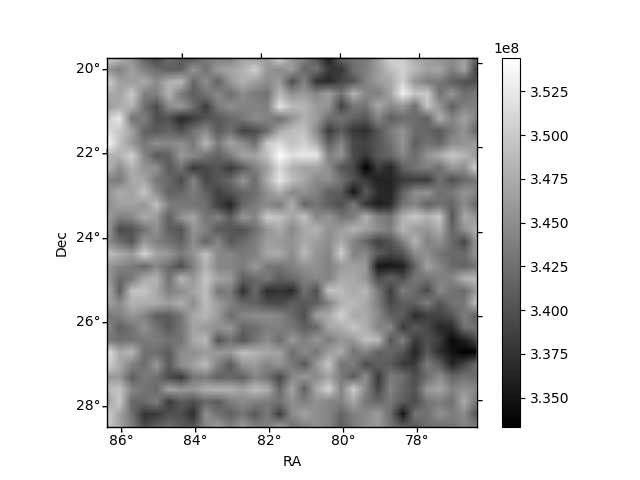
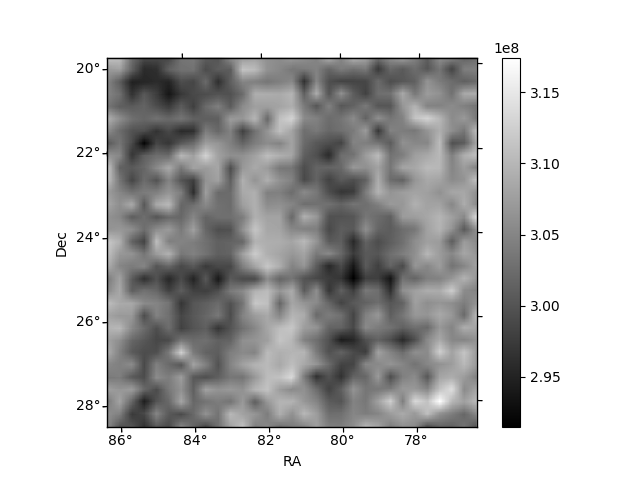
Histogram calculated using DETX and DETY for each event in the final _common_clean file
| Quadrant A | 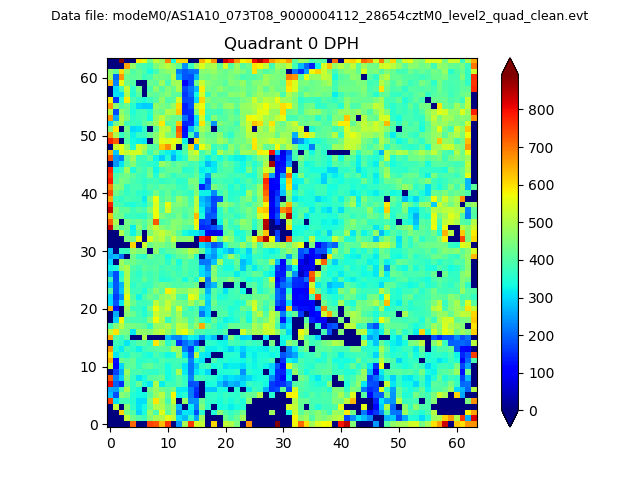 |
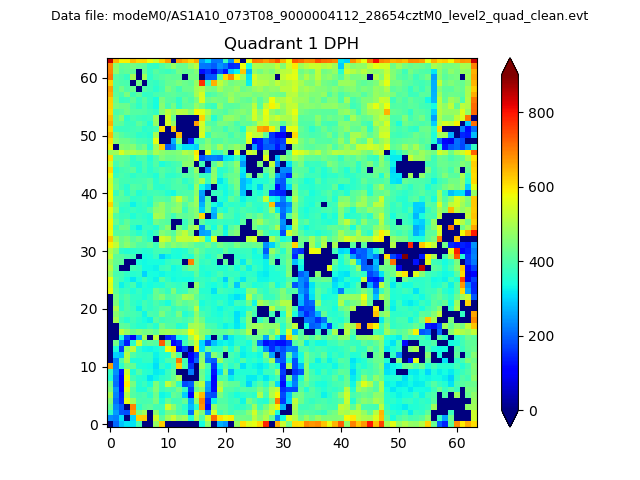 |
Quadrant B |
|---|---|---|---|
| Quadrant D | 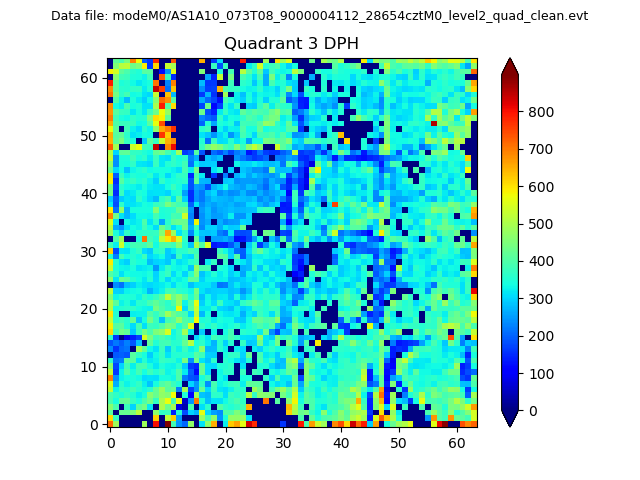 |
 |
Quadrant C |
| Plot type | Count rate plots | Images |
|---|---|---|
| Comparison with Poisson distribution Blue bars denote a histogram of data divided into 1 sec bins. Red curve is a Poisson curve with rate = median count rate of data. |
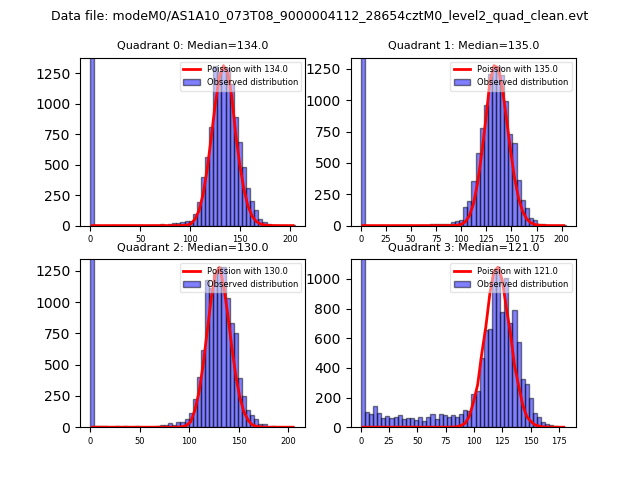 |
 |
| Quadrant-wise count rates Data is divided into 100 sec bins |
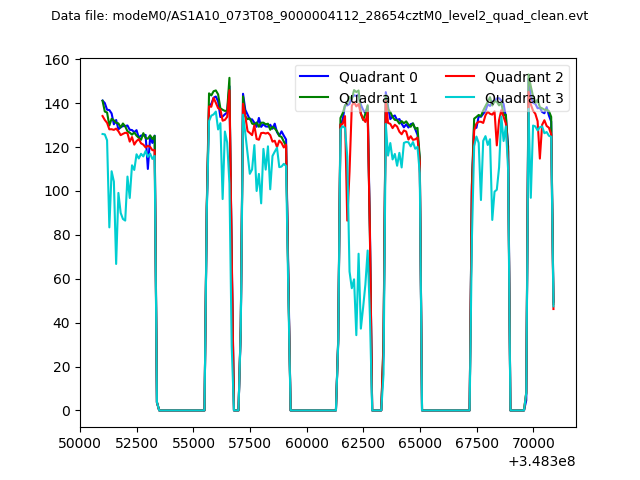 |
|
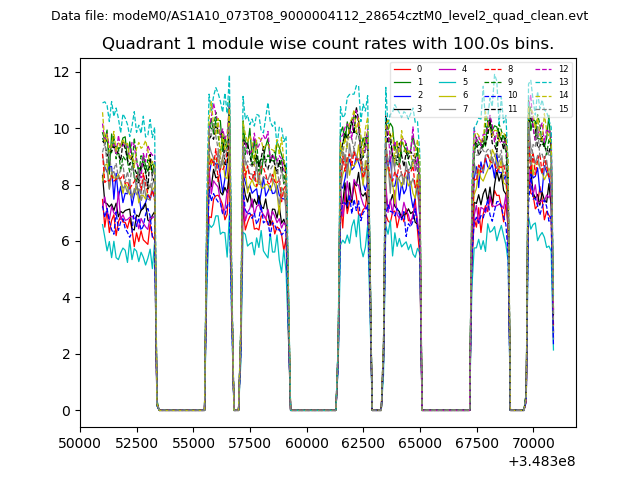
| Module-wise count rates for Quadrant A Data is divided into 100 sec bins |
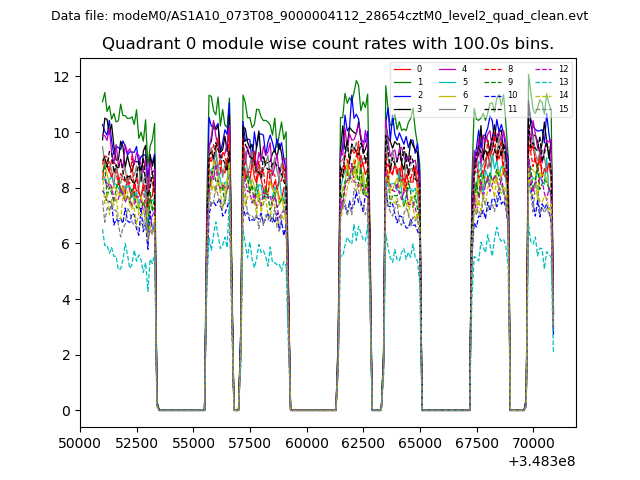 |
 |
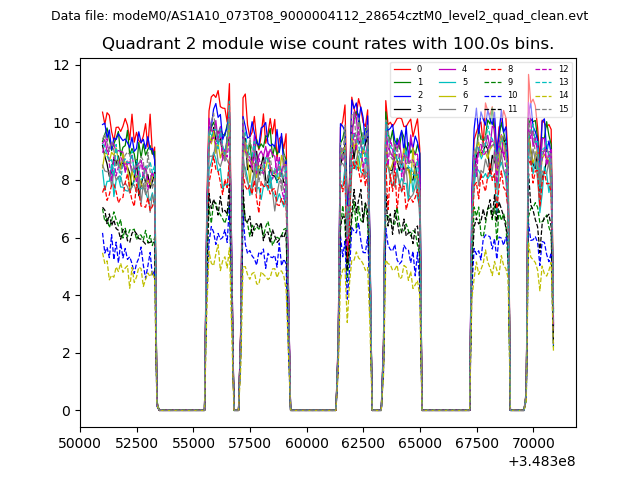
| Module-wise count rates for Quadrant B Data is divided into 100 sec bins |
 |
 |
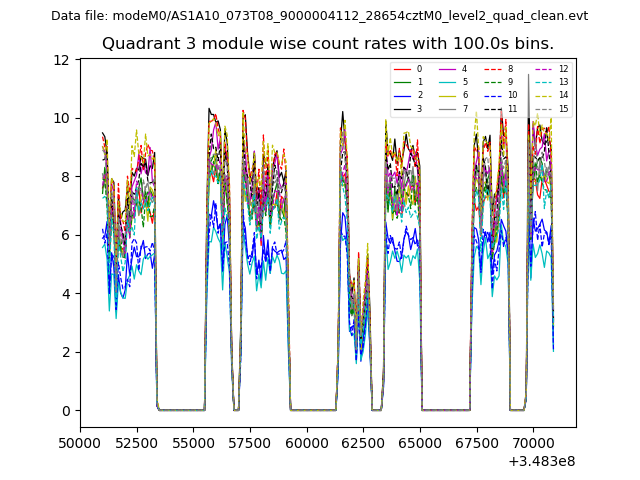
| Module-wise count rates for Quadrant C Data is divided into 100 sec bins |
 |
 |
| Module-wise count rates for Quadrant D Data is divided into 100 sec bins |
 |
 |
| Parameter | Plot |
|---|---|
| CZT HV Monitor | 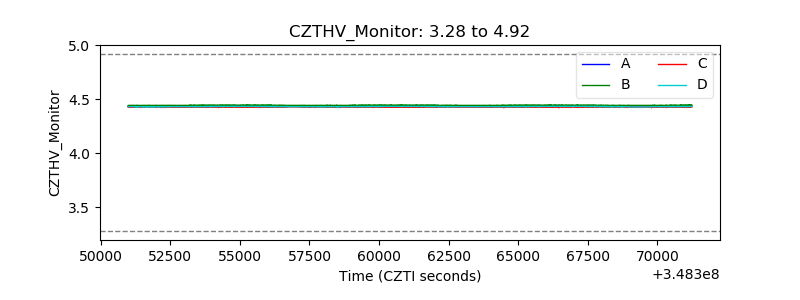 |
| D_VDD | 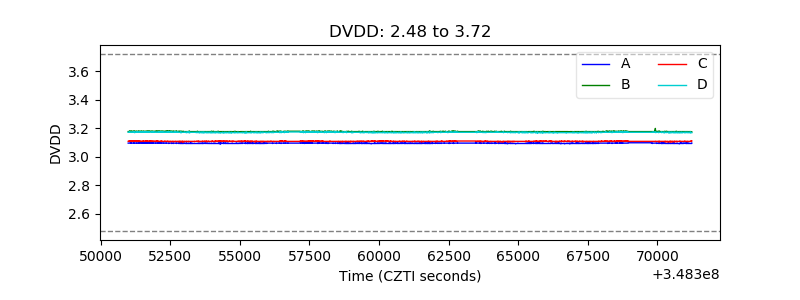 |
| Temperature 1 | 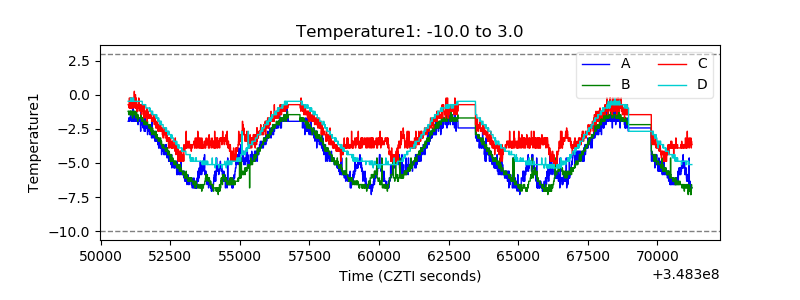 |
| Veto HV Monitor | 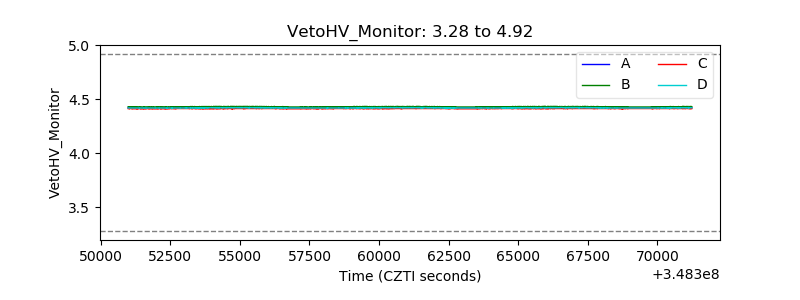 |
| Veto LLD | 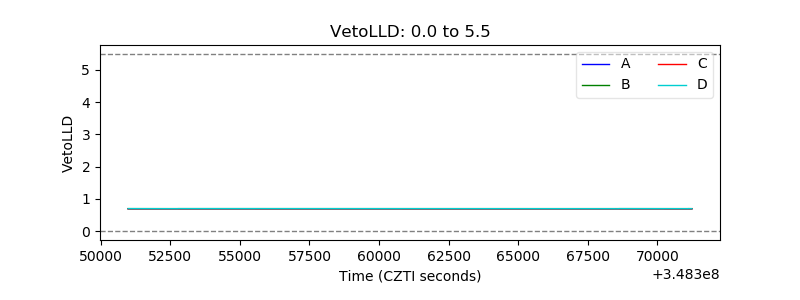 |
| Alpha Counter | 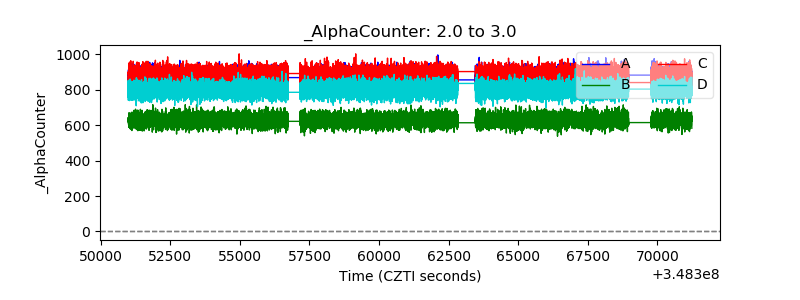 |
| _CPM_Rate | 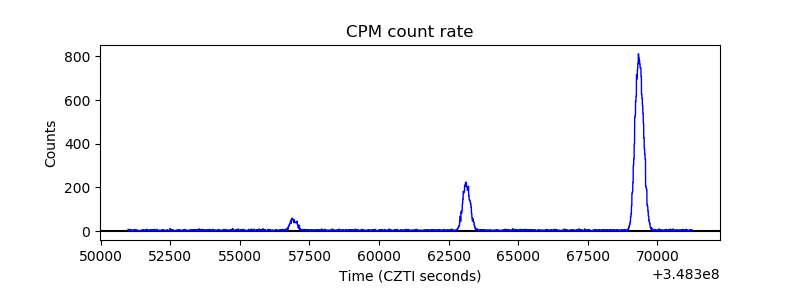 |
| CZT Counter | 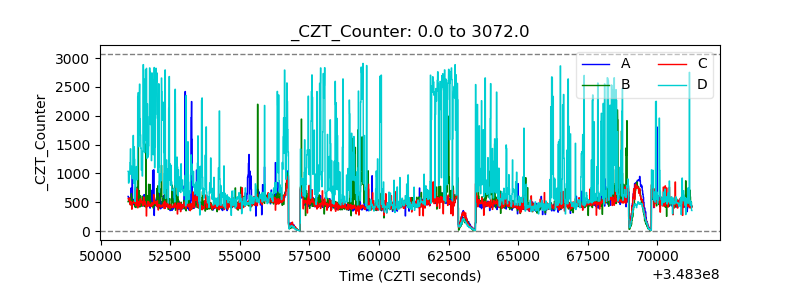 |
| +2.5 Volts monitor |  |
| +5 Volts monitor |  |
| _ROLL_ROT | 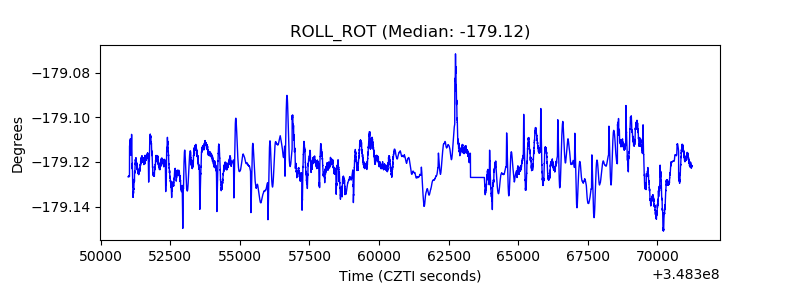 |
| _Roll_DEC | 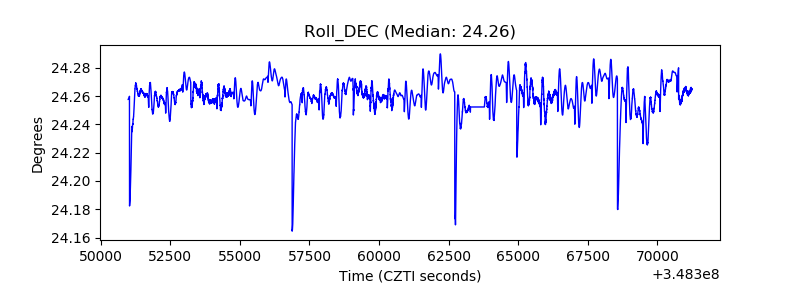 |
| _Roll_RA | 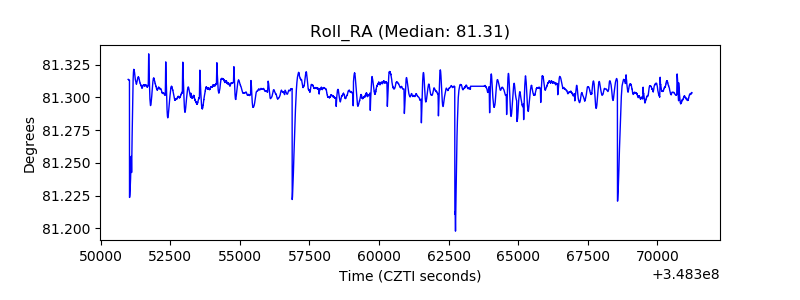 |
| Veto Counter | 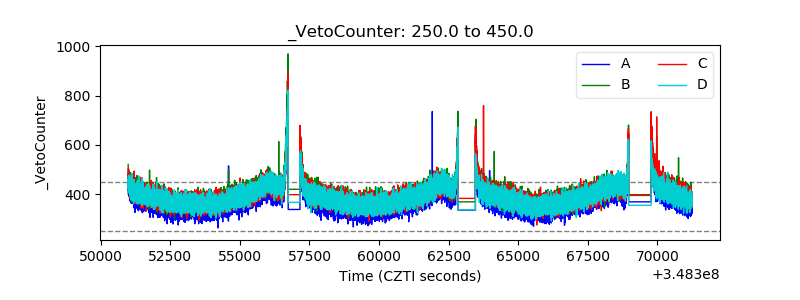 |