| Param | Original file | Final file |
|---|---|---|
| Filename | modeM0/AS1A10_073T08_9000004112_28655cztM0_level2.evt | modeM0/AS1A10_073T08_9000004112_28655cztM0_level2_quad_clean.evt |
| Size (bytes) | 571,184,640 | 94,584,960 |
| Size | 544.7 MB | 90.2 MB |
| Events in quadrant A | 3,648,265 | 608,847 |
| Events in quadrant B | 4,714,663 | 605,963 |
| Events in quadrant C | 3,744,371 | 582,261 |
| Events in quadrant D | 4,698,273 | 561,100 |
| Mode M0 | |||
|---|---|---|---|
| Quadrant | BADHDUFLAG | Total packets | Discarded packets |
| A | 0 | 15420 | 6 |
| B | 0 | 18751 | 2 |
| C | 0 | 15560 | 2 |
| D | 0 | 18828 | 2 |
| Mode SS | |||
|---|---|---|---|
| Quadrant | BADHDUFLAG | Total packets | Discarded packets |
| A | 0 | 148 | 0 |
| B | 0 | 148 | 0 |
| C | 0 | 148 | 0 |
| D | 0 | 148 | 0 |
| Mode M9 | |||
|---|---|---|---|
| Quadrant | BADHDUFLAG | Total packets | Discarded packets |
| A | 0 | 19 | 0 |
| B | 0 | 19 | 0 |
| C | 0 | 19 | 0 |
| D | 0 | 19 | 0 |
| Quadrant | Total seconds | Saturated seconds | Saturation percentage |
|---|---|---|---|
| A | 7271 | 38 | 0.522624% |
| B | 7272 | 211 | 2.901540% |
| C | 7272 | 275 | 3.781628% |
| D | 7272 | 262 | 3.602860% |
Noise dominated data is calculated using 1-second bins in cleaned event files. If a bin has >2000 counts, and if more than 50% of those come from <1% of pixels, then it is considered to be noise-dominated and hence unusable.
| Quadrant | # 1 sec bins | Bins with >0 counts | Bins with >2000 counts | High rate bins dominated by noise | Noise dominated (total time) | Noise dominated (detector-on time) | Marked lightcurve |
|---|---|---|---|---|---|---|---|
| A | 9051 | 7273 | 5 | 5 | 0.06% | 0.07% | 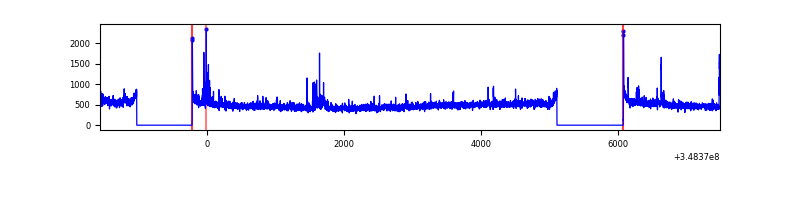 |
| B | 9052 | 7274 | 68 | 68 | 0.75% | 0.93% | 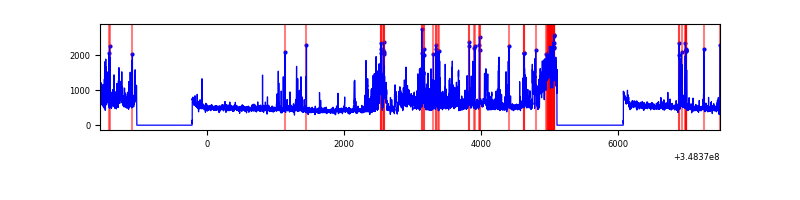 |
| C | 9052 | 7274 | 19 | 19 | 0.21% | 0.26% |  |
| D | 9052 | 7274 | 204 | 204 | 2.25% | 2.80% | 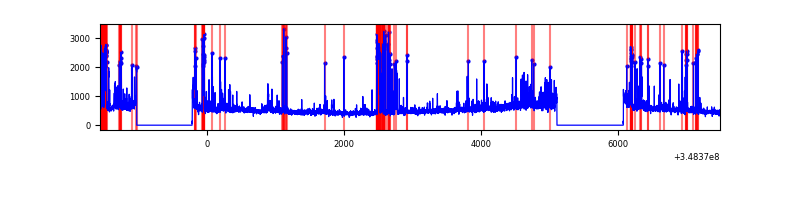 |
Top three noisy pixels from each quadrant. If the there are fewer than three noisy pixels in the level2.evt file, extra rows are filled as -1
| Pixel properties | Quadrant properties | ||||||
|---|---|---|---|---|---|---|---|
| Quadrant | DetID | PixID | Counts | Sigma | Mean | Median | Sigma |
| A | 15 | 174 | 97961 | 533.07 | 901 | 884 | 182.1 |
| A | 14 | 238 | 32613 | 174.23 | 901 | 884 | 182.1 |
| A | 12 | 16 | 25522 | 135.29 | 901 | 884 | 182.1 |
| B | 10 | 245 | 1187217 | 6937.22 | 888 | 865 | 171.0 |
| B | 12 | 111 | 20869 | 116.97 | 888 | 865 | 171.0 |
| B | 11 | 111 | 18965 | 105.84 | 888 | 865 | 171.0 |
| C | 14 | 238 | 206434 | 1025.72 | 854 | 861 | 200.4 |
| C | 14 | 254 | 107082 | 529.99 | 854 | 861 | 200.4 |
| C | 14 | 128 | 98390 | 486.63 | 854 | 861 | 200.4 |
| D | 1 | 52 | 1060385 | 5157.09 | 853 | 832 | 205.5 |
| D | 8 | 195 | 308331 | 1496.67 | 853 | 832 | 205.5 |
| D | 13 | 104 | 41291 | 196.92 | 853 | 832 | 205.5 |
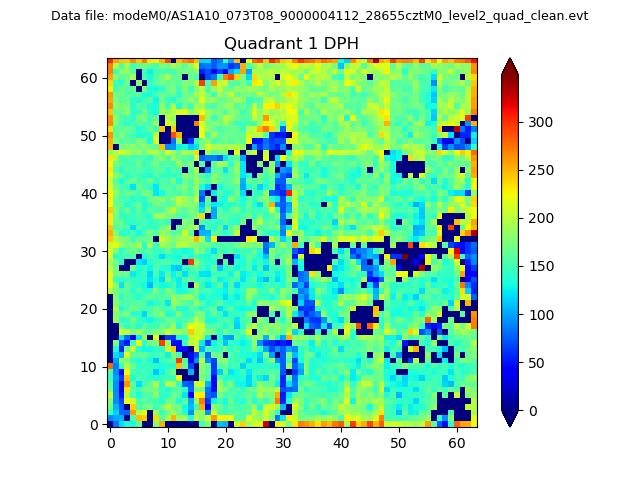
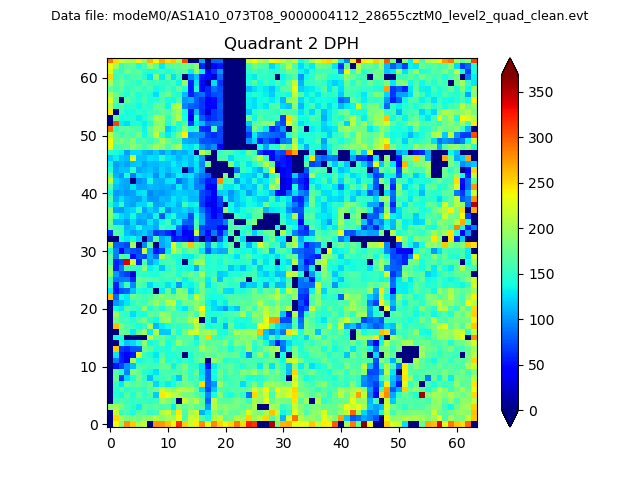
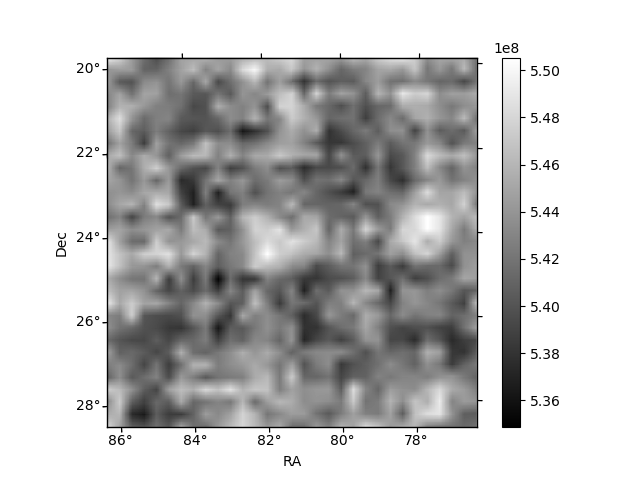
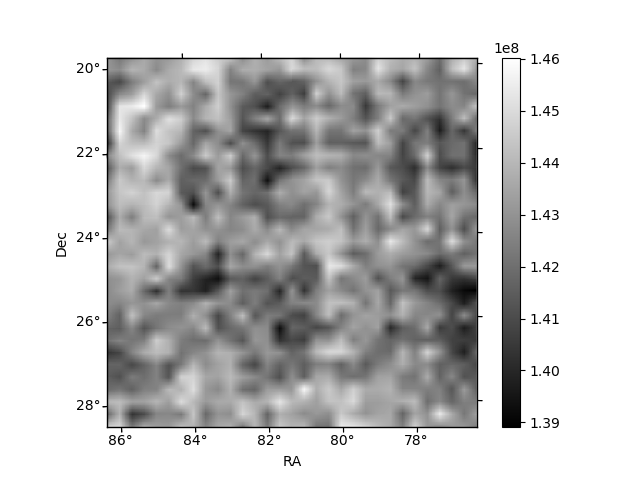
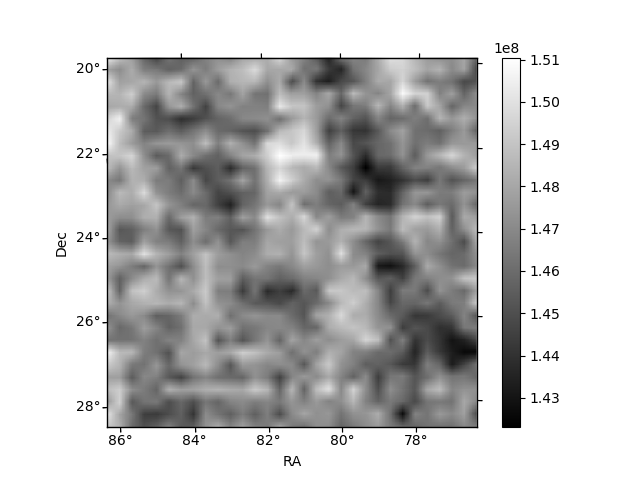
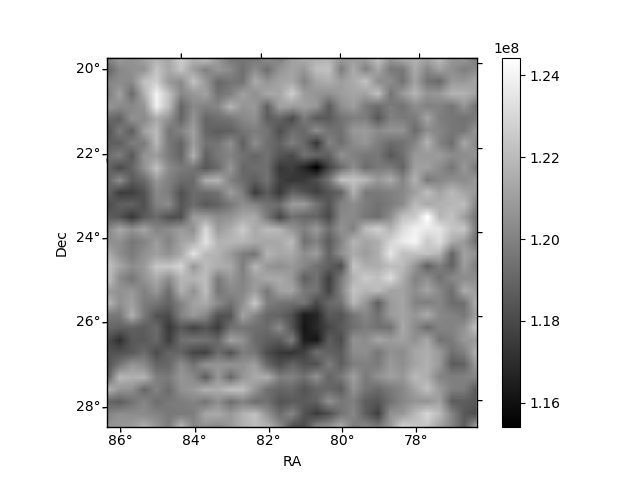
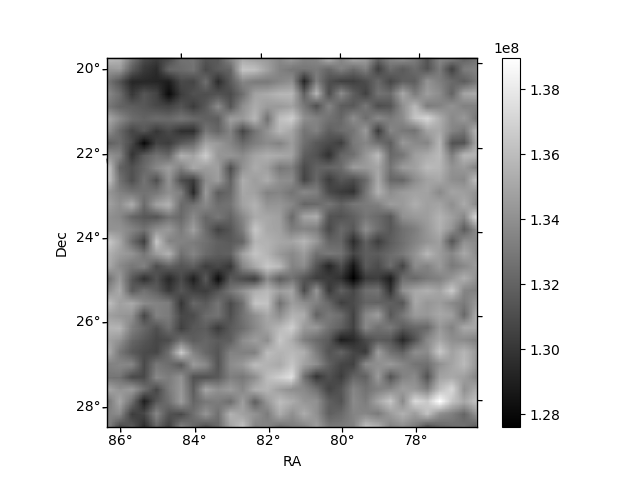
Histogram calculated using DETX and DETY for each event in the final _common_clean file
| Quadrant A | 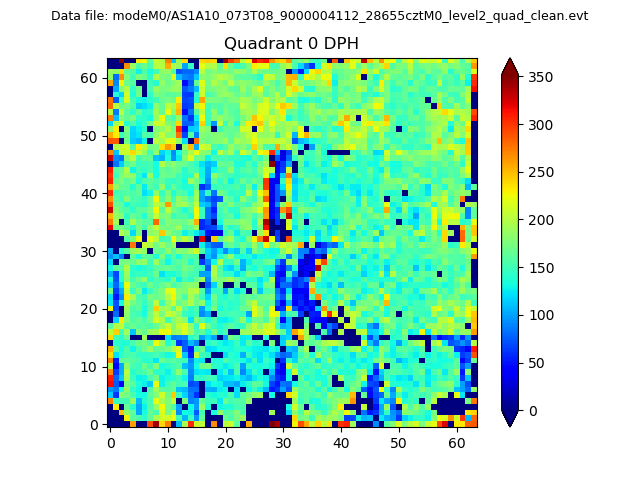 |
 |
Quadrant B |
|---|---|---|---|
| Quadrant D | 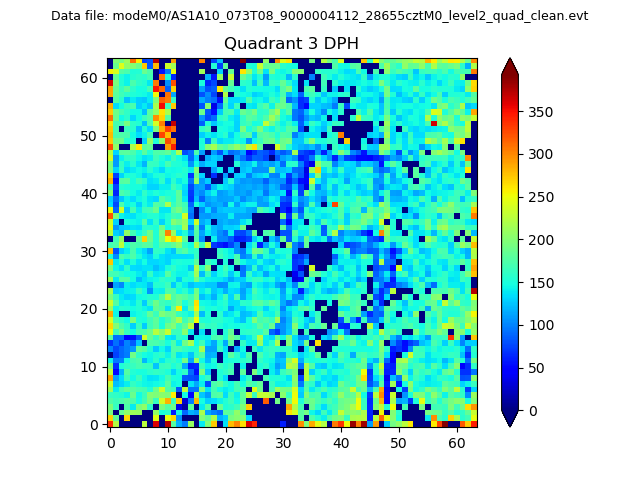 |
 |
Quadrant C |
| Plot type | Count rate plots | Images |
|---|---|---|
| Comparison with Poisson distribution Blue bars denote a histogram of data divided into 1 sec bins. Red curve is a Poisson curve with rate = median count rate of data. |
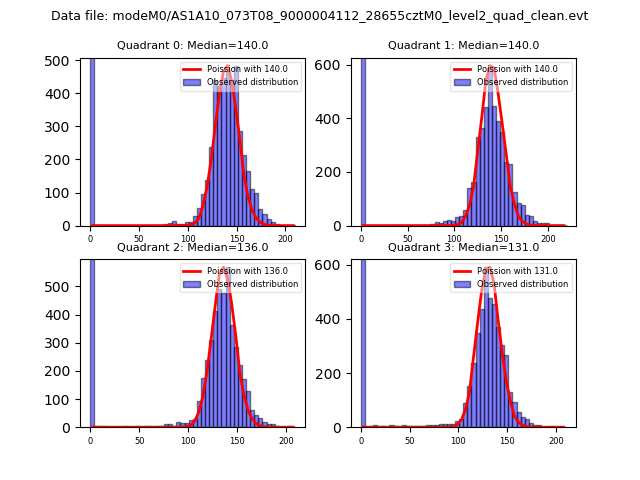 |
 |
| Quadrant-wise count rates Data is divided into 100 sec bins |
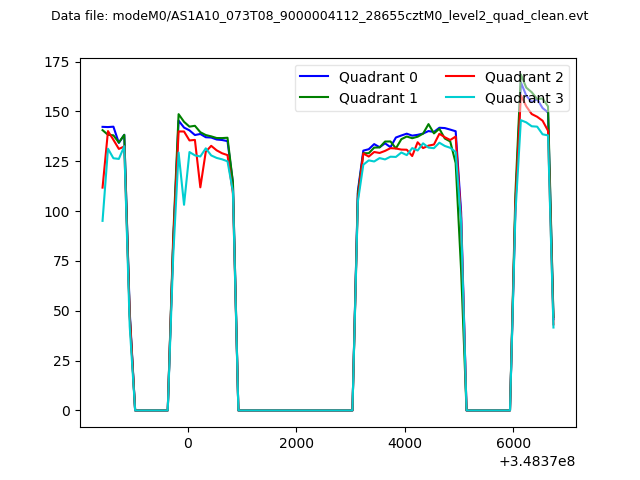 |
|
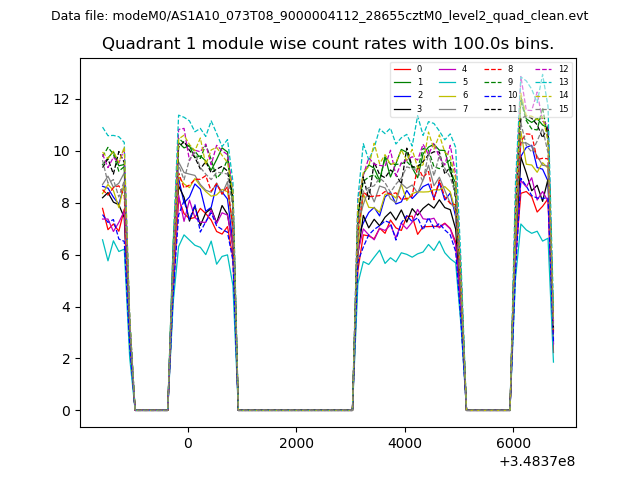
| Module-wise count rates for Quadrant A Data is divided into 100 sec bins |
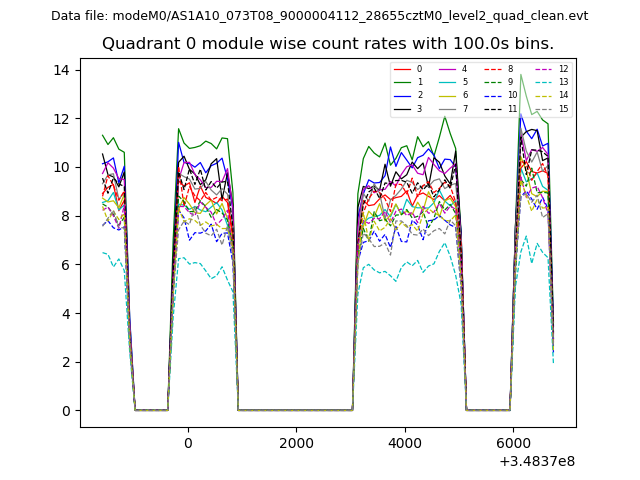 |
 |
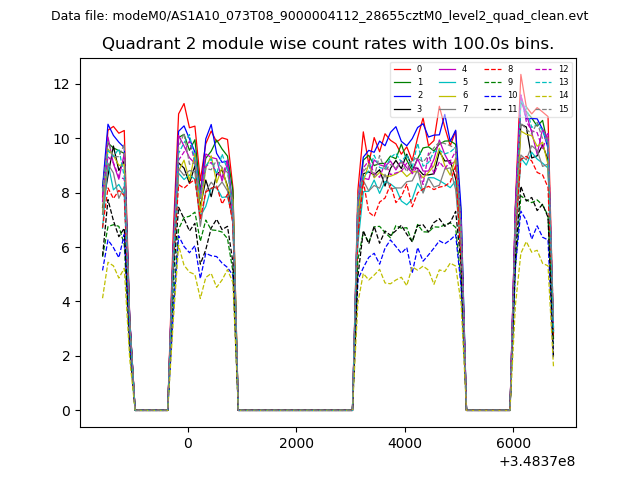
| Module-wise count rates for Quadrant B Data is divided into 100 sec bins |
 |
 |
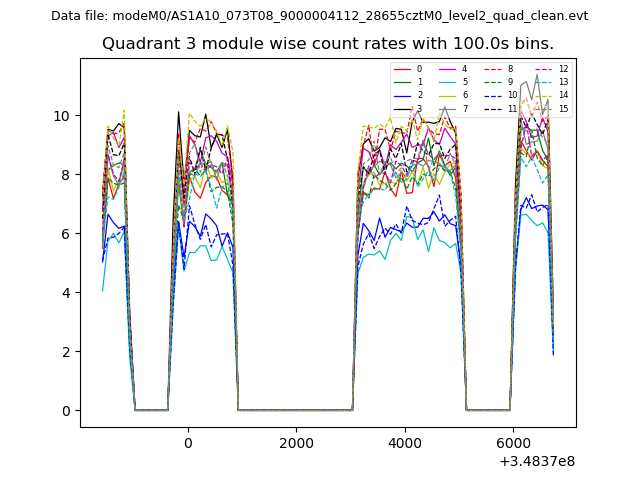
| Module-wise count rates for Quadrant C Data is divided into 100 sec bins |
 |
 |
| Module-wise count rates for Quadrant D Data is divided into 100 sec bins |
 |
 |
| Parameter | Plot |
|---|---|
| CZT HV Monitor |  |
| D_VDD | 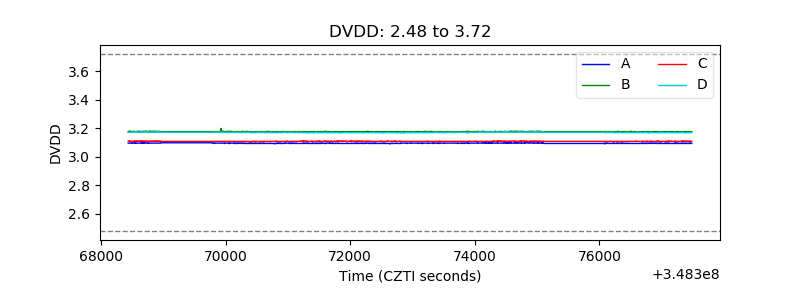 |
| Temperature 1 | 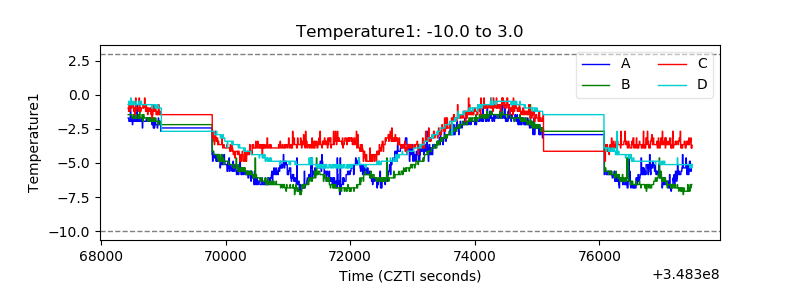 |
| Veto HV Monitor | 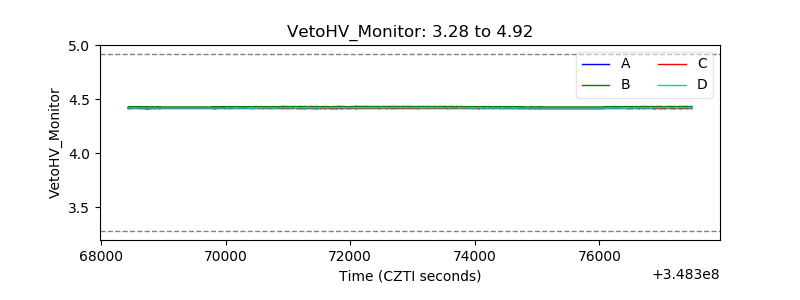 |
| Veto LLD | 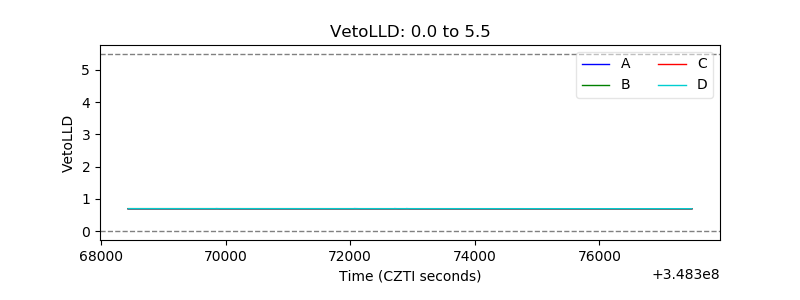 |
| Alpha Counter | 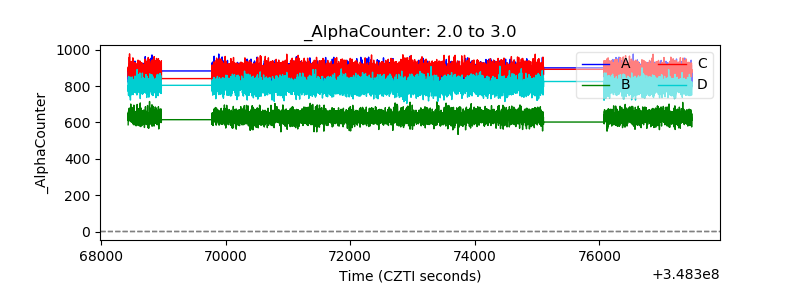 |
| _CPM_Rate | 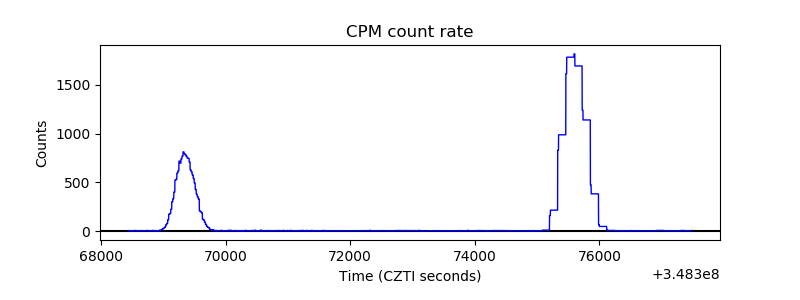 |
| CZT Counter | 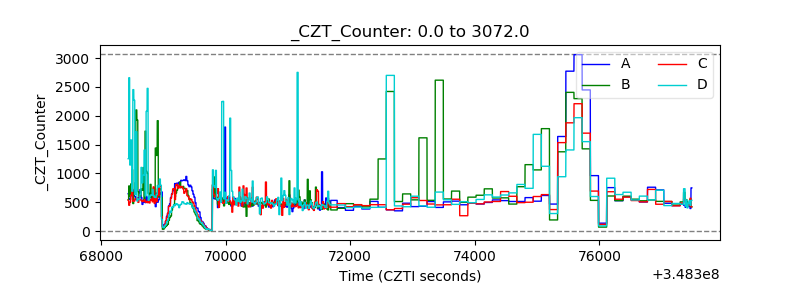 |
| +2.5 Volts monitor | 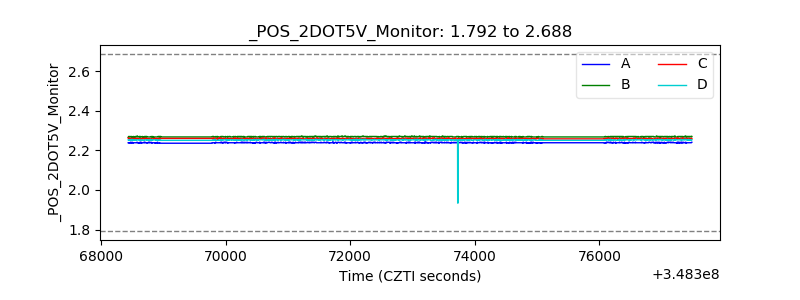 |
| +5 Volts monitor |  |
| _ROLL_ROT | 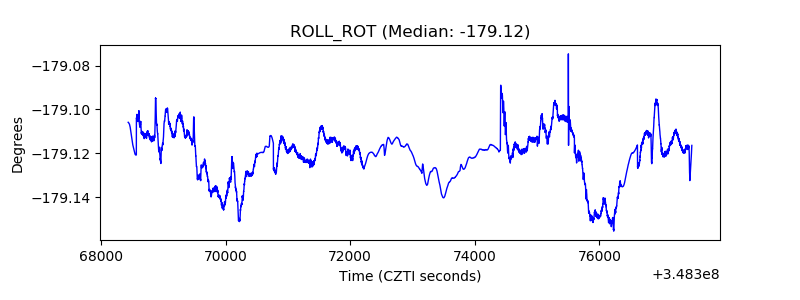 |
| _Roll_DEC | 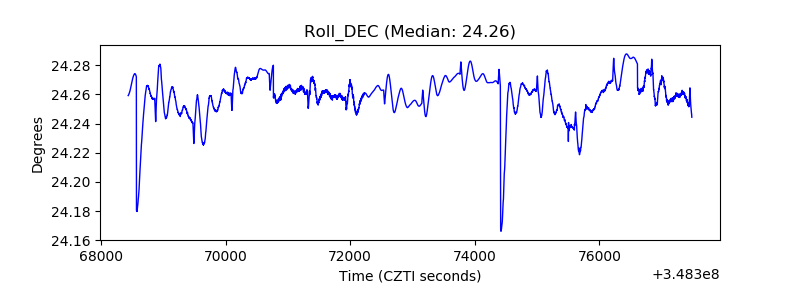 |
| _Roll_RA | 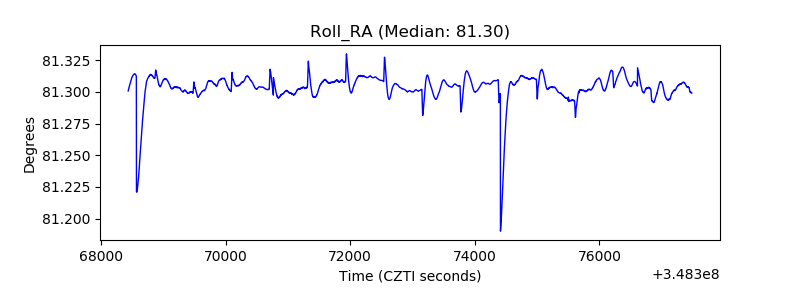 |
| Veto Counter | 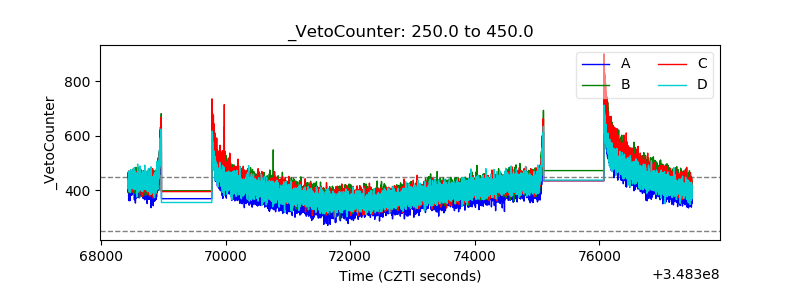 |