| Param | Original file | Final file |
|---|---|---|
| Filename | modeM0/AS1A10_073T08_9000004112_28659cztM0_level2.evt | modeM0/AS1A10_073T08_9000004112_28659cztM0_level2_quad_clean.evt |
| Size (bytes) | 523,618,560 | 69,756,480 |
| Size | 499.4 MB | 66.5 MB |
| Events in quadrant A | 3,598,131 | 435,314 |
| Events in quadrant B | 3,976,536 | 437,782 |
| Events in quadrant C | 3,662,235 | 410,923 |
| Events in quadrant D | 4,198,851 | 393,449 |
| Mode M0 | |||
|---|---|---|---|
| Quadrant | BADHDUFLAG | Total packets | Discarded packets |
| A | 0 | 14560 | 2 |
| B | 0 | 15638 | 2 |
| C | 0 | 14747 | 2 |
| D | 0 | 16559 | 2 |
| Mode SS | |||
|---|---|---|---|
| Quadrant | BADHDUFLAG | Total packets | Discarded packets |
| A | 0 | 126 | 0 |
| B | 0 | 126 | 0 |
| C | 0 | 126 | 0 |
| D | 0 | 126 | 0 |
| Mode M9 | |||
|---|---|---|---|
| Quadrant | BADHDUFLAG | Total packets | Discarded packets |
| A | 0 | 22 | 0 |
| B | 0 | 23 | 0 |
| C | 0 | 23 | 0 |
| D | 0 | 23 | 0 |
| Quadrant | Total seconds | Saturated seconds | Saturation percentage |
|---|---|---|---|
| A | 6229 | 52 | 0.834805% |
| B | 6229 | 222 | 3.563975% |
| C | 6229 | 227 | 3.644245% |
| D | 6228 | 154 | 2.472704% |
Noise dominated data is calculated using 1-second bins in cleaned event files. If a bin has >2000 counts, and if more than 50% of those come from <1% of pixels, then it is considered to be noise-dominated and hence unusable.
| Quadrant | # 1 sec bins | Bins with >0 counts | Bins with >2000 counts | High rate bins dominated by noise | Noise dominated (total time) | Noise dominated (detector-on time) | Marked lightcurve |
|---|---|---|---|---|---|---|---|
| A | 7539 | 6230 | 2 | 2 | 0.03% | 0.03% | 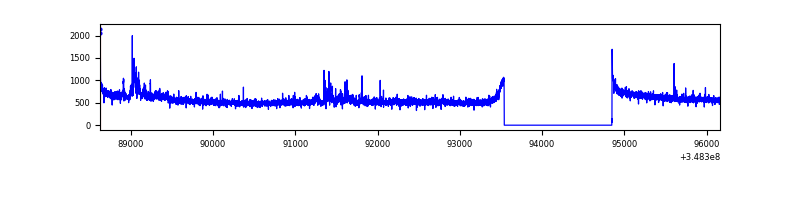 |
| B | 7539 | 6230 | 123 | 123 | 1.63% | 1.97% | 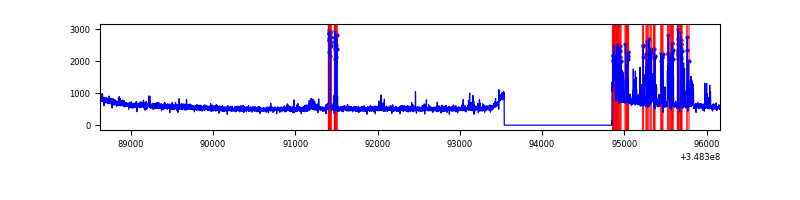 |
| C | 7539 | 6230 | 54 | 54 | 0.72% | 0.87% | 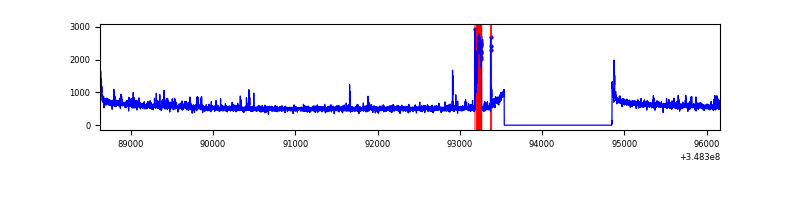 |
| D | 7538 | 6229 | 121 | 121 | 1.61% | 1.94% |  |
Top three noisy pixels from each quadrant. If the there are fewer than three noisy pixels in the level2.evt file, extra rows are filled as -1
| Pixel properties | Quadrant properties | ||||||
|---|---|---|---|---|---|---|---|
| Quadrant | DetID | PixID | Counts | Sigma | Mean | Median | Sigma |
| A | 15 | 174 | 120563 | 679.75 | 899 | 888 | 176.1 |
| A | 13 | 254 | 11826 | 62.13 | 899 | 888 | 176.1 |
| A | 8 | 192 | 9770 | 50.45 | 899 | 888 | 176.1 |
| B | 10 | 245 | 507084 | 3084.29 | 885 | 870 | 164.1 |
| B | 12 | 111 | 18989 | 110.4 | 885 | 870 | 164.1 |
| B | 11 | 111 | 17424 | 100.86 | 885 | 870 | 164.1 |
| C | 14 | 238 | 167907 | 867.78 | 837 | 848 | 192.5 |
| C | 2 | 16 | 164124 | 848.13 | 837 | 848 | 192.5 |
| C | 14 | 254 | 45097 | 229.85 | 837 | 848 | 192.5 |
| D | 1 | 52 | 581528 | 2923.44 | 839 | 817 | 198.6 |
| D | 8 | 195 | 199072 | 998.07 | 839 | 817 | 198.6 |
| D | 7 | 80 | 148677 | 744.36 | 839 | 817 | 198.6 |
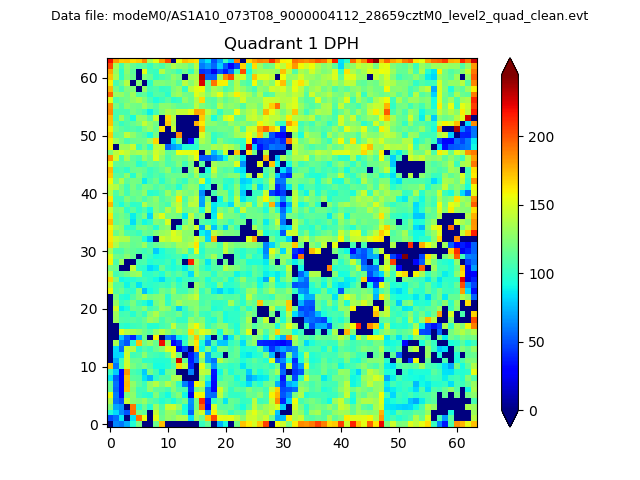
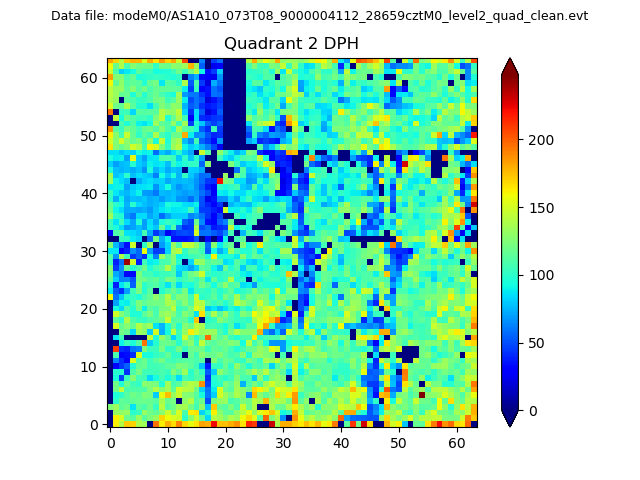
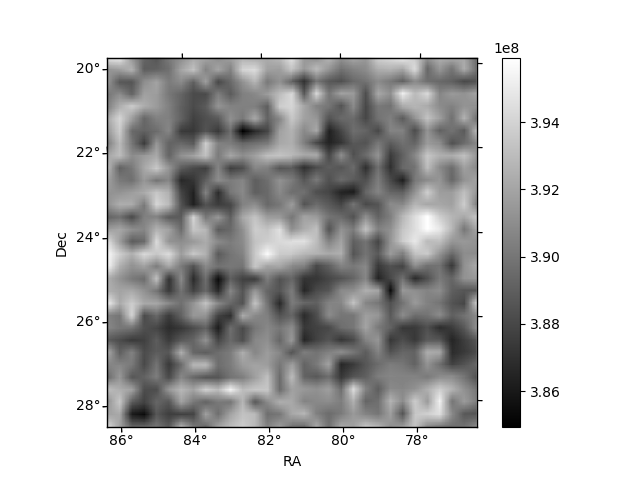
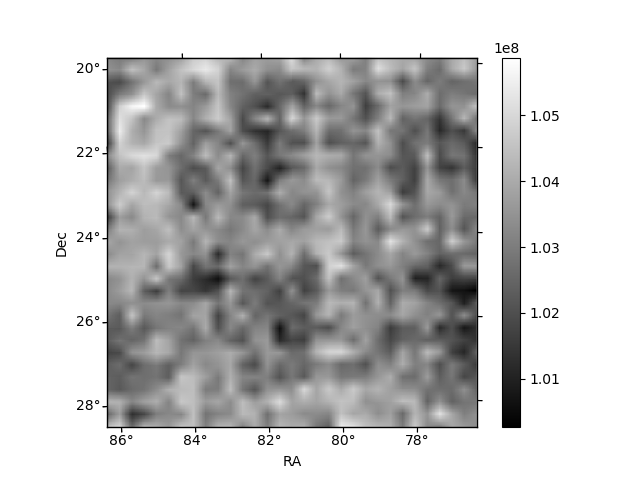
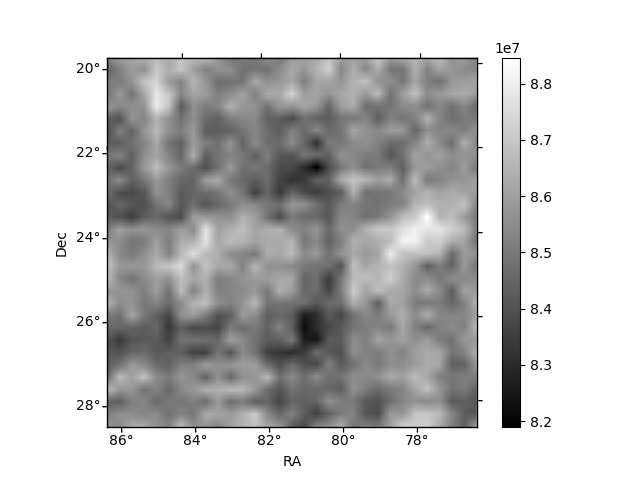
Histogram calculated using DETX and DETY for each event in the final _common_clean file
| Quadrant A | 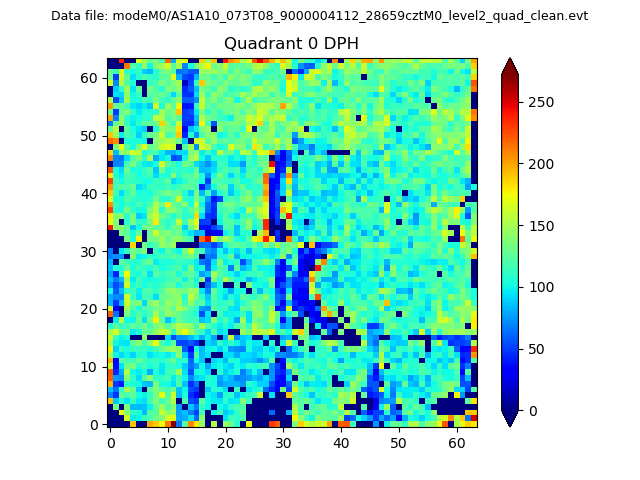 |
 |
Quadrant B |
|---|---|---|---|
| Quadrant D | 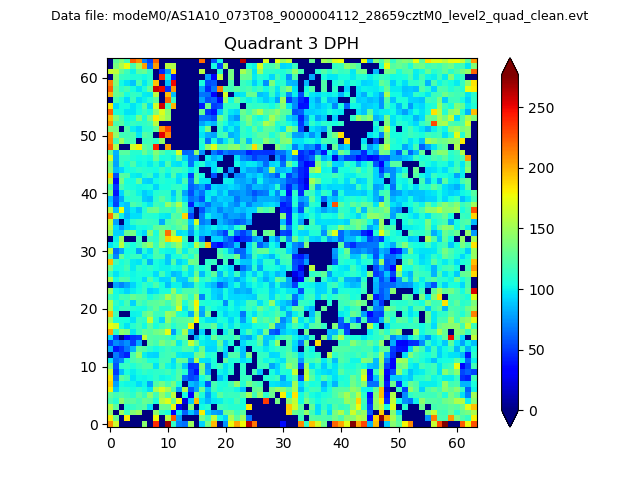 |
 |
Quadrant C |
| Plot type | Count rate plots | Images |
|---|---|---|
| Comparison with Poisson distribution Blue bars denote a histogram of data divided into 1 sec bins. Red curve is a Poisson curve with rate = median count rate of data. |
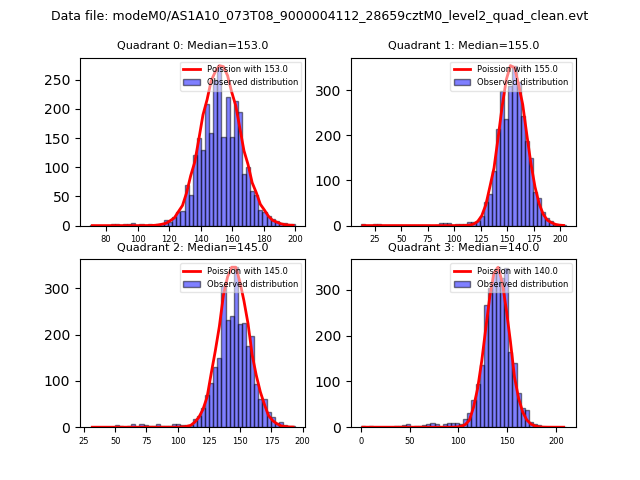 |
 |
| Quadrant-wise count rates Data is divided into 100 sec bins |
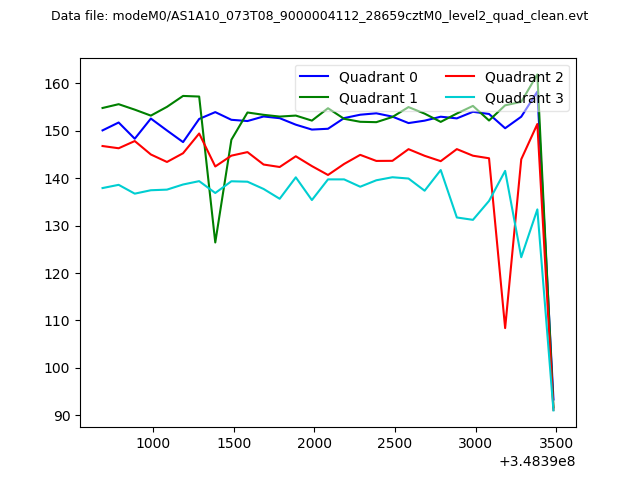 |
|
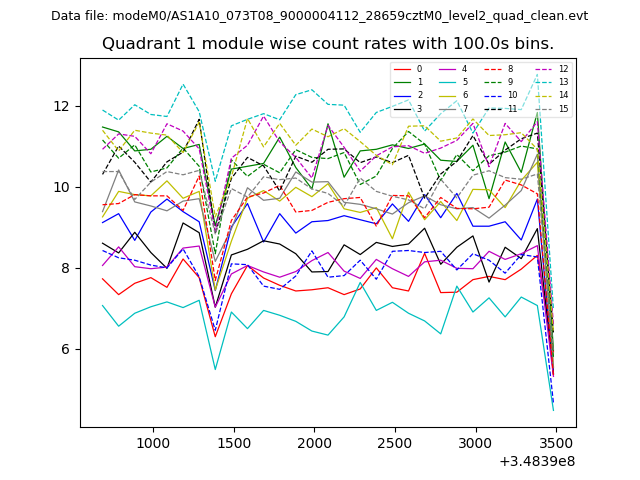
| Module-wise count rates for Quadrant A Data is divided into 100 sec bins |
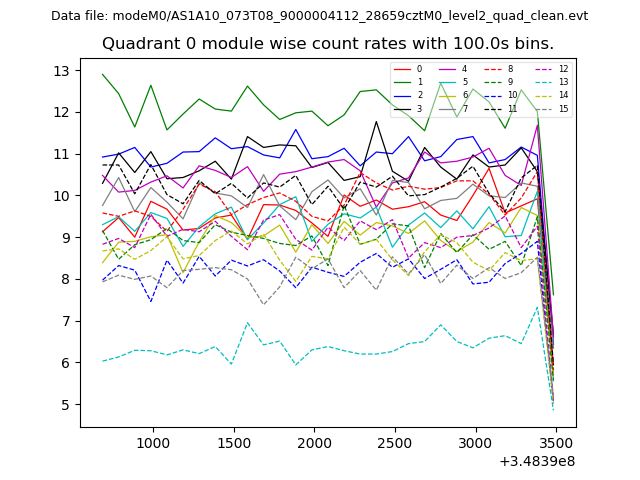 |
 |
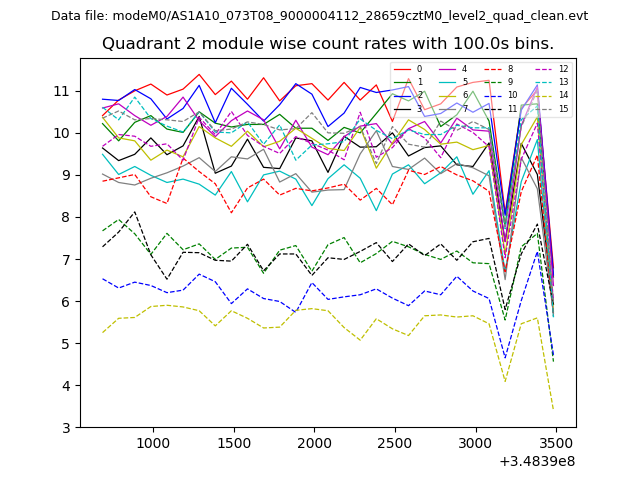
| Module-wise count rates for Quadrant B Data is divided into 100 sec bins |
 |
 |
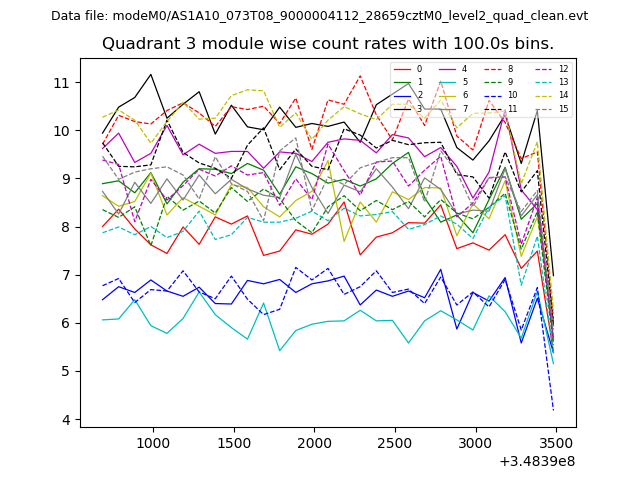
| Module-wise count rates for Quadrant C Data is divided into 100 sec bins |
 |
 |
| Module-wise count rates for Quadrant D Data is divided into 100 sec bins |
 |
 |
| Parameter | Plot |
|---|---|
| CZT HV Monitor | 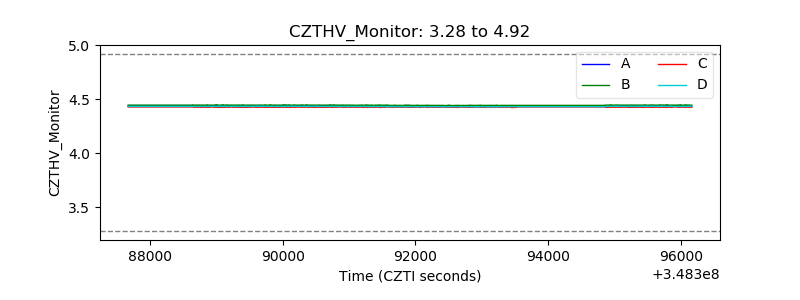 |
| D_VDD |  |
| Temperature 1 | 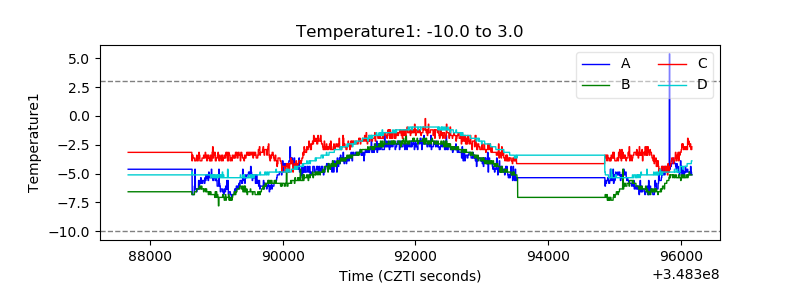 |
| Veto HV Monitor | 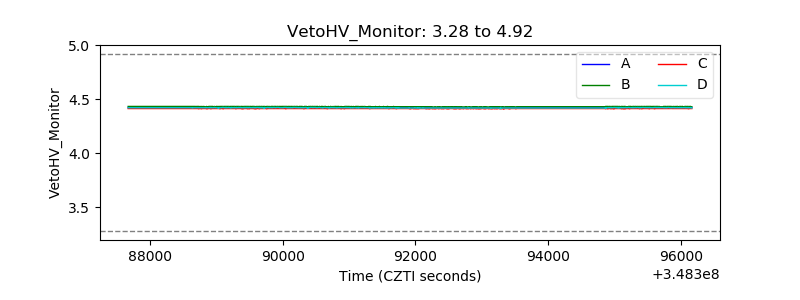 |
| Veto LLD | 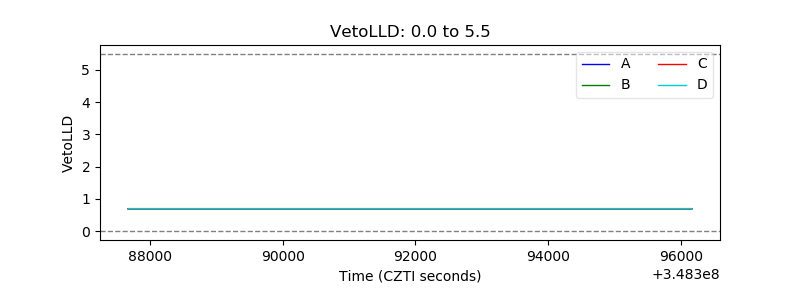 |
| Alpha Counter | 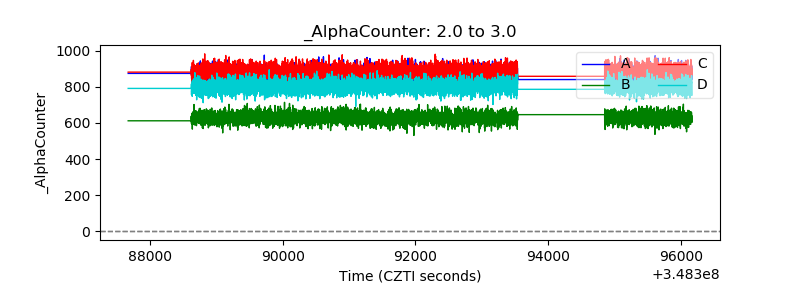 |
| _CPM_Rate | 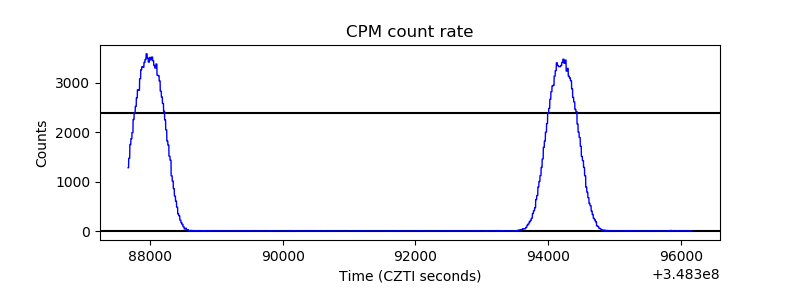 |
| CZT Counter | 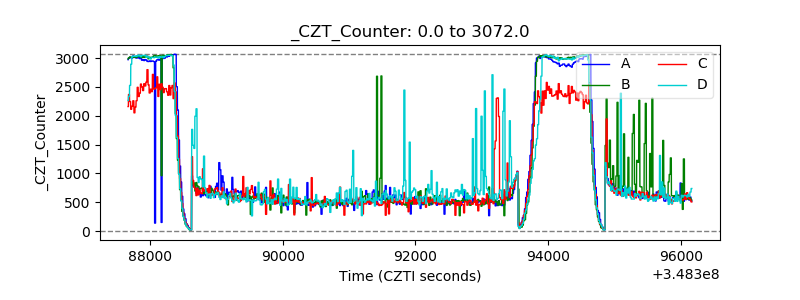 |
| +2.5 Volts monitor |  |
| +5 Volts monitor |  |
| _ROLL_ROT | 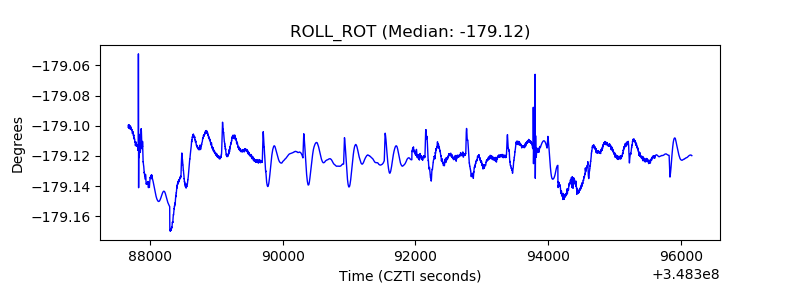 |
| _Roll_DEC | 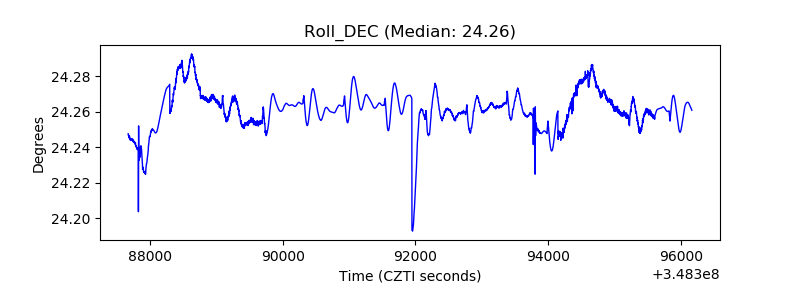 |
| _Roll_RA | 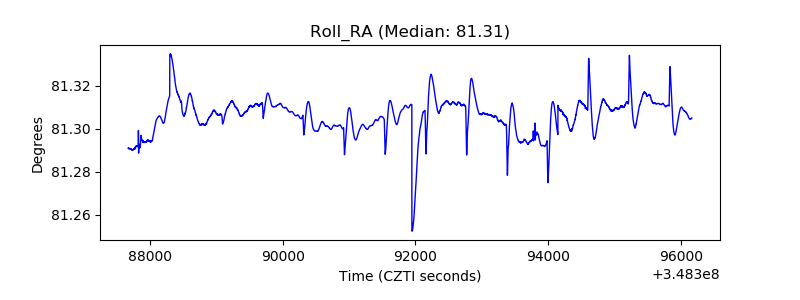 |
| Veto Counter | 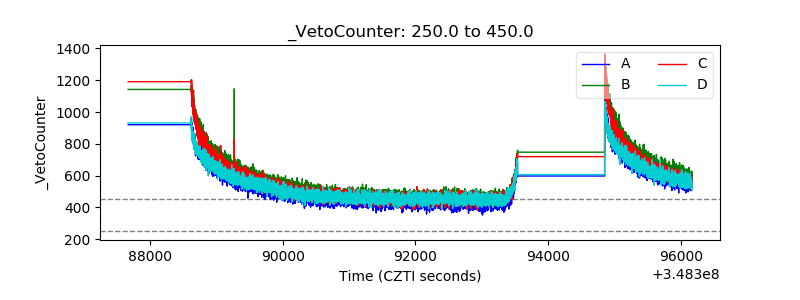 |