| Param | Original file | Final file |
|---|---|---|
| Filename | modeM0/AS1A10_073T08_9000004112_28661cztM0_level2.evt | modeM0/AS1A10_073T08_9000004112_28661cztM0_level2_quad_clean.evt |
| Size (bytes) | 556,588,800 | 97,807,680 |
| Size | 530.8 MB | 93.3 MB |
| Events in quadrant A | 3,731,718 | 655,748 |
| Events in quadrant B | 4,833,096 | 659,725 |
| Events in quadrant C | 3,533,700 | 612,371 |
| Events in quadrant D | 4,332,652 | 596,349 |
| Mode M0 | |||
|---|---|---|---|
| Quadrant | BADHDUFLAG | Total packets | Discarded packets |
| A | 0 | 15046 | 2 |
| B | 0 | 18225 | 2 |
| C | 0 | 14252 | 2 |
| D | 0 | 17261 | 2 |
| Mode SS | |||
|---|---|---|---|
| Quadrant | BADHDUFLAG | Total packets | Discarded packets |
| A | 0 | 126 | 0 |
| B | 0 | 126 | 0 |
| C | 0 | 126 | 0 |
| D | 0 | 126 | 0 |
| Mode M9 | |||
|---|---|---|---|
| Quadrant | BADHDUFLAG | Total packets | Discarded packets |
| A | 0 | 13 | 0 |
| B | 0 | 13 | 0 |
| C | 0 | 13 | 0 |
| D | 0 | 13 | 0 |
| Quadrant | Total seconds | Saturated seconds | Saturation percentage |
|---|---|---|---|
| A | 6280 | 138 | 2.197452% |
| B | 6280 | 634 | 10.095541% |
| C | 6280 | 219 | 3.487261% |
| D | 6280 | 137 | 2.181529% |
Noise dominated data is calculated using 1-second bins in cleaned event files. If a bin has >2000 counts, and if more than 50% of those come from <1% of pixels, then it is considered to be noise-dominated and hence unusable.
| Quadrant | # 1 sec bins | Bins with >0 counts | Bins with >2000 counts | High rate bins dominated by noise | Noise dominated (total time) | Noise dominated (detector-on time) | Marked lightcurve |
|---|---|---|---|---|---|---|---|
| A | 7570 | 6281 | 13 | 13 | 0.17% | 0.21% | 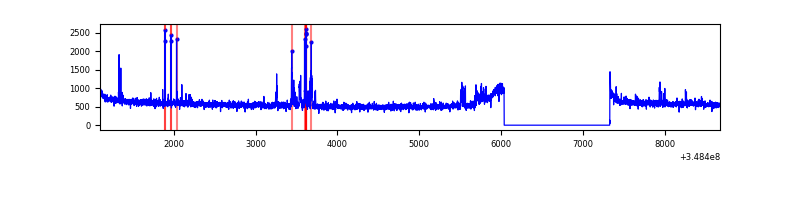 |
| B | 7570 | 6281 | 316 | 316 | 4.17% | 5.03% | 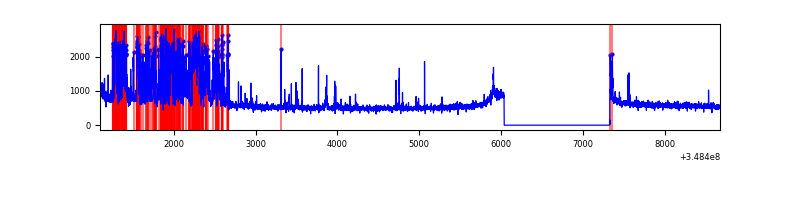 |
| C | 7570 | 6281 | 0 | 0 | 0.00% | 0.00% | 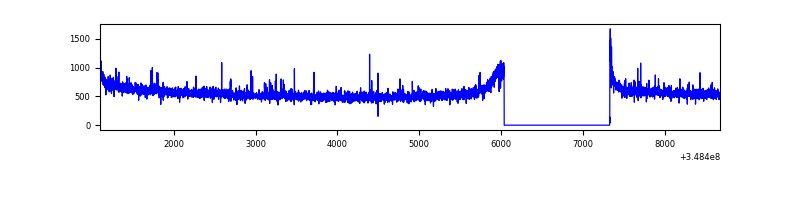 |
| D | 7570 | 6281 | 49 | 49 | 0.65% | 0.78% | 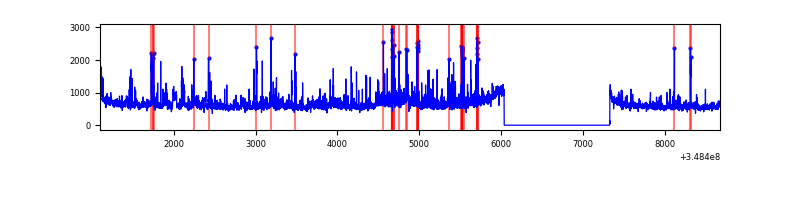 |
Top three noisy pixels from each quadrant. If the there are fewer than three noisy pixels in the level2.evt file, extra rows are filled as -1
| Pixel properties | Quadrant properties | ||||||
|---|---|---|---|---|---|---|---|
| Quadrant | DetID | PixID | Counts | Sigma | Mean | Median | Sigma |
| A | 15 | 174 | 150212 | 828.96 | 920 | 908 | 180.1 |
| A | 12 | 96 | 29473 | 158.6 | 920 | 908 | 180.1 |
| A | 13 | 254 | 11819 | 60.58 | 920 | 908 | 180.1 |
| B | 10 | 245 | 1351440 | 8139.66 | 885 | 869 | 165.9 |
| B | 12 | 111 | 19309 | 111.13 | 885 | 869 | 165.9 |
| B | 11 | 111 | 17501 | 100.24 | 885 | 869 | 165.9 |
| C | 14 | 238 | 165370 | 834.18 | 848 | 855 | 197.2 |
| C | 14 | 254 | 38780 | 192.3 | 848 | 855 | 197.2 |
| C | 0 | 10 | 21218 | 103.25 | 848 | 855 | 197.2 |
| D | 1 | 52 | 773999 | 3795.39 | 865 | 846 | 203.7 |
| D | 8 | 195 | 219008 | 1070.95 | 865 | 846 | 203.7 |
| D | 2 | 250 | 35002 | 167.67 | 865 | 846 | 203.7 |
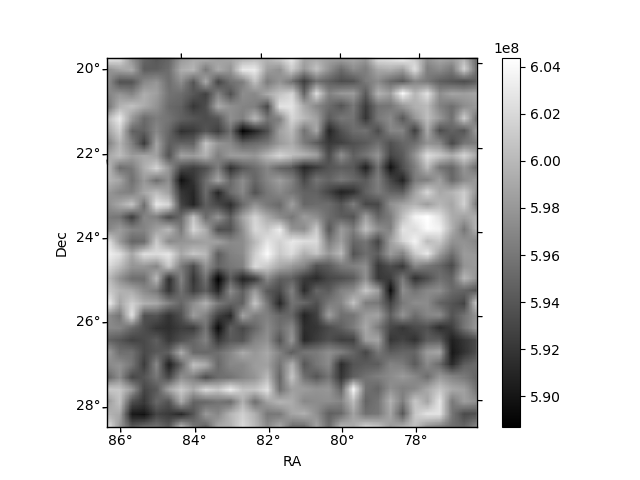
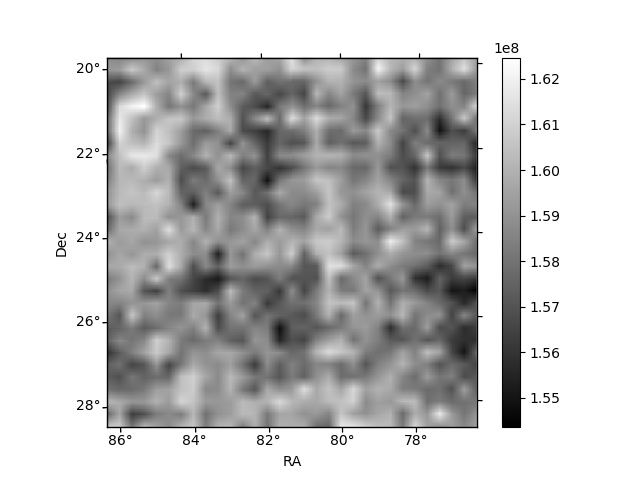
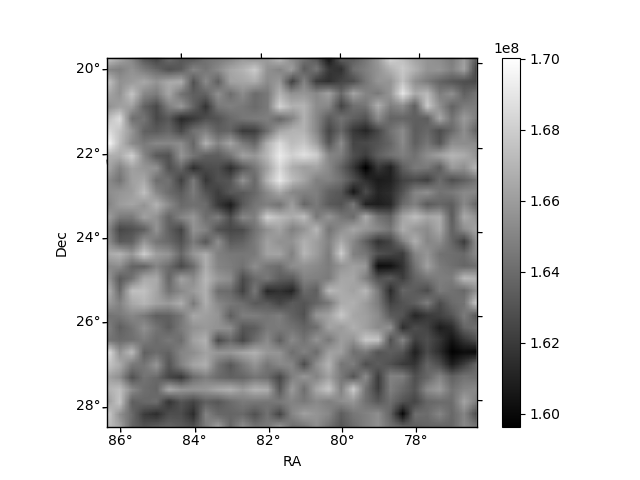
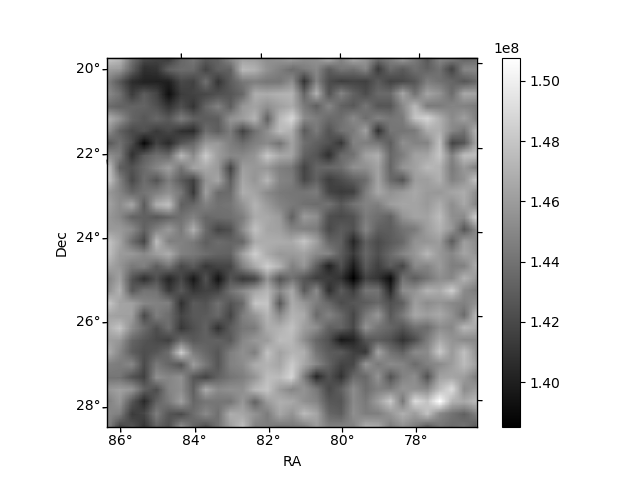
Histogram calculated using DETX and DETY for each event in the final _common_clean file
| Quadrant A | 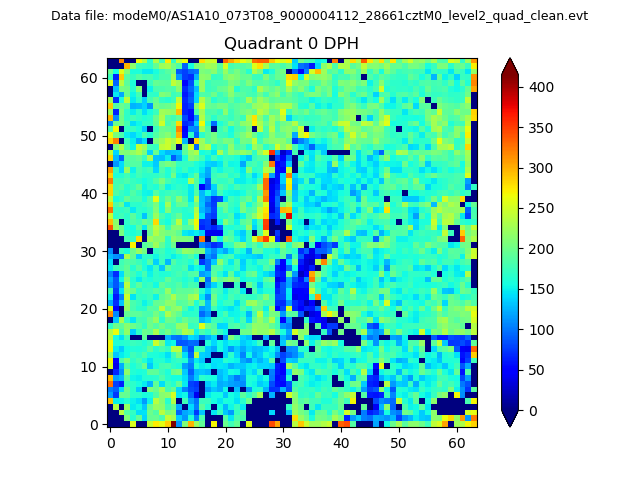 |
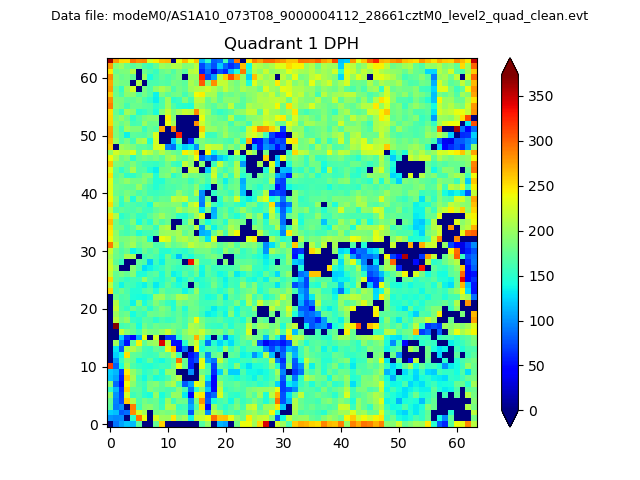 |
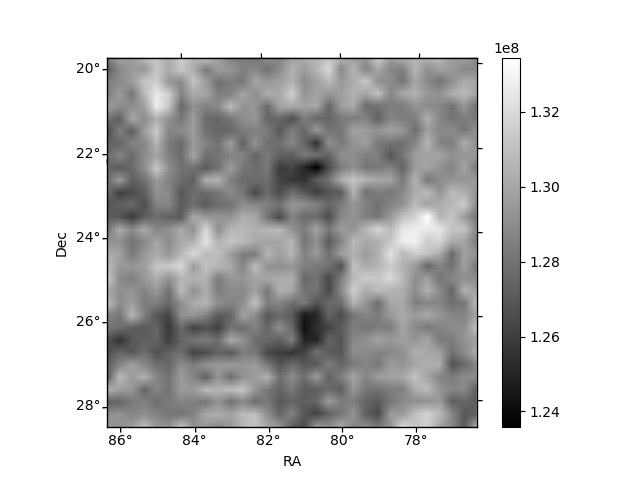
Quadrant B |
|---|---|---|---|
| Quadrant D | 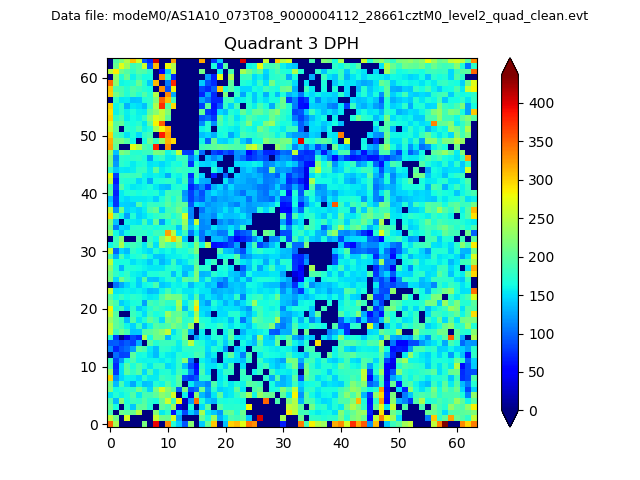 |
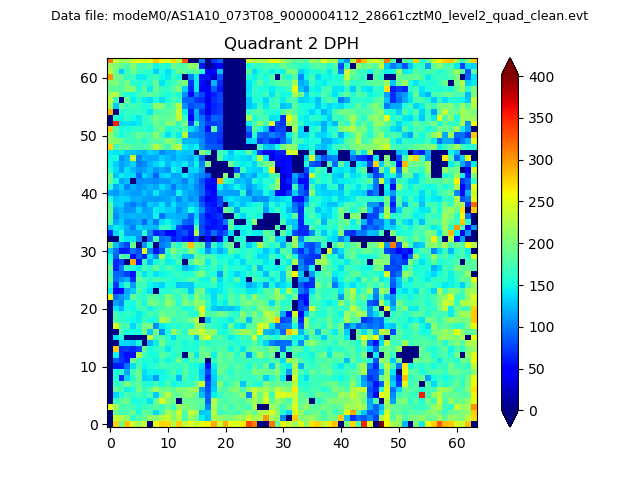 |
Quadrant C |
| Plot type | Count rate plots | Images |
|---|---|---|
| Comparison with Poisson distribution Blue bars denote a histogram of data divided into 1 sec bins. Red curve is a Poisson curve with rate = median count rate of data. |
 |
 |
| Quadrant-wise count rates Data is divided into 100 sec bins |
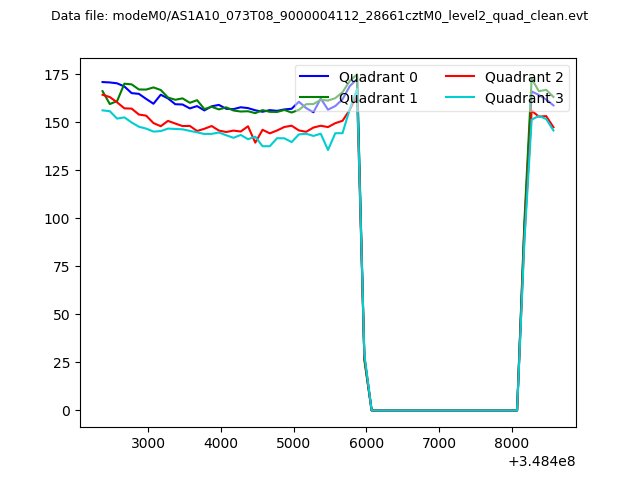 |
|
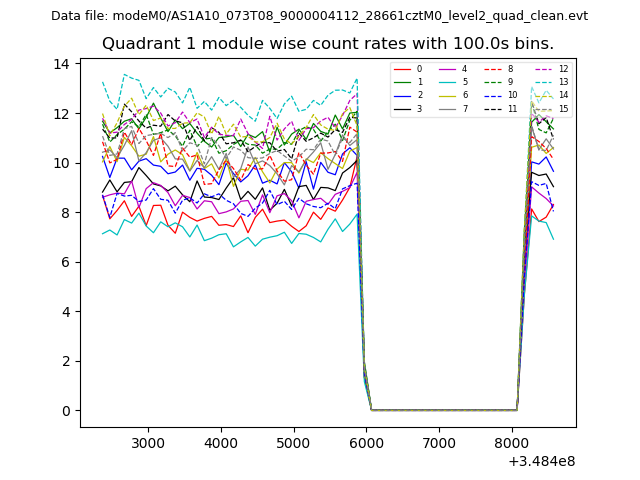
| Module-wise count rates for Quadrant A Data is divided into 100 sec bins |
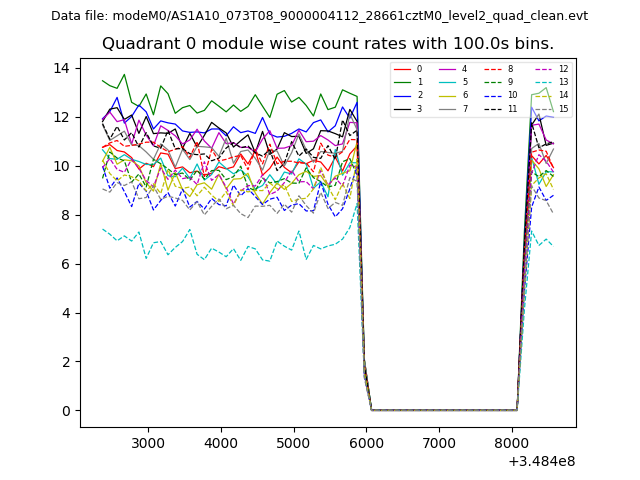 |
 |
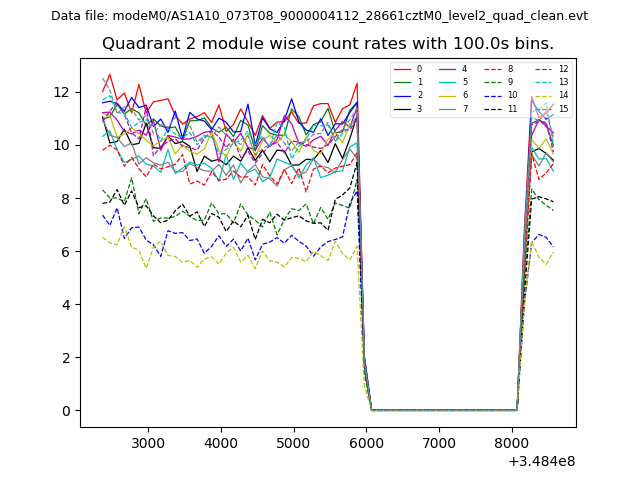
| Module-wise count rates for Quadrant B Data is divided into 100 sec bins |
 |
 |
| Module-wise count rates for Quadrant C Data is divided into 100 sec bins |
 |
 |
| Module-wise count rates for Quadrant D Data is divided into 100 sec bins |
 |
 |
| Parameter | Plot |
|---|---|
| CZT HV Monitor | 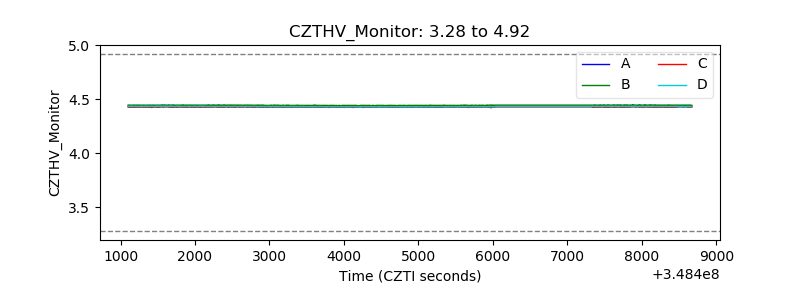 |
| D_VDD | 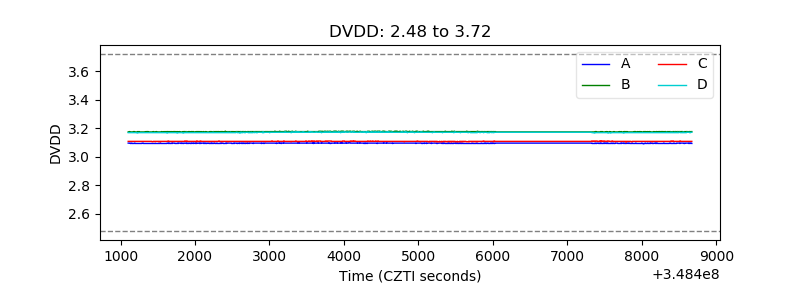 |
| Temperature 1 | 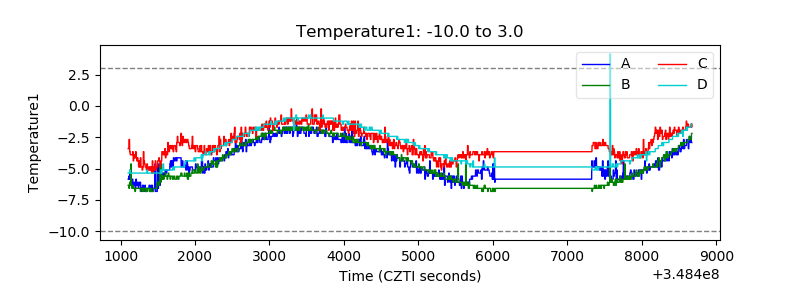 |
| Veto HV Monitor |  |
| Veto LLD | 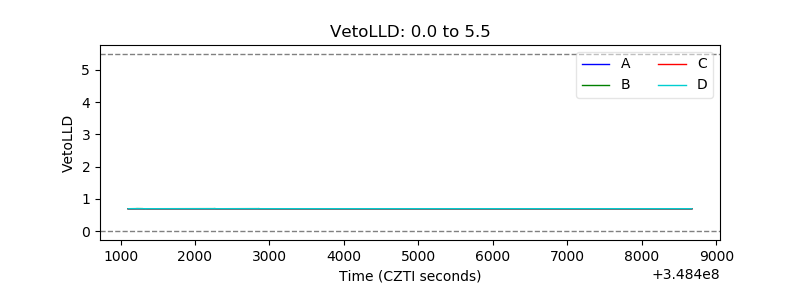 |
| Alpha Counter | 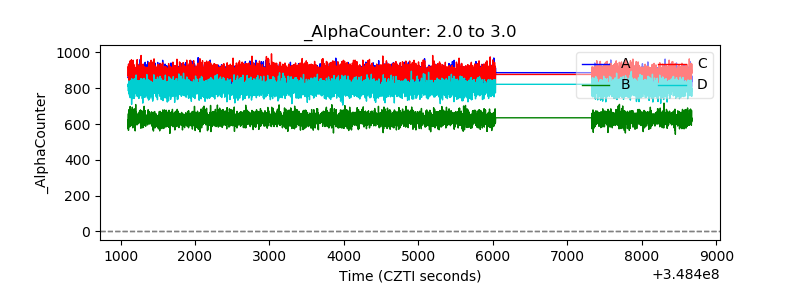 |
| _CPM_Rate | 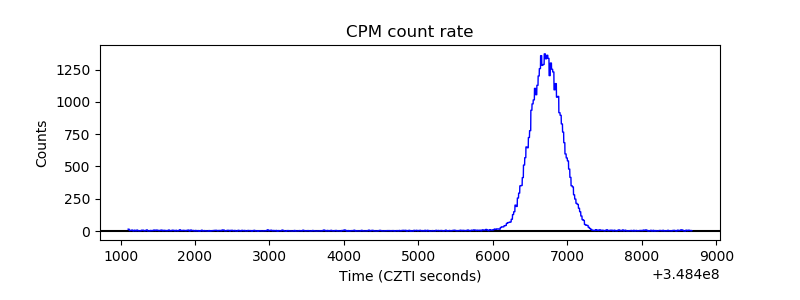 |
| CZT Counter | 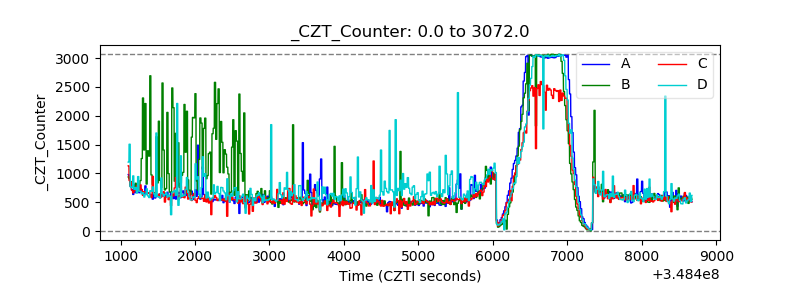 |
| +2.5 Volts monitor |  |
| +5 Volts monitor |  |
| _ROLL_ROT |  |
| _Roll_DEC |  |
| _Roll_RA | 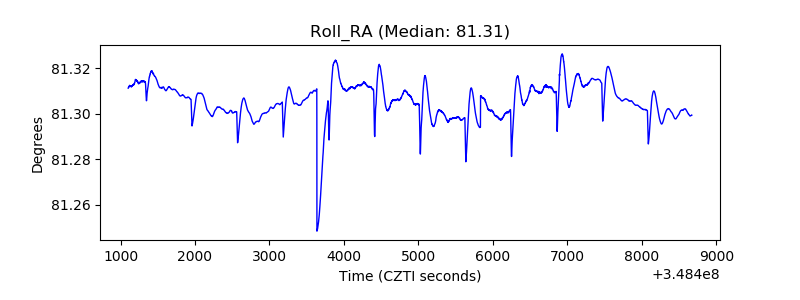 |
| Veto Counter | 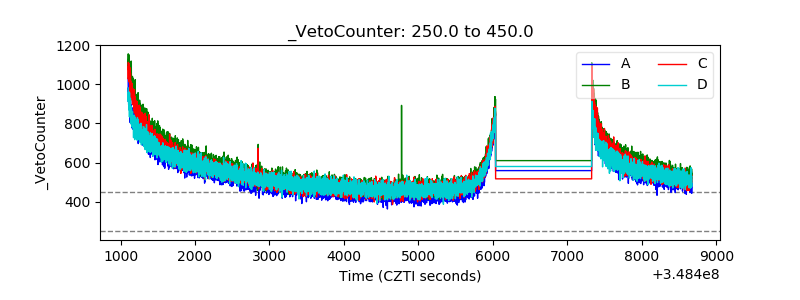 |