| Param | Original file | Final file |
|---|---|---|
| Filename | modeM0/AS1A10_073T08_9000004112_28662cztM0_level2.evt | modeM0/AS1A10_073T08_9000004112_28662cztM0_level2_quad_clean.evt |
| Size (bytes) | 520,724,160 | 101,612,160 |
| Size | 496.6 MB | 96.9 MB |
| Events in quadrant A | 3,436,305 | 688,641 |
| Events in quadrant B | 3,831,738 | 686,316 |
| Events in quadrant C | 3,385,905 | 641,000 |
| Events in quadrant D | 4,689,130 | 621,990 |
| Mode M0 | |||
|---|---|---|---|
| Quadrant | BADHDUFLAG | Total packets | Discarded packets |
| A | 0 | 13909 | 1 |
| B | 0 | 15321 | 1 |
| C | 0 | 13725 | 1 |
| D | 0 | 18020 | 1 |
| Mode SS | |||
|---|---|---|---|
| Quadrant | BADHDUFLAG | Total packets | Discarded packets |
| A | 0 | 128 | 0 |
| B | 0 | 128 | 0 |
| C | 0 | 128 | 0 |
| D | 0 | 128 | 0 |
| Mode M9 | |||
|---|---|---|---|
| Quadrant | BADHDUFLAG | Total packets | Discarded packets |
| A | 0 | 10 | 0 |
| B | 0 | 10 | 0 |
| C | 0 | 10 | 0 |
| D | 0 | 10 | 0 |
| Quadrant | Total seconds | Saturated seconds | Saturation percentage |
|---|---|---|---|
| A | 6296 | 198 | 3.144854% |
| B | 6296 | 267 | 4.240788% |
| C | 6296 | 279 | 4.431385% |
| D | 6296 | 395 | 6.273825% |
Noise dominated data is calculated using 1-second bins in cleaned event files. If a bin has >2000 counts, and if more than 50% of those come from <1% of pixels, then it is considered to be noise-dominated and hence unusable.
| Quadrant | # 1 sec bins | Bins with >0 counts | Bins with >2000 counts | High rate bins dominated by noise | Noise dominated (total time) | Noise dominated (detector-on time) | Marked lightcurve |
|---|---|---|---|---|---|---|---|
| A | 7346 | 6297 | 2 | 2 | 0.03% | 0.03% | 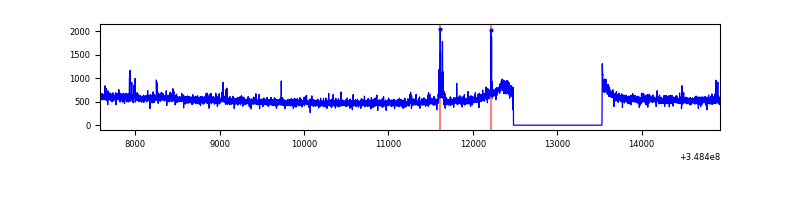 |
| B | 7346 | 6297 | 28 | 28 | 0.38% | 0.44% |  |
| C | 7346 | 6297 | 0 | 0 | 0.00% | 0.00% |  |
| D | 7346 | 6297 | 253 | 253 | 3.44% | 4.02% | 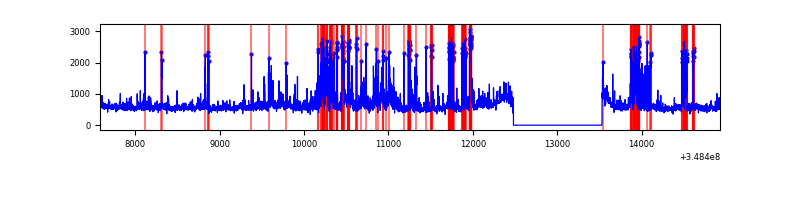 |
Top three noisy pixels from each quadrant. If the there are fewer than three noisy pixels in the level2.evt file, extra rows are filled as -1
| Pixel properties | Quadrant properties | ||||||
|---|---|---|---|---|---|---|---|
| Quadrant | DetID | PixID | Counts | Sigma | Mean | Median | Sigma |
| A | 15 | 174 | 85217 | 483.45 | 868 | 853 | 174.5 |
| A | 13 | 254 | 11914 | 63.39 | 868 | 853 | 174.5 |
| A | 3 | 137 | 7897 | 40.37 | 868 | 853 | 174.5 |
| B | 10 | 245 | 462691 | 2847.1 | 850 | 832 | 162.2 |
| B | 12 | 111 | 19346 | 114.13 | 850 | 832 | 162.2 |
| B | 11 | 111 | 17587 | 103.29 | 850 | 832 | 162.2 |
| C | 14 | 238 | 160986 | 858.17 | 806 | 815 | 186.6 |
| C | 14 | 254 | 44360 | 233.31 | 806 | 815 | 186.6 |
| C | 2 | 16 | 22807 | 117.83 | 806 | 815 | 186.6 |
| D | 1 | 52 | 1176397 | 6076.77 | 817 | 797 | 193.5 |
| D | 8 | 195 | 198847 | 1023.73 | 817 | 797 | 193.5 |
| D | 2 | 250 | 114869 | 589.64 | 817 | 797 | 193.5 |
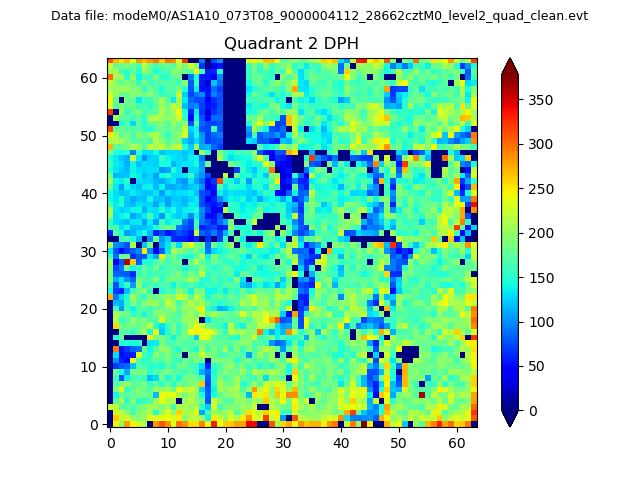
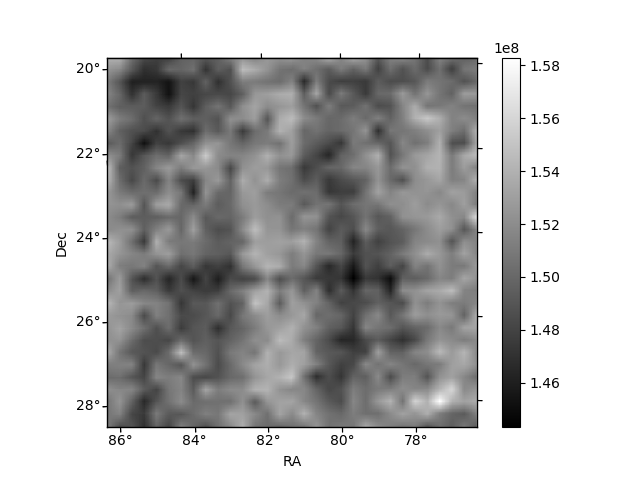
Histogram calculated using DETX and DETY for each event in the final _common_clean file
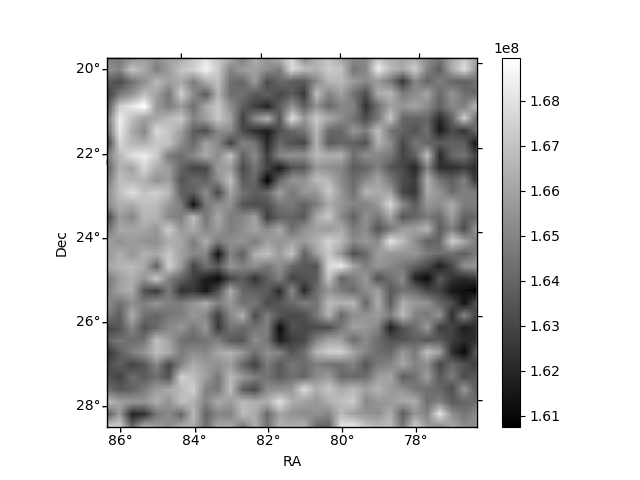
| Quadrant A | 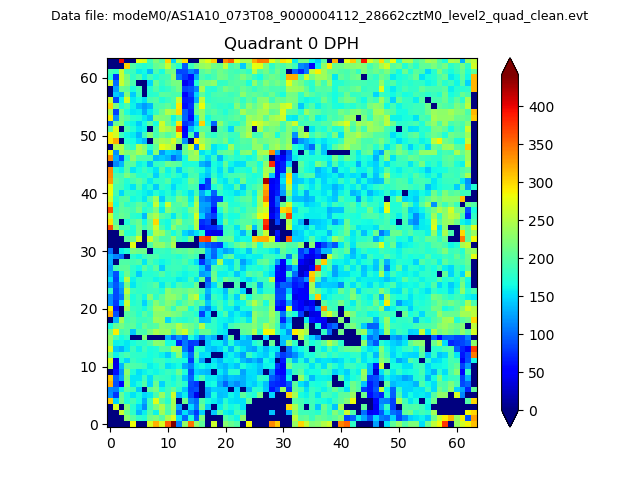 |
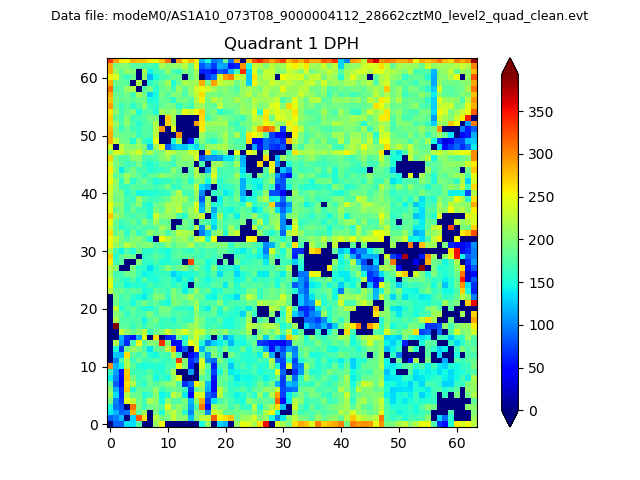 |
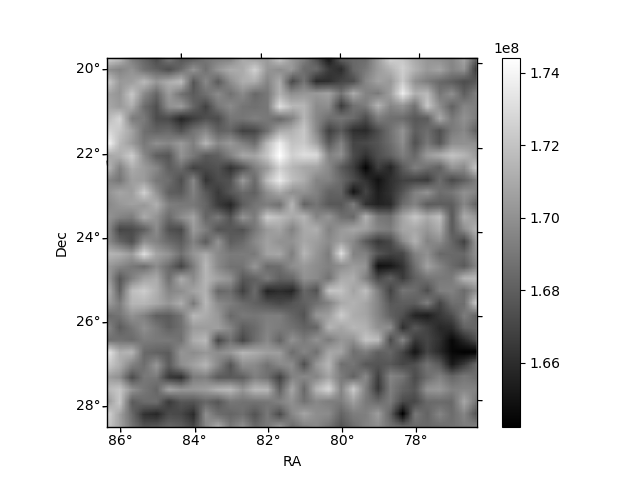
Quadrant B |
|---|---|---|---|
| Quadrant D | 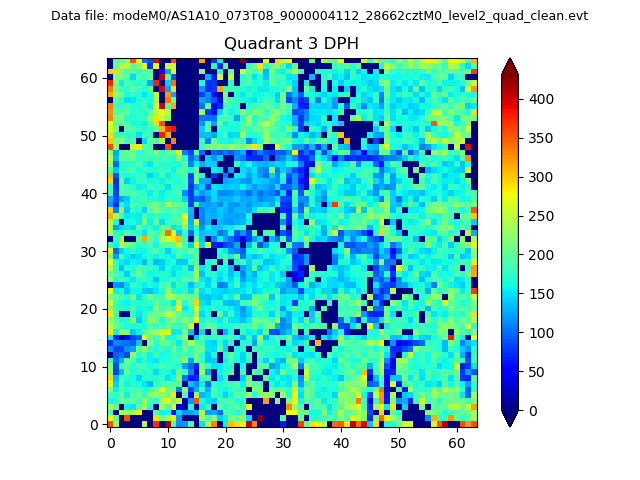 |
 |
Quadrant C |
| Plot type | Count rate plots | Images |
|---|---|---|
| Comparison with Poisson distribution Blue bars denote a histogram of data divided into 1 sec bins. Red curve is a Poisson curve with rate = median count rate of data. |
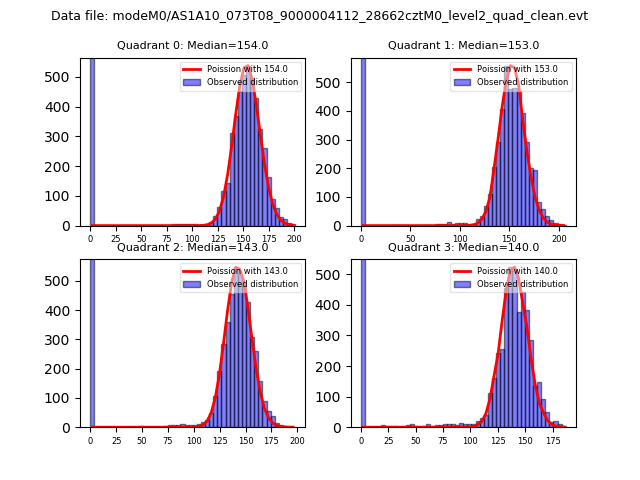 |
 |
| Quadrant-wise count rates Data is divided into 100 sec bins |
 |
|
| Module-wise count rates for Quadrant A Data is divided into 100 sec bins |
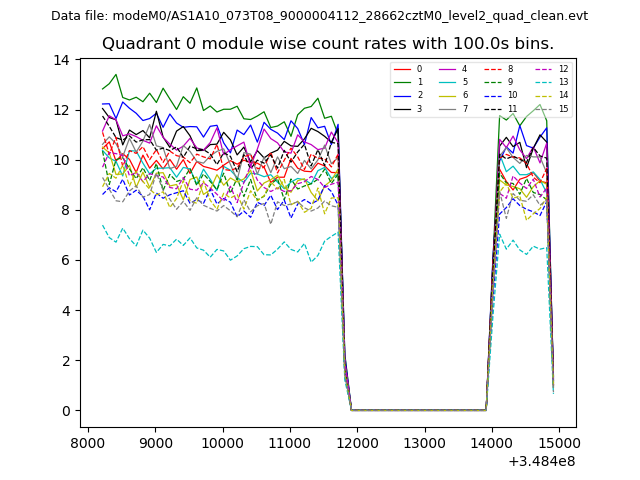 |
 |
| Module-wise count rates for Quadrant B Data is divided into 100 sec bins |
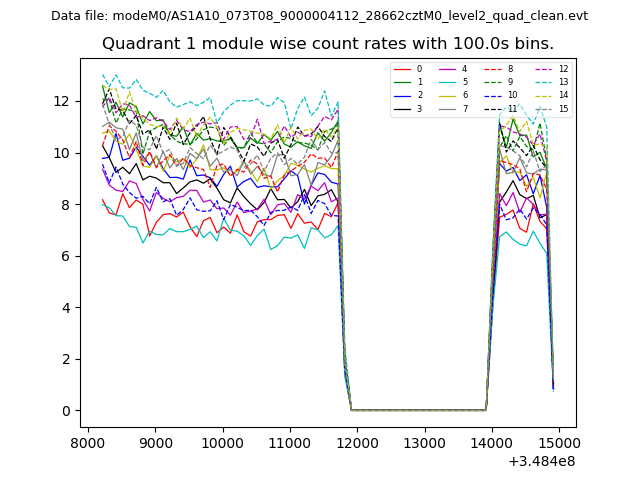 |
 |
| Module-wise count rates for Quadrant C Data is divided into 100 sec bins |
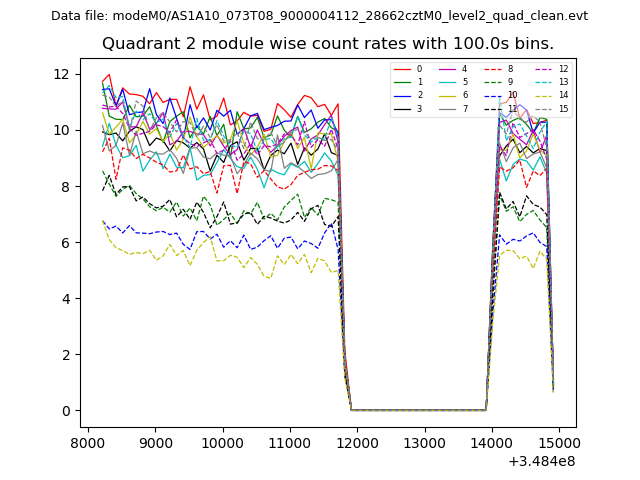 |
 |
| Module-wise count rates for Quadrant D Data is divided into 100 sec bins |
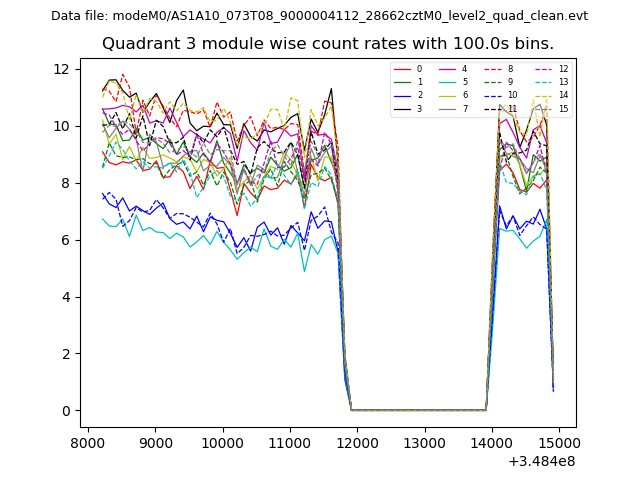 |
 |
| Parameter | Plot |
|---|---|
| CZT HV Monitor | 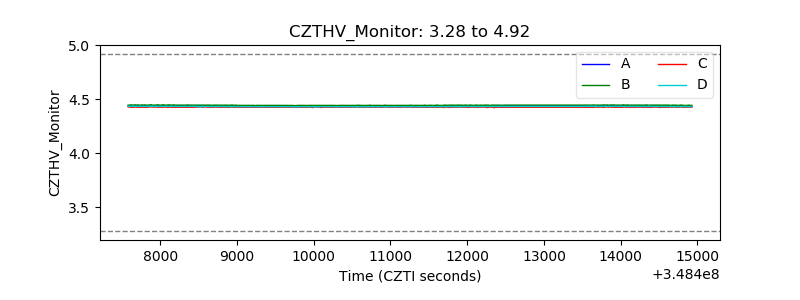 |
| D_VDD | 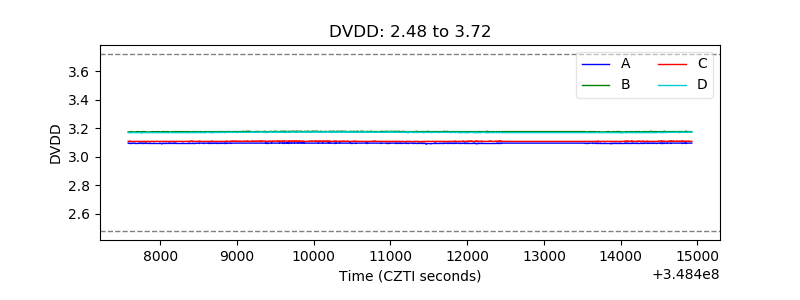 |
| Temperature 1 | 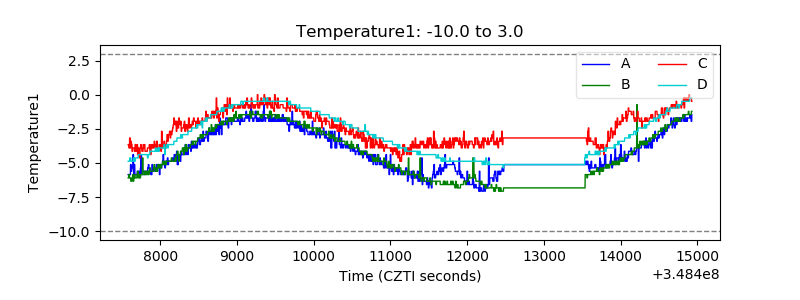 |
| Veto HV Monitor | 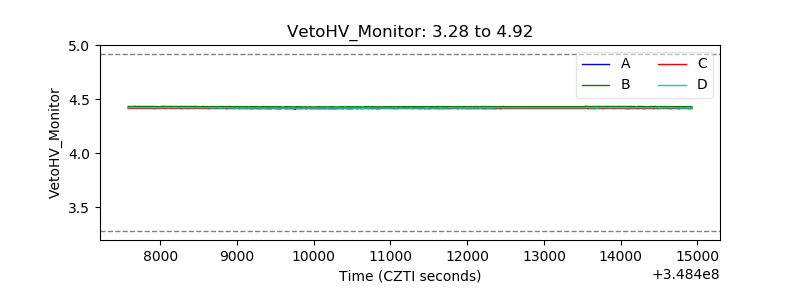 |
| Veto LLD | 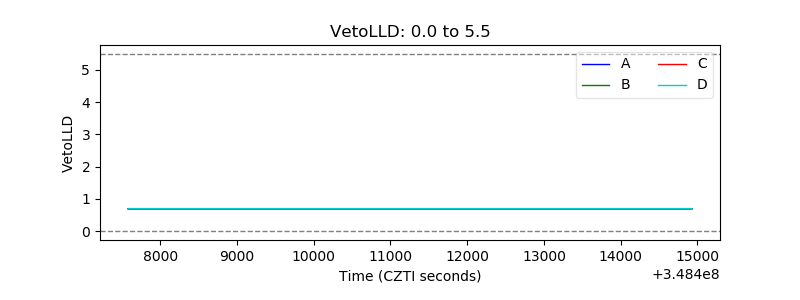 |
| Alpha Counter | 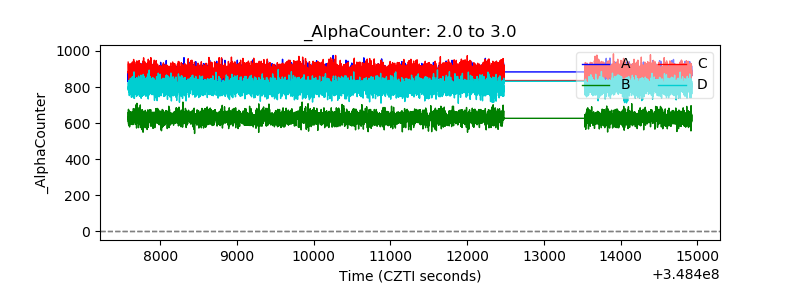 |
| _CPM_Rate | 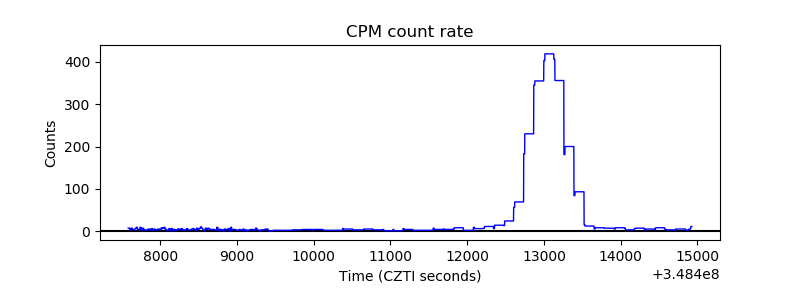 |
| CZT Counter | 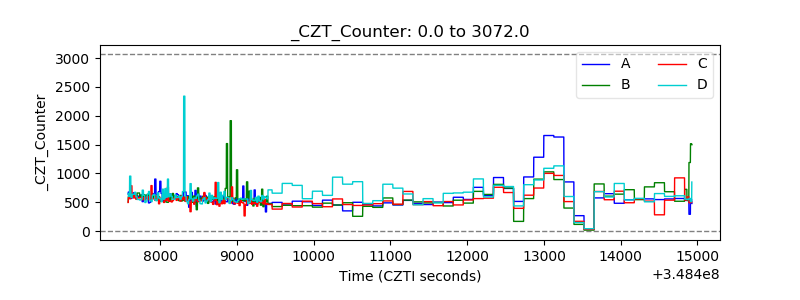 |
| +2.5 Volts monitor |  |
| +5 Volts monitor | 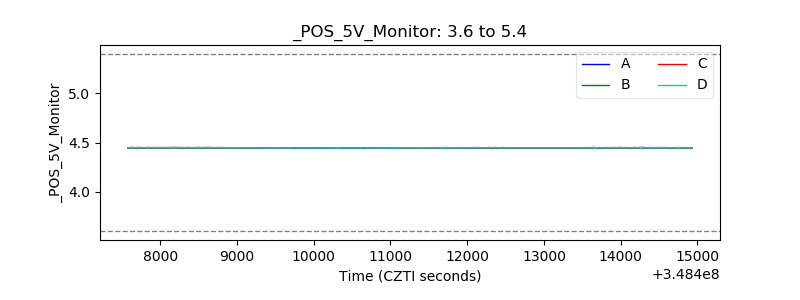 |
| _ROLL_ROT | 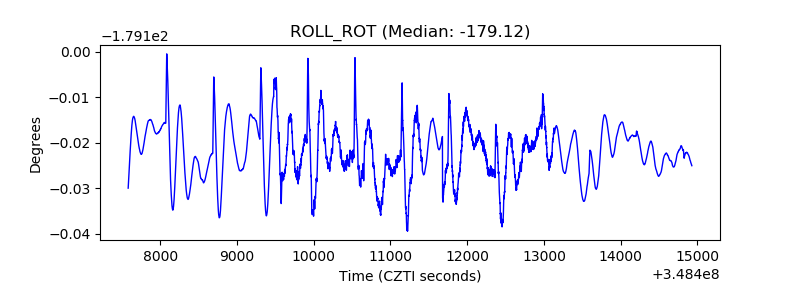 |
| _Roll_DEC | 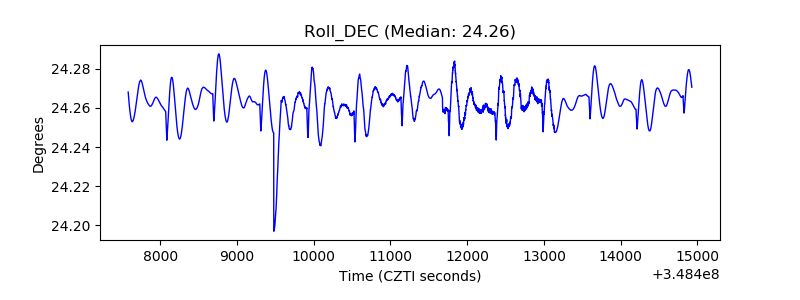 |
| _Roll_RA | 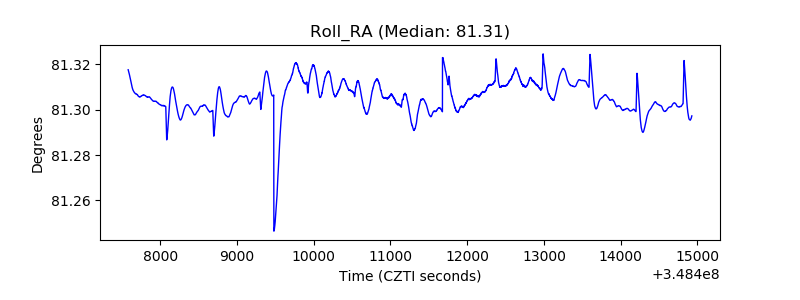 |
| Veto Counter | 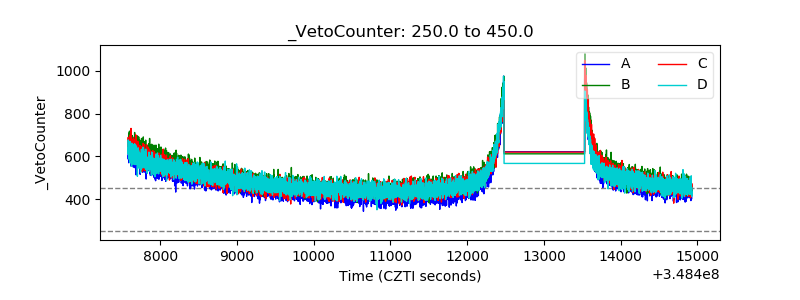 |