| Param | Original file | Final file |
|---|---|---|
| Filename | modeM0/AS1A10_073T08_9000004112_28663cztM0_level2.evt | modeM0/AS1A10_073T08_9000004112_28663cztM0_level2_quad_clean.evt |
| Size (bytes) | 520,663,680 | 100,344,960 |
| Size | 496.5 MB | 95.7 MB |
| Events in quadrant A | 3,223,828 | 681,223 |
| Events in quadrant B | 3,892,635 | 668,960 |
| Events in quadrant C | 3,221,863 | 639,774 |
| Events in quadrant D | 5,008,094 | 614,726 |
| Mode M0 | |||
|---|---|---|---|
| Quadrant | BADHDUFLAG | Total packets | Discarded packets |
| A | 0 | 13243 | 1 |
| B | 0 | 15446 | 1 |
| C | 0 | 13301 | 1 |
| D | 0 | 18920 | 1 |
| Mode SS | |||
|---|---|---|---|
| Quadrant | BADHDUFLAG | Total packets | Discarded packets |
| A | 0 | 128 | 0 |
| B | 0 | 128 | 0 |
| C | 0 | 128 | 0 |
| D | 0 | 128 | 0 |
| Mode M9 | |||
|---|---|---|---|
| Quadrant | BADHDUFLAG | Total packets | Discarded packets |
| A | 0 | 7 | 0 |
| B | 0 | 7 | 0 |
| C | 0 | 7 | 0 |
| D | 0 | 7 | 0 |
| Quadrant | Total seconds | Saturated seconds | Saturation percentage |
|---|---|---|---|
| A | 6213 | 102 | 1.641719% |
| B | 6214 | 271 | 4.361120% |
| C | 6213 | 180 | 2.897151% |
| D | 6213 | 461 | 7.419926% |
Noise dominated data is calculated using 1-second bins in cleaned event files. If a bin has >2000 counts, and if more than 50% of those come from <1% of pixels, then it is considered to be noise-dominated and hence unusable.
| Quadrant | # 1 sec bins | Bins with >0 counts | Bins with >2000 counts | High rate bins dominated by noise | Noise dominated (total time) | Noise dominated (detector-on time) | Marked lightcurve |
|---|---|---|---|---|---|---|---|
| A | 6978 | 6213 | 2 | 2 | 0.03% | 0.03% | 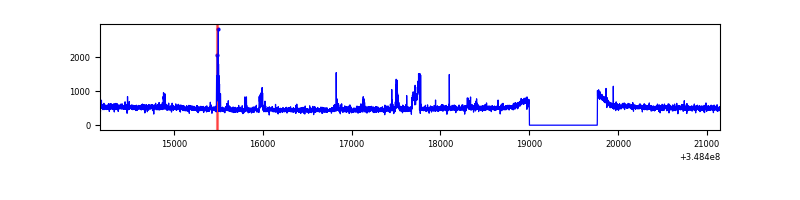 |
| B | 6979 | 6214 | 140 | 140 | 2.01% | 2.25% | 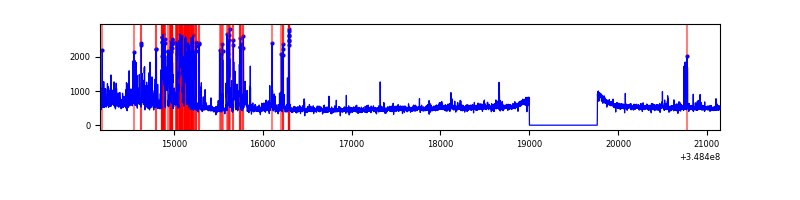 |
| C | 6978 | 6214 | 37 | 37 | 0.53% | 0.60% | 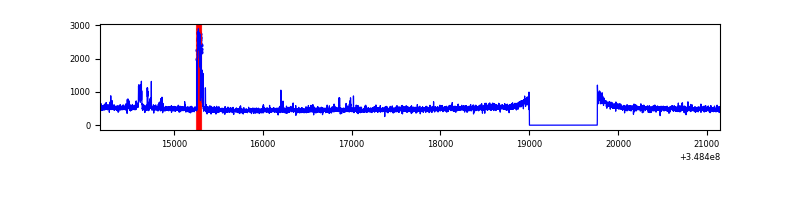 |
| D | 6978 | 6214 | 359 | 359 | 5.14% | 5.78% | 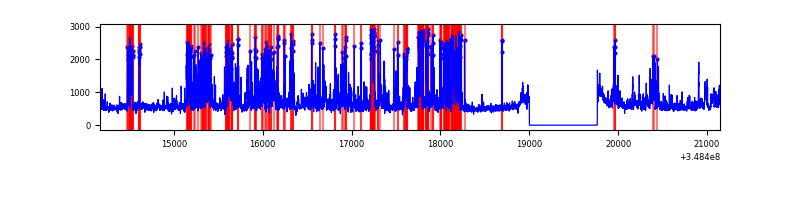 |
Top three noisy pixels from each quadrant. If the there are fewer than three noisy pixels in the level2.evt file, extra rows are filled as -1
| Pixel properties | Quadrant properties | ||||||
|---|---|---|---|---|---|---|---|
| Quadrant | DetID | PixID | Counts | Sigma | Mean | Median | Sigma |
| A | 15 | 174 | 145604 | 899.64 | 798 | 784 | 161.0 |
| A | 13 | 254 | 12490 | 72.72 | 798 | 784 | 161.0 |
| A | 3 | 137 | 7516 | 41.82 | 798 | 784 | 161.0 |
| B | 10 | 245 | 699167 | 4732.24 | 779 | 761 | 147.6 |
| B | 5 | 172 | 102019 | 686.1 | 779 | 761 | 147.6 |
| B | 12 | 111 | 17657 | 114.48 | 779 | 761 | 147.6 |
| C | 2 | 16 | 143684 | 818.81 | 748 | 755 | 174.6 |
| C | 14 | 238 | 132109 | 752.5 | 748 | 755 | 174.6 |
| C | 14 | 254 | 16062 | 87.69 | 748 | 755 | 174.6 |
| D | 1 | 52 | 1787520 | 10013.98 | 748 | 729 | 178.4 |
| D | 8 | 195 | 276270 | 1544.26 | 748 | 729 | 178.4 |
| D | 2 | 250 | 39376 | 216.6 | 748 | 729 | 178.4 |
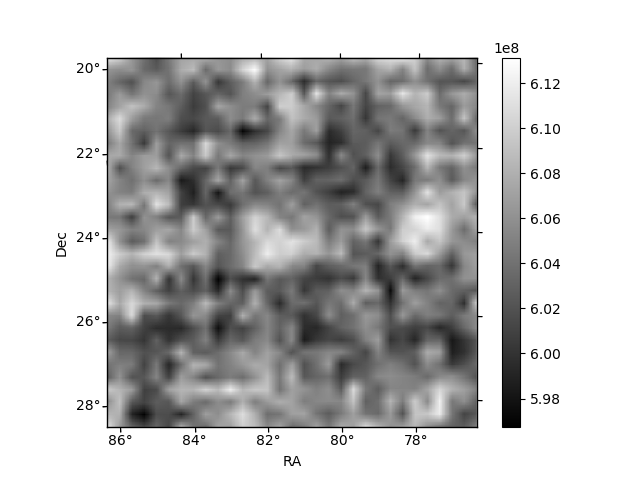
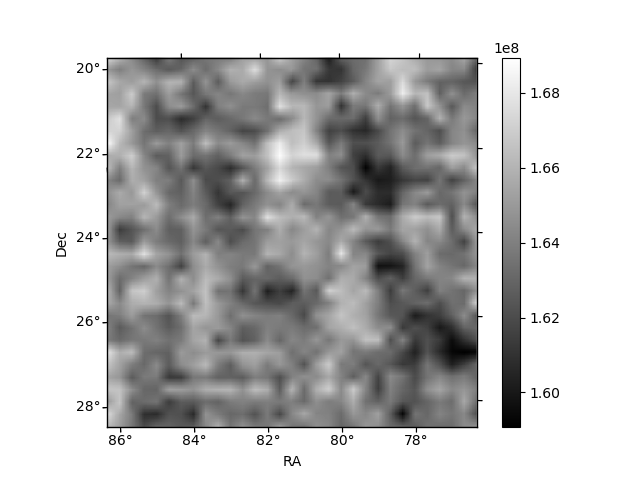
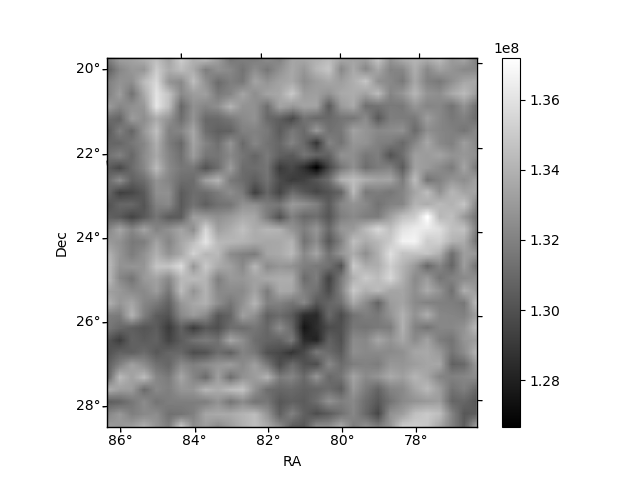
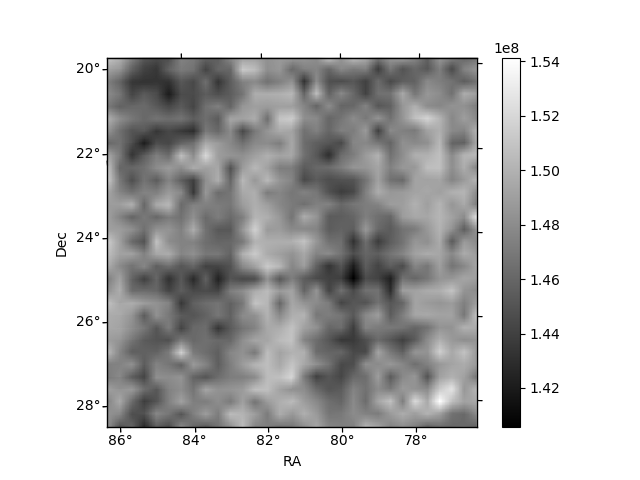
Histogram calculated using DETX and DETY for each event in the final _common_clean file
| Quadrant A | 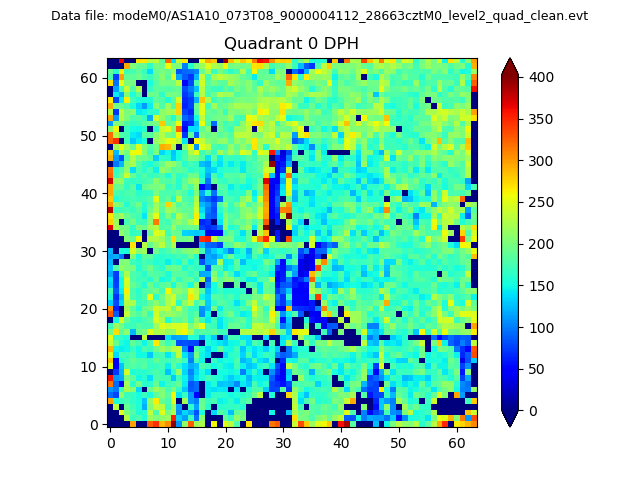 |
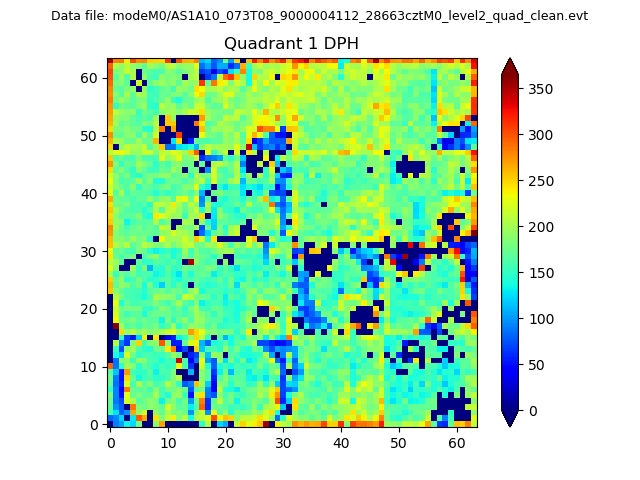 |
Quadrant B |
|---|---|---|---|
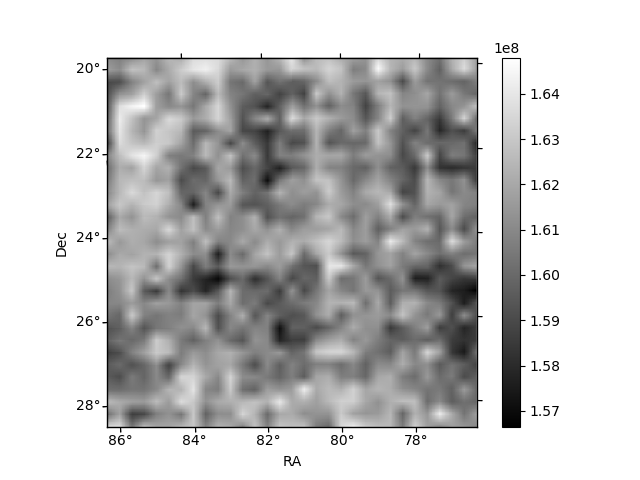
| Quadrant D | 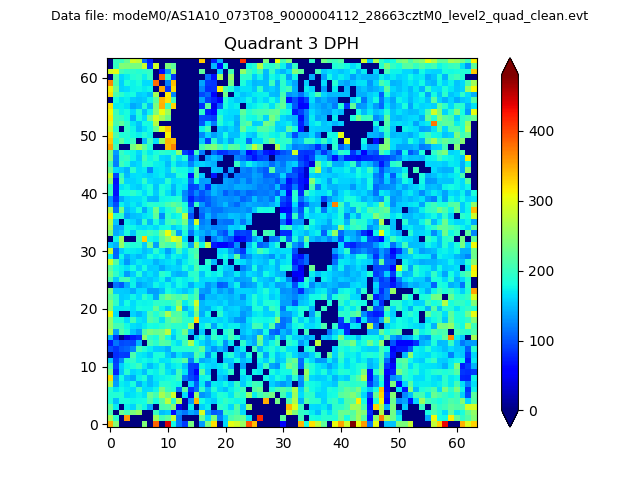 |
 |
Quadrant C |
| Plot type | Count rate plots | Images |
|---|---|---|
| Comparison with Poisson distribution Blue bars denote a histogram of data divided into 1 sec bins. Red curve is a Poisson curve with rate = median count rate of data. |
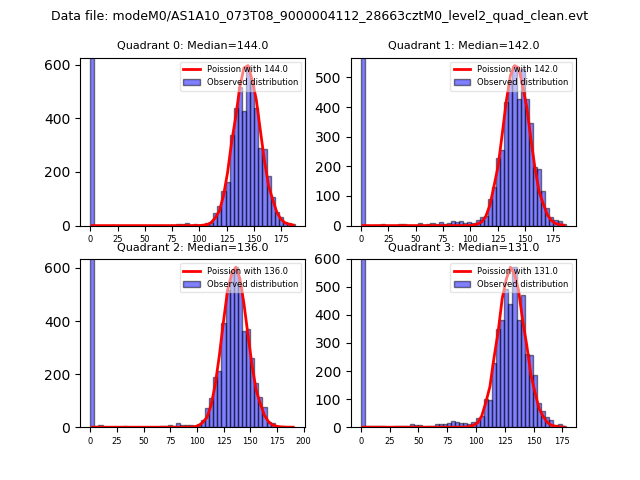 |
 |
| Quadrant-wise count rates Data is divided into 100 sec bins |
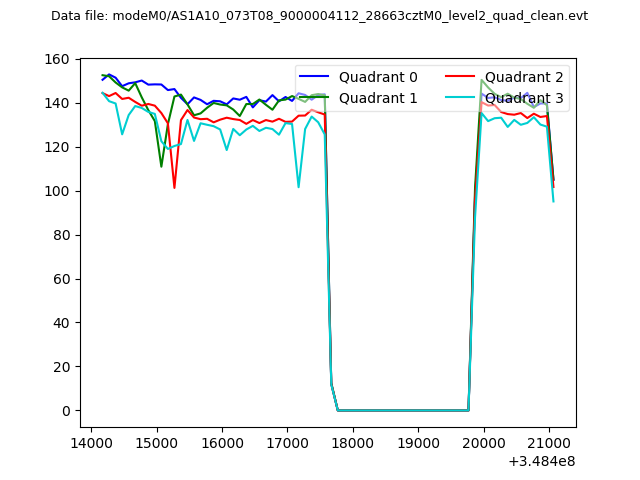 |
|
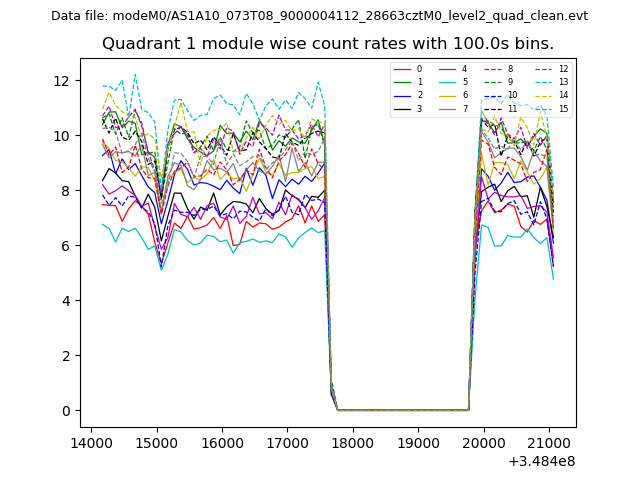
| Module-wise count rates for Quadrant A Data is divided into 100 sec bins |
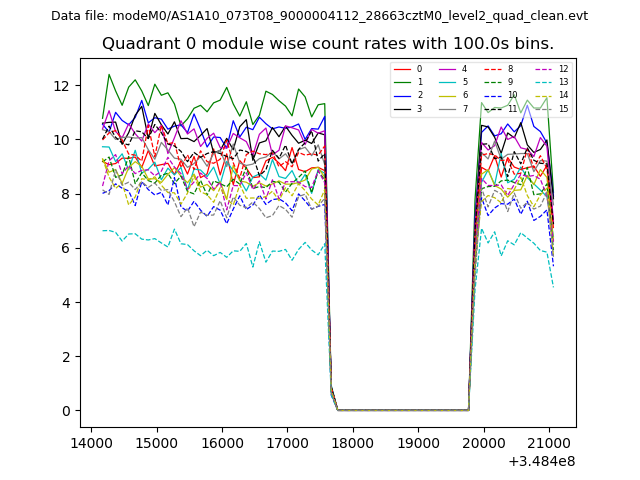 |
 |
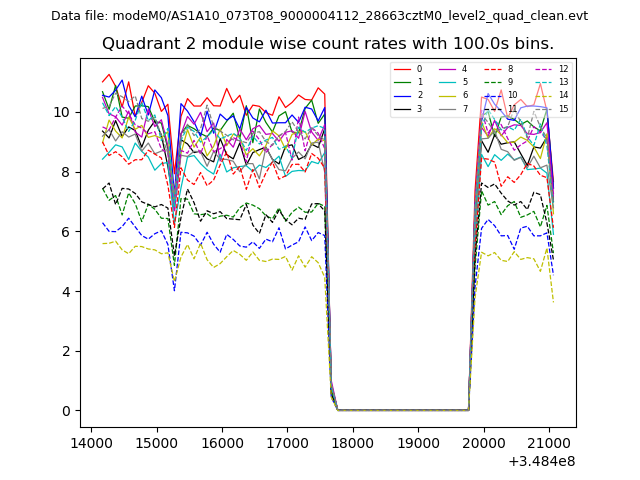
| Module-wise count rates for Quadrant B Data is divided into 100 sec bins |
 |
 |
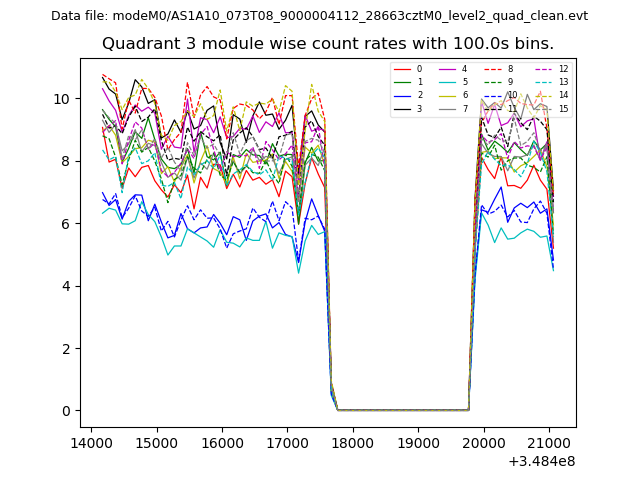
| Module-wise count rates for Quadrant C Data is divided into 100 sec bins |
 |
 |
| Module-wise count rates for Quadrant D Data is divided into 100 sec bins |
 |
 |
| Parameter | Plot |
|---|---|
| CZT HV Monitor | 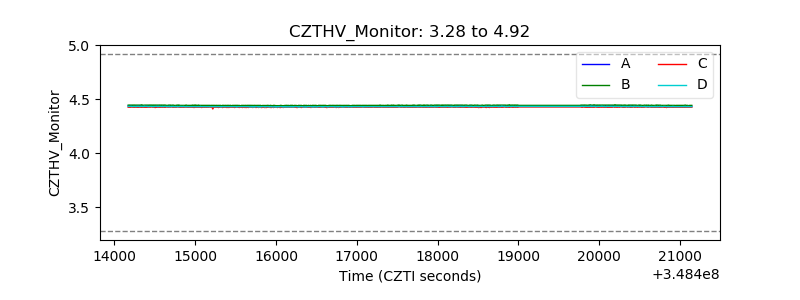 |
| D_VDD | 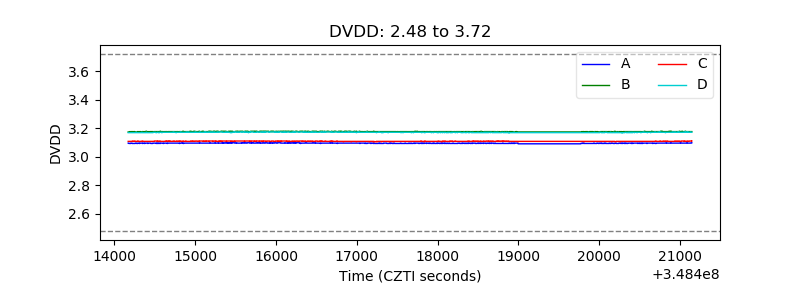 |
| Temperature 1 | 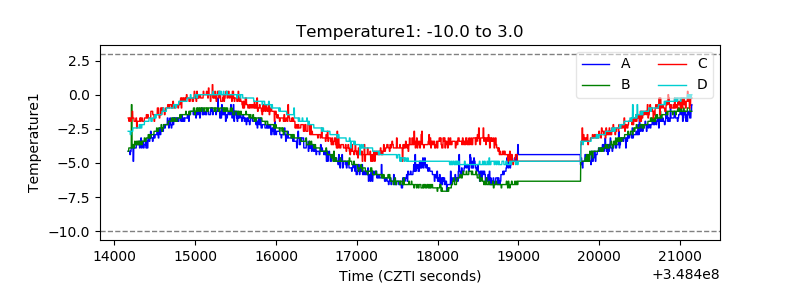 |
| Veto HV Monitor | 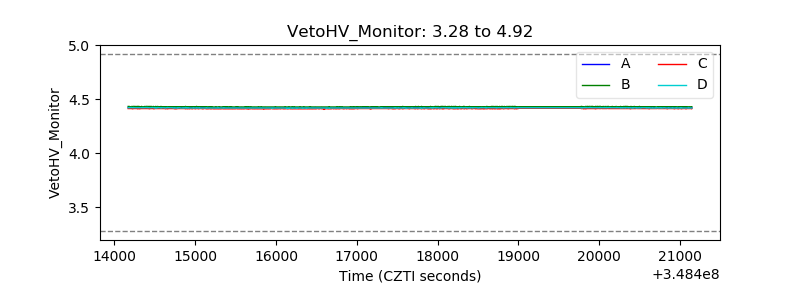 |
| Veto LLD | 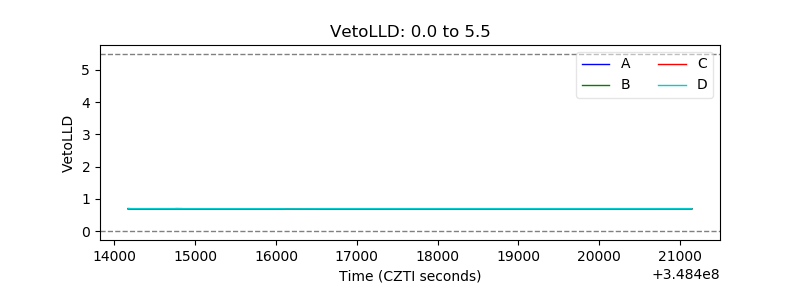 |
| Alpha Counter | 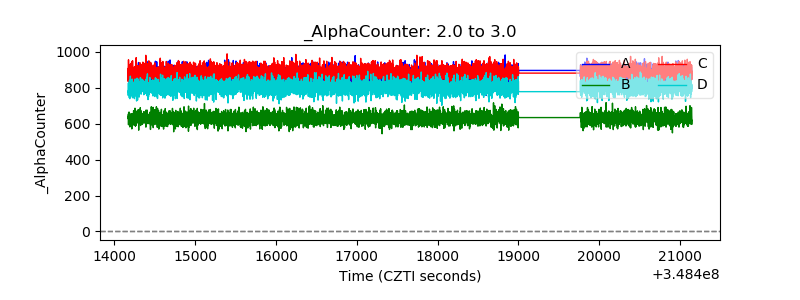 |
| _CPM_Rate | 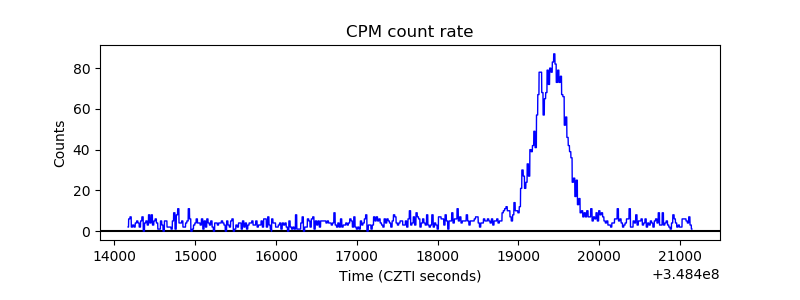 |
| CZT Counter | 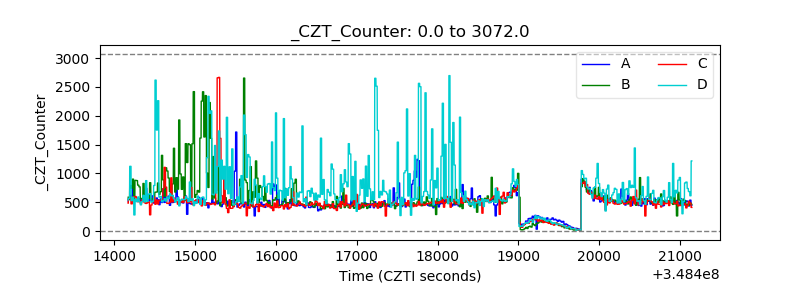 |
| +2.5 Volts monitor | 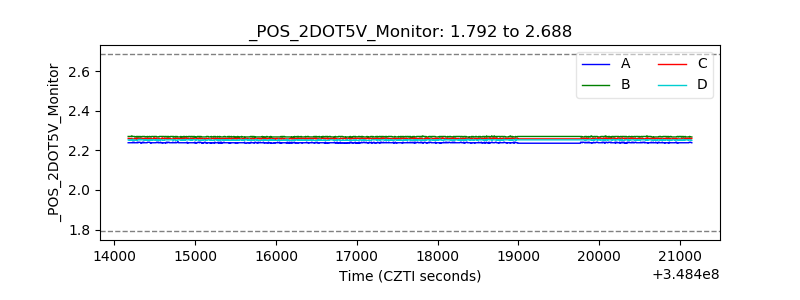 |
| +5 Volts monitor |  |
| _ROLL_ROT | 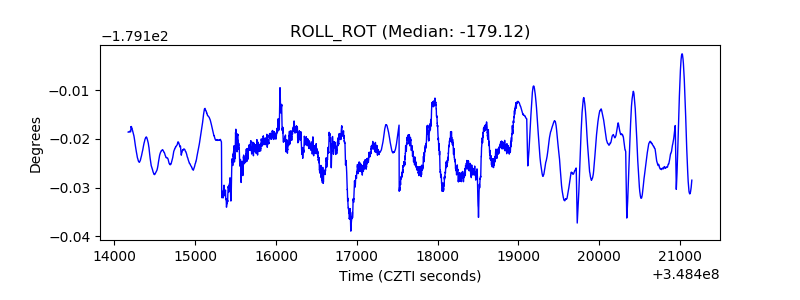 |
| _Roll_DEC | 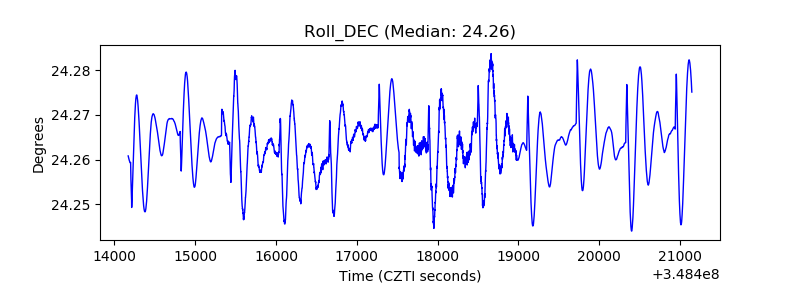 |
| _Roll_RA | 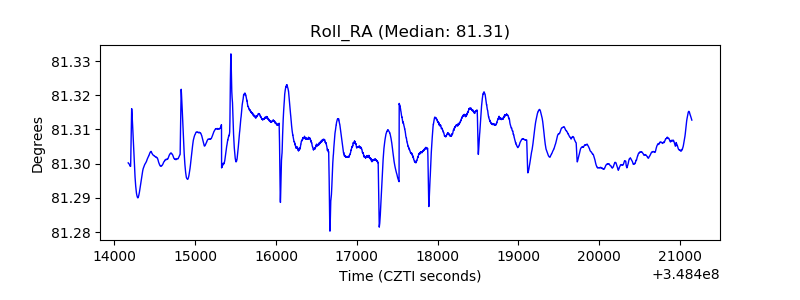 |
| Veto Counter | 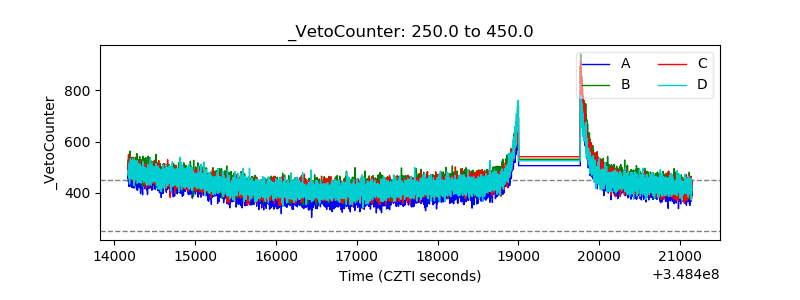 |