| Param | Original file | Final file |
|---|---|---|
| Filename | modeM0/AS1A10_073T08_9000004112_28664cztM0_level2.evt | modeM0/AS1A10_073T08_9000004112_28664cztM0_level2_quad_clean.evt |
| Size (bytes) | 642,525,120 | 107,504,640 |
| Size | 612.8 MB | 102.5 MB |
| Events in quadrant A | 4,043,190 | 706,050 |
| Events in quadrant B | 4,791,672 | 699,400 |
| Events in quadrant C | 4,066,259 | 670,046 |
| Events in quadrant D | 6,037,610 | 646,017 |
| Mode M0 | |||
|---|---|---|---|
| Quadrant | BADHDUFLAG | Total packets | Discarded packets |
| A | 0 | 16754 | 2 |
| B | 0 | 19161 | 3 |
| C | 0 | 16884 | 2 |
| D | 0 | 23079 | 2 |
| Mode SS | |||
|---|---|---|---|
| Quadrant | BADHDUFLAG | Total packets | Discarded packets |
| A | 0 | 158 | 0 |
| B | 0 | 158 | 0 |
| C | 0 | 158 | 0 |
| D | 0 | 158 | 0 |
| Mode M9 | |||
|---|---|---|---|
| Quadrant | BADHDUFLAG | Total packets | Discarded packets |
| A | 0 | 10 | 0 |
| B | 0 | 10 | 0 |
| C | 0 | 10 | 0 |
| D | 0 | 10 | 0 |
| Quadrant | Total seconds | Saturated seconds | Saturation percentage |
|---|---|---|---|
| A | 7678 | 239 | 3.112790% |
| B | 7677 | 449 | 5.848639% |
| C | 7677 | 416 | 5.418783% |
| D | 7677 | 498 | 6.486909% |
Noise dominated data is calculated using 1-second bins in cleaned event files. If a bin has >2000 counts, and if more than 50% of those come from <1% of pixels, then it is considered to be noise-dominated and hence unusable.
| Quadrant | # 1 sec bins | Bins with >0 counts | Bins with >2000 counts | High rate bins dominated by noise | Noise dominated (total time) | Noise dominated (detector-on time) | Marked lightcurve |
|---|---|---|---|---|---|---|---|
| A | 8743 | 7678 | 14 | 14 | 0.16% | 0.18% | 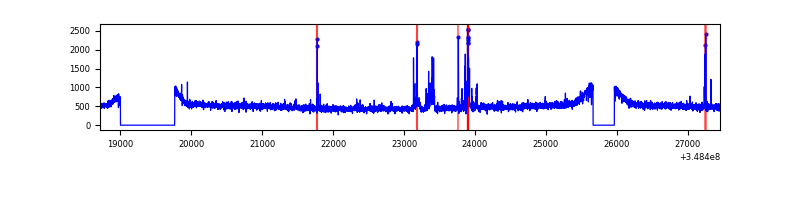 |
| B | 8742 | 7677 | 111 | 111 | 1.27% | 1.45% | 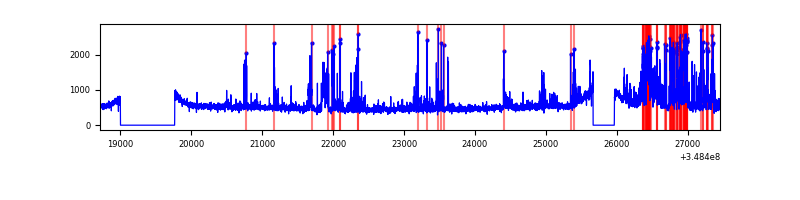 |
| C | 8742 | 7678 | 42 | 42 | 0.48% | 0.55% | 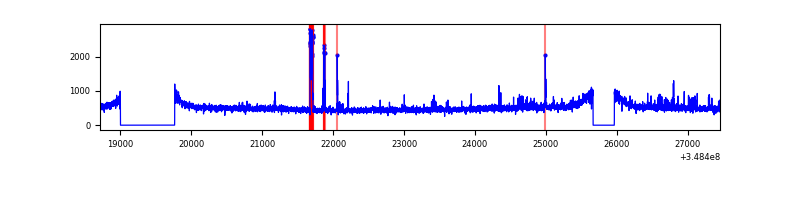 |
| D | 8742 | 7678 | 378 | 378 | 4.32% | 4.92% | 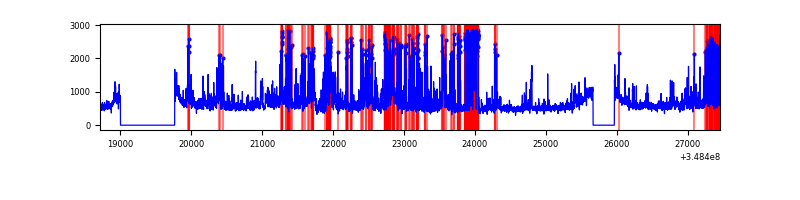 |
Top three noisy pixels from each quadrant. If the there are fewer than three noisy pixels in the level2.evt file, extra rows are filled as -1
| Pixel properties | Quadrant properties | ||||||
|---|---|---|---|---|---|---|---|
| Quadrant | DetID | PixID | Counts | Sigma | Mean | Median | Sigma |
| A | 15 | 174 | 175818 | 859.84 | 1001 | 981 | 203.3 |
| A | 13 | 254 | 14624 | 67.1 | 1001 | 981 | 203.3 |
| A | 3 | 137 | 9762 | 43.18 | 1001 | 981 | 203.3 |
| B | 10 | 245 | 893423 | 4718.97 | 978 | 954 | 189.1 |
| B | 0 | 156 | 23821 | 120.91 | 978 | 954 | 189.1 |
| B | 12 | 111 | 23351 | 118.43 | 978 | 954 | 189.1 |
| C | 14 | 238 | 190018 | 855.5 | 938 | 943 | 221.0 |
| C | 2 | 16 | 153656 | 690.98 | 938 | 943 | 221.0 |
| C | 14 | 254 | 59055 | 262.94 | 938 | 943 | 221.0 |
| D | 1 | 52 | 1916210 | 8362.91 | 952 | 928 | 229.0 |
| D | 8 | 195 | 361246 | 1573.3 | 952 | 928 | 229.0 |
| D | 2 | 250 | 87865 | 379.6 | 952 | 928 | 229.0 |
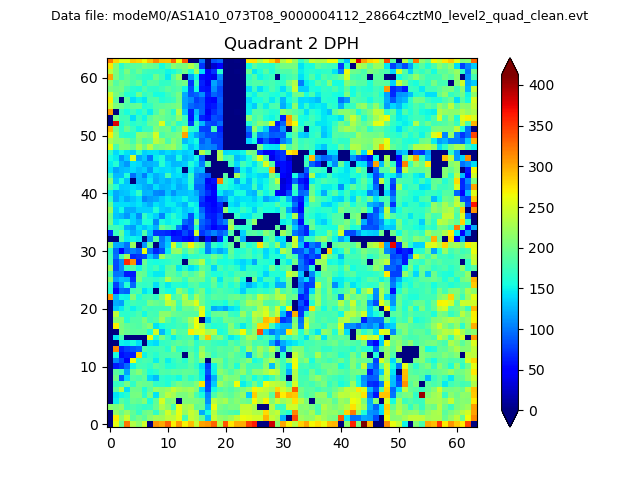
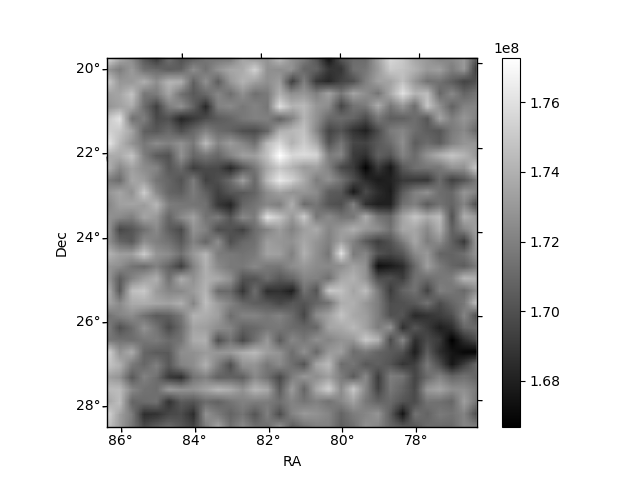
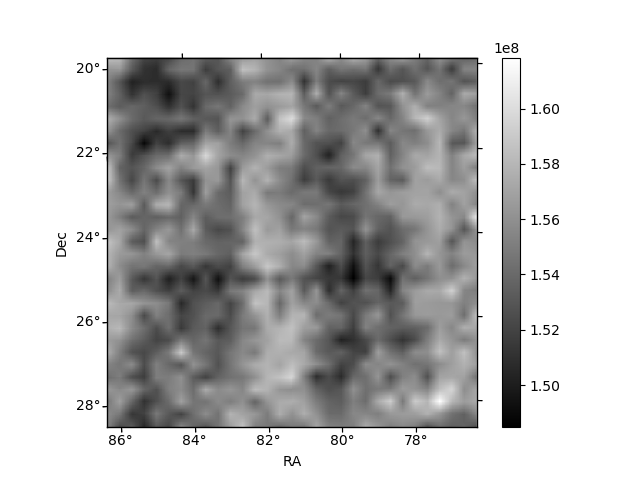
Histogram calculated using DETX and DETY for each event in the final _common_clean file
| Quadrant A | 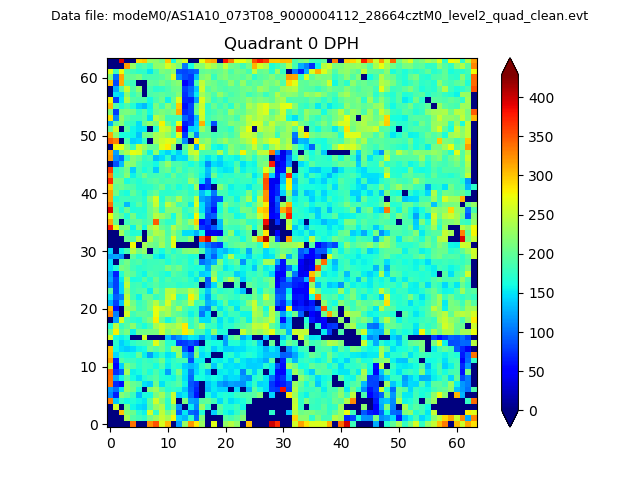 |
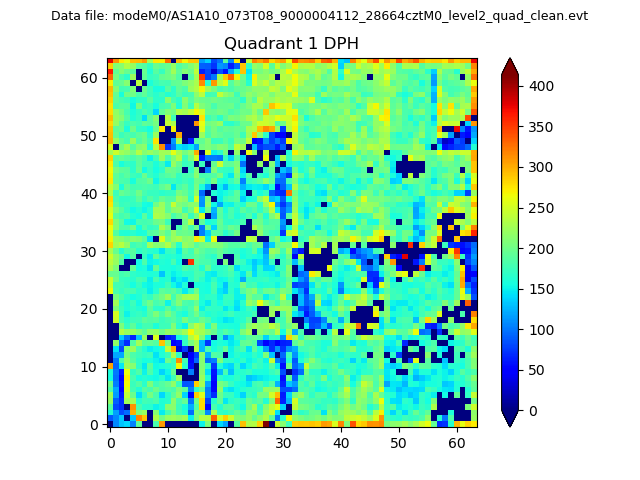 |
Quadrant B |
|---|---|---|---|
| Quadrant D | 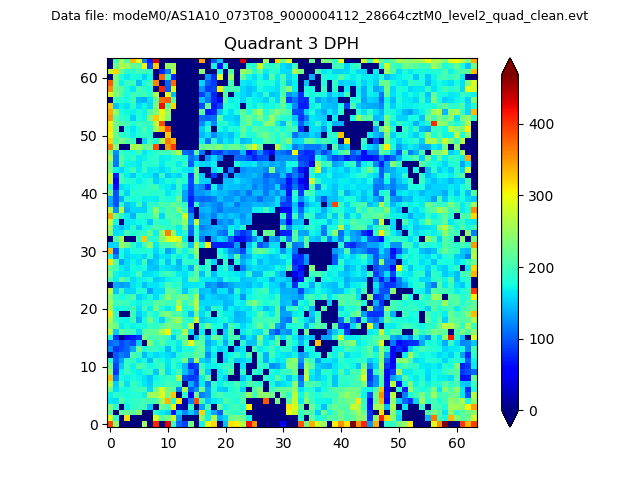 |
 |
Quadrant C |
| Plot type | Count rate plots | Images |
|---|---|---|
| Comparison with Poisson distribution Blue bars denote a histogram of data divided into 1 sec bins. Red curve is a Poisson curve with rate = median count rate of data. |
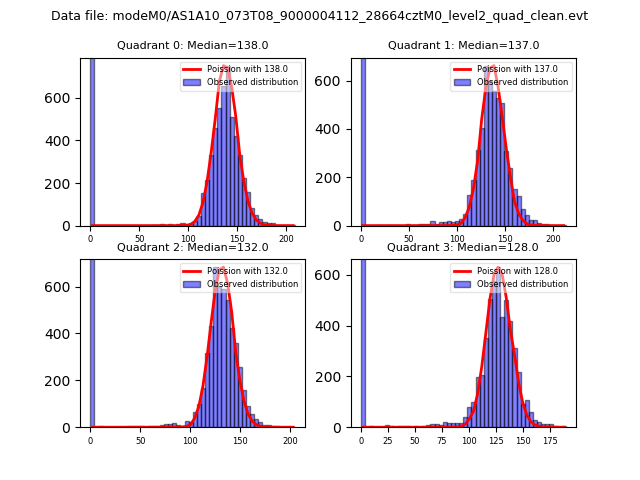 |
 |
| Quadrant-wise count rates Data is divided into 100 sec bins |
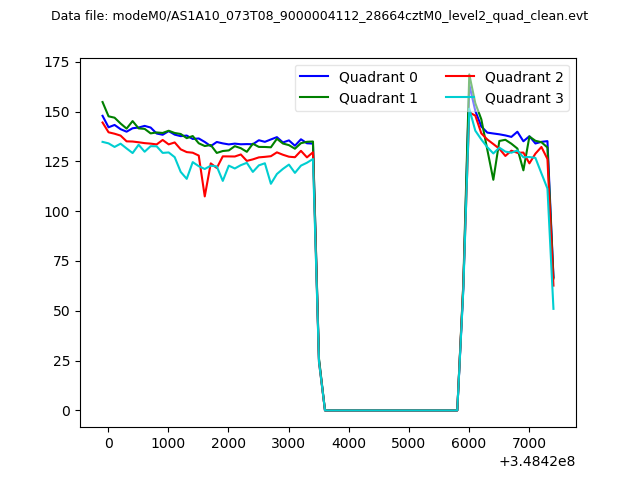 |
|
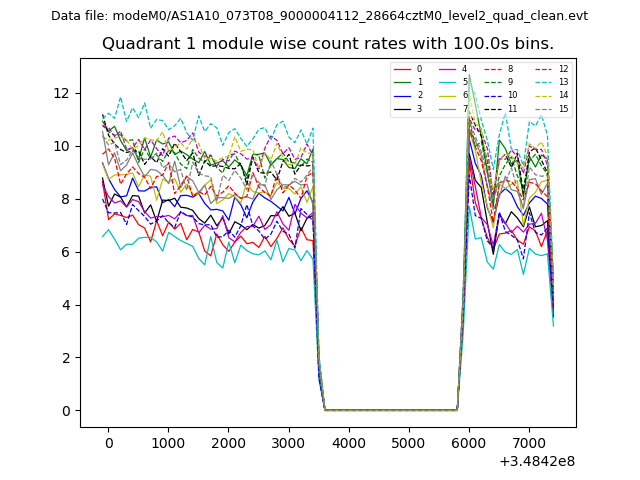
| Module-wise count rates for Quadrant A Data is divided into 100 sec bins |
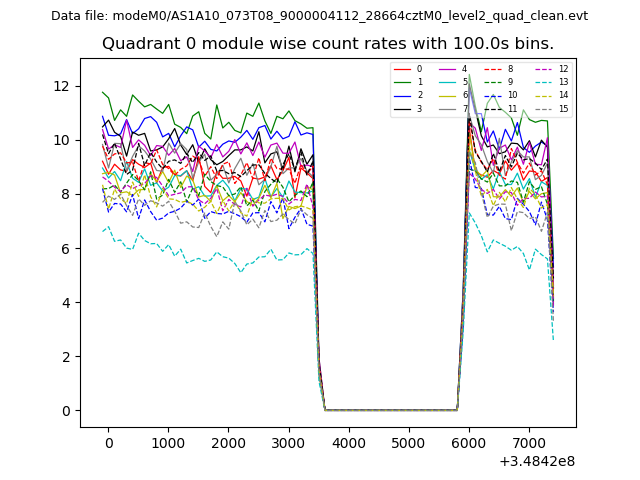 |
 |
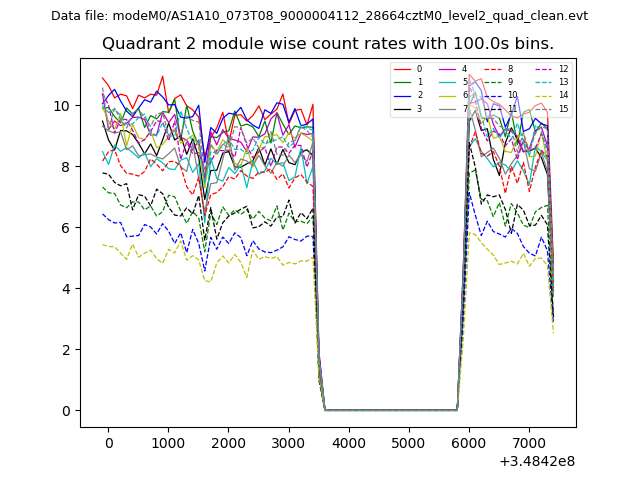
| Module-wise count rates for Quadrant B Data is divided into 100 sec bins |
 |
 |
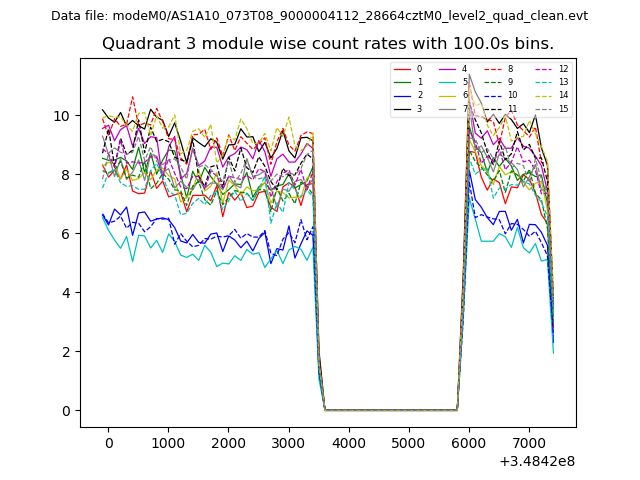
| Module-wise count rates for Quadrant C Data is divided into 100 sec bins |
 |
 |
| Module-wise count rates for Quadrant D Data is divided into 100 sec bins |
 |
 |
| Parameter | Plot |
|---|---|
| CZT HV Monitor | 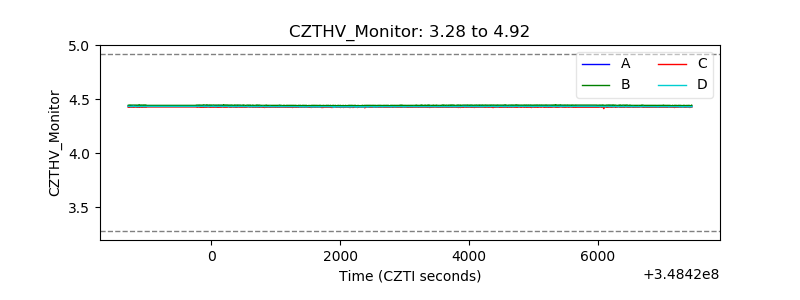 |
| D_VDD |  |
| Temperature 1 | 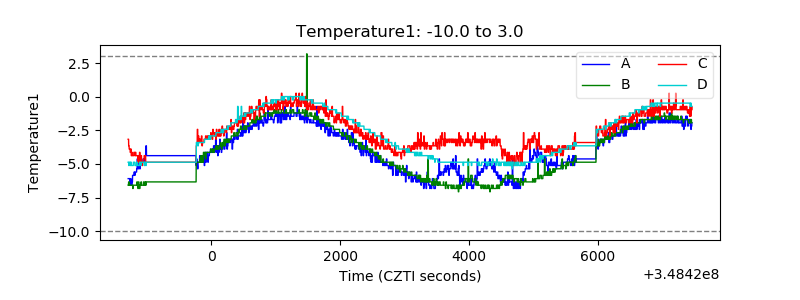 |
| Veto HV Monitor |  |
| Veto LLD | 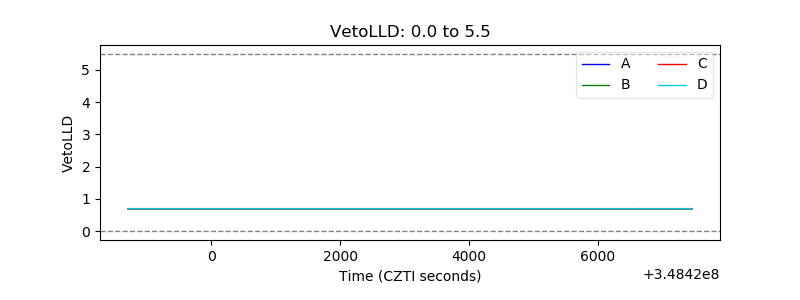 |
| Alpha Counter | 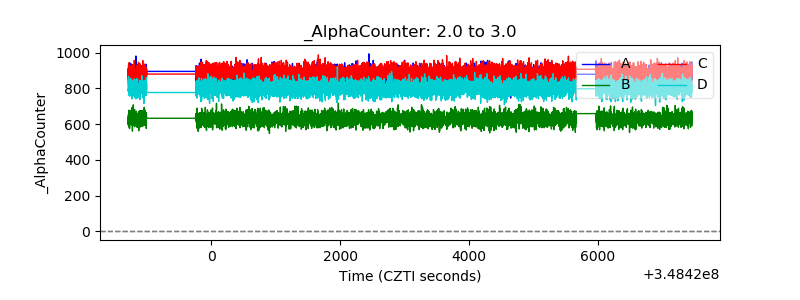 |
| _CPM_Rate | 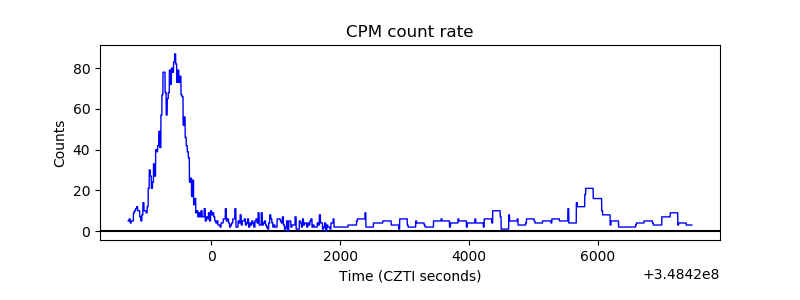 |
| CZT Counter | 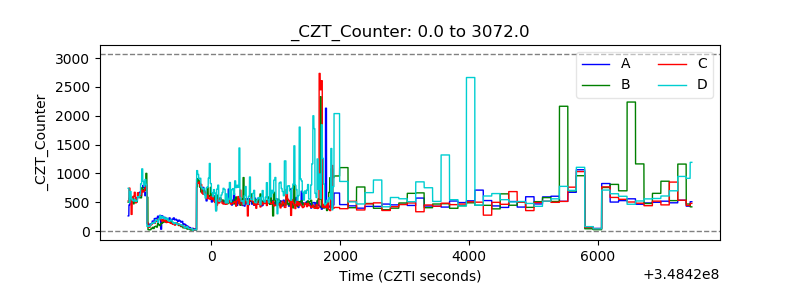 |
| +2.5 Volts monitor |  |
| +5 Volts monitor | 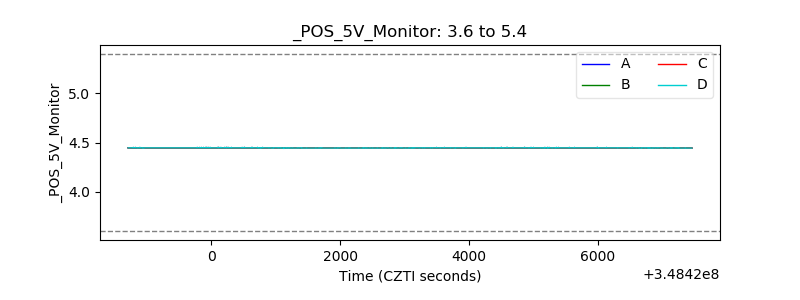 |
| _ROLL_ROT | 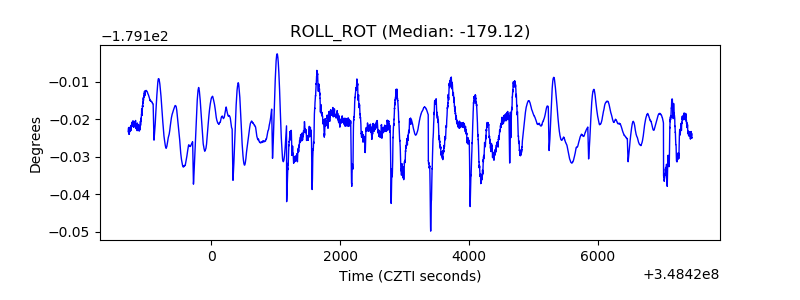 |
| _Roll_DEC | 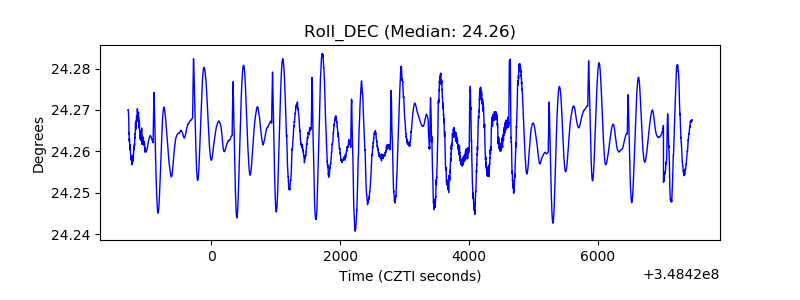 |
| _Roll_RA |  |
| Veto Counter | 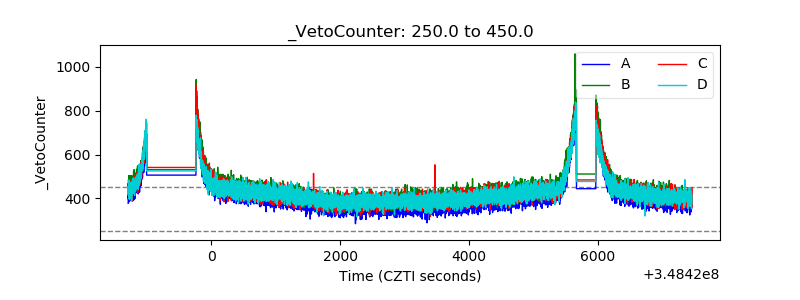 |