| Param | Original file | Final file |
|---|---|---|
| Filename | modeM0/AS1A10_073T08_9000004112_28665cztM0_level2.evt | modeM0/AS1A10_073T08_9000004112_28665cztM0_level2_quad_clean.evt |
| Size (bytes) | 672,606,720 | 107,760,960 |
| Size | 641.4 MB | 102.8 MB |
| Events in quadrant A | 3,942,163 | 715,329 |
| Events in quadrant B | 6,210,806 | 693,596 |
| Events in quadrant C | 3,791,201 | 681,065 |
| Events in quadrant D | 5,919,496 | 652,576 |
| Mode M0 | |||
|---|---|---|---|
| Quadrant | BADHDUFLAG | Total packets | Discarded packets |
| A | 0 | 16452 | 2 |
| B | 0 | 23504 | 2 |
| C | 0 | 15973 | 2 |
| D | 0 | 22584 | 2 |
| Mode SS | |||
|---|---|---|---|
| Quadrant | BADHDUFLAG | Total packets | Discarded packets |
| A | 0 | 152 | 0 |
| B | 0 | 152 | 0 |
| C | 0 | 152 | 0 |
| D | 0 | 152 | 0 |
| Mode M9 | |||
|---|---|---|---|
| Quadrant | BADHDUFLAG | Total packets | Discarded packets |
| A | 0 | 1 | 0 |
| B | 0 | 1 | 0 |
| C | 0 | 1 | 0 |
| D | 0 | 1 | 0 |
| Quadrant | Total seconds | Saturated seconds | Saturation percentage |
|---|---|---|---|
| A | 7479 | 178 | 2.379997% |
| B | 7480 | 919 | 12.286096% |
| C | 7480 | 270 | 3.609626% |
| D | 7480 | 385 | 5.147059% |
Noise dominated data is calculated using 1-second bins in cleaned event files. If a bin has >2000 counts, and if more than 50% of those come from <1% of pixels, then it is considered to be noise-dominated and hence unusable.
| Quadrant | # 1 sec bins | Bins with >0 counts | Bins with >2000 counts | High rate bins dominated by noise | Noise dominated (total time) | Noise dominated (detector-on time) | Marked lightcurve |
|---|---|---|---|---|---|---|---|
| A | 7558 | 7478 | 30 | 30 | 0.40% | 0.40% | 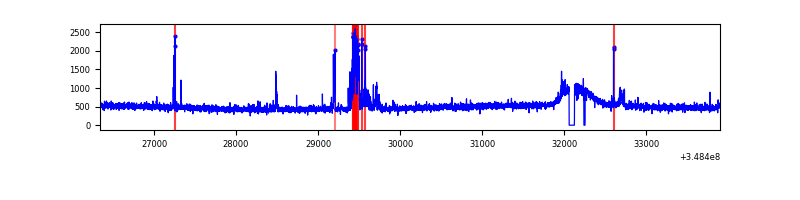 |
| B | 7561 | 7481 | 491 | 491 | 6.49% | 6.56% | 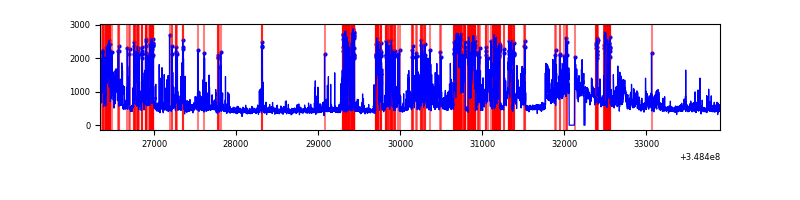 |
| C | 7560 | 7481 | 0 | 0 | 0.00% | 0.00% | 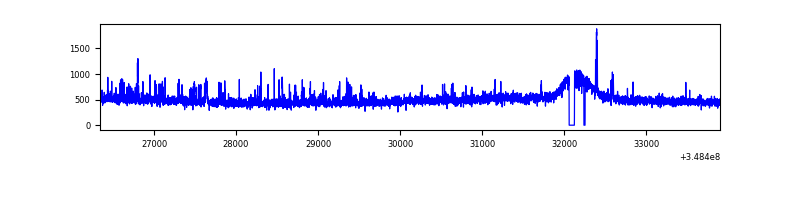 |
| D | 7560 | 7481 | 226 | 226 | 2.99% | 3.02% | 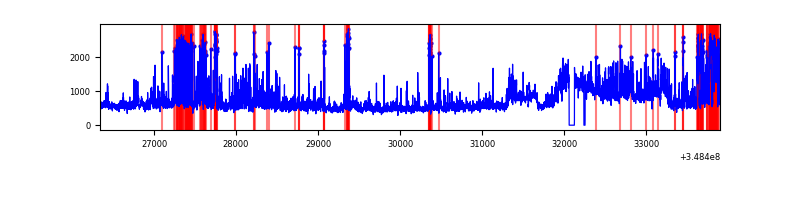 |
Top three noisy pixels from each quadrant. If the there are fewer than three noisy pixels in the level2.evt file, extra rows are filled as -1
| Pixel properties | Quadrant properties | ||||||
|---|---|---|---|---|---|---|---|
| Quadrant | DetID | PixID | Counts | Sigma | Mean | Median | Sigma |
| A | 15 | 174 | 280831 | 1453.43 | 946 | 926 | 192.6 |
| A | 13 | 254 | 13206 | 63.77 | 946 | 926 | 192.6 |
| A | 3 | 137 | 9124 | 42.57 | 946 | 926 | 192.6 |
| B | 10 | 245 | 2625253 | 15160.59 | 900 | 880 | 173.1 |
| B | 12 | 111 | 21156 | 117.13 | 900 | 880 | 173.1 |
| B | 11 | 111 | 19370 | 106.81 | 900 | 880 | 173.1 |
| C | 14 | 238 | 199863 | 943.16 | 891 | 898 | 211.0 |
| C | 14 | 254 | 80693 | 378.25 | 891 | 898 | 211.0 |
| C | 2 | 16 | 36938 | 170.84 | 891 | 898 | 211.0 |
| D | 1 | 52 | 1188939 | 5492.21 | 902 | 878 | 216.3 |
| D | 8 | 195 | 975869 | 4507.22 | 902 | 878 | 216.3 |
| D | 13 | 104 | 191715 | 882.21 | 902 | 878 | 216.3 |
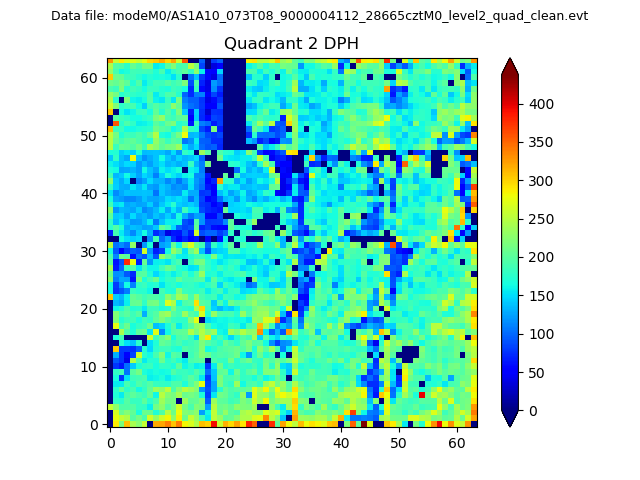
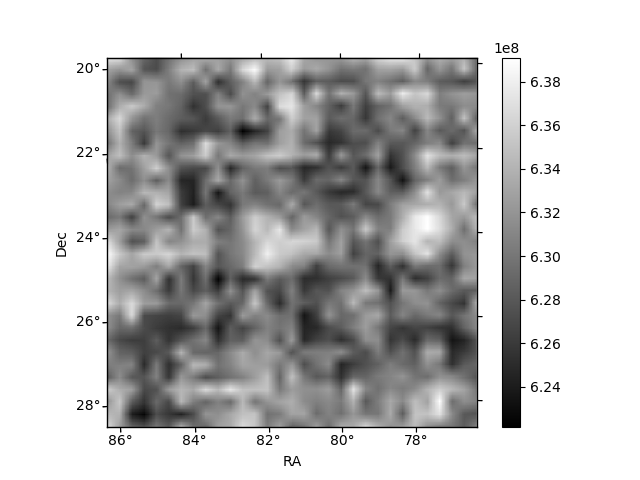
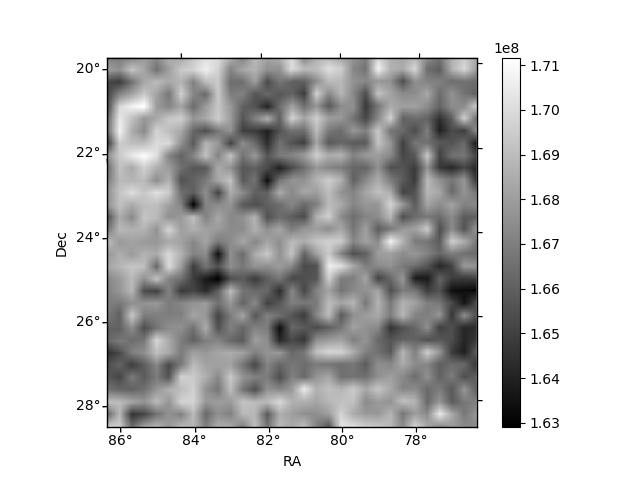
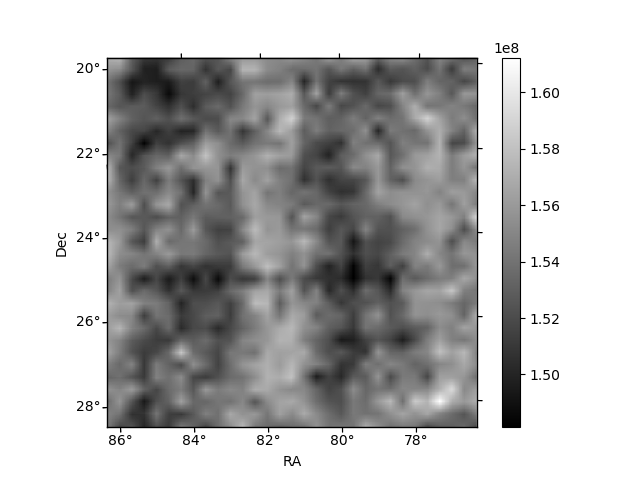
Histogram calculated using DETX and DETY for each event in the final _common_clean file
| Quadrant A | 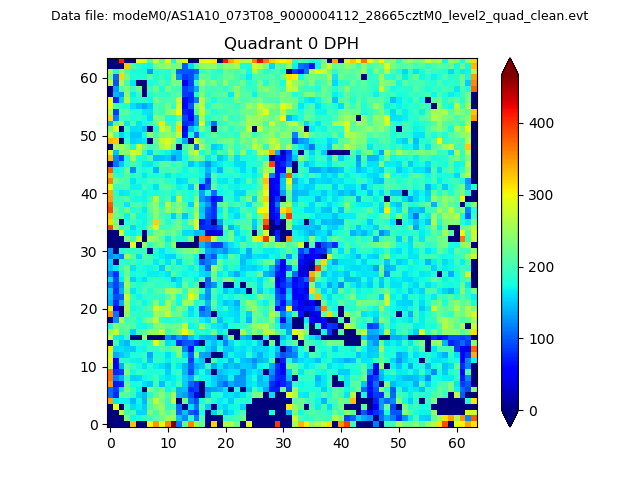 |
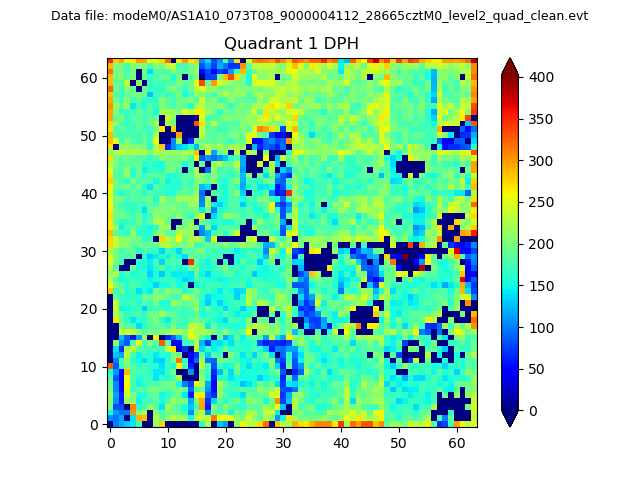 |
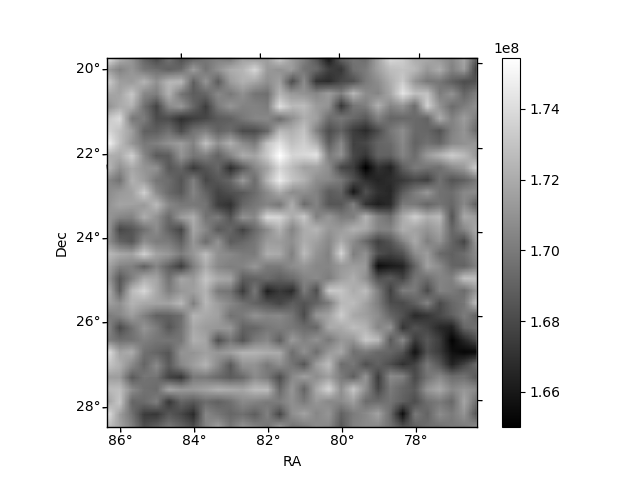
Quadrant B |
|---|---|---|---|
| Quadrant D | 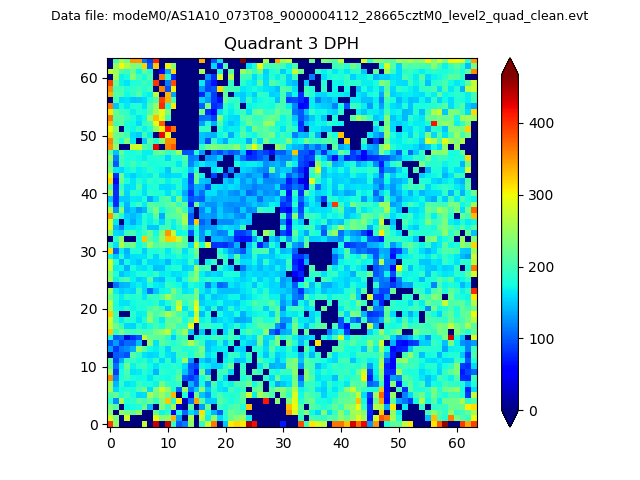 |
 |
Quadrant C |
| Plot type | Count rate plots | Images |
|---|---|---|
| Comparison with Poisson distribution Blue bars denote a histogram of data divided into 1 sec bins. Red curve is a Poisson curve with rate = median count rate of data. |
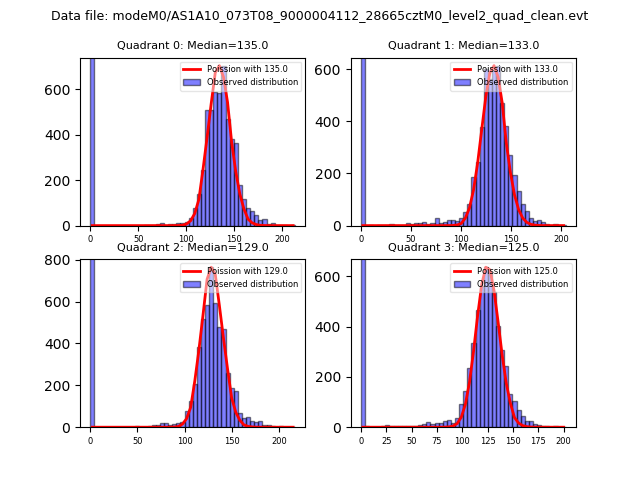 |
 |
| Quadrant-wise count rates Data is divided into 100 sec bins |
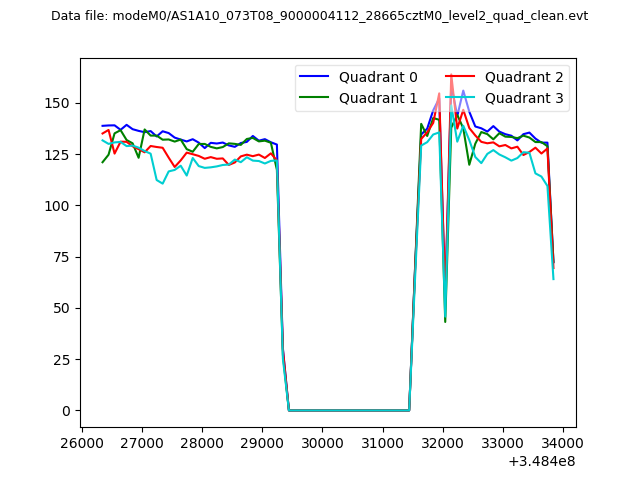 |
|
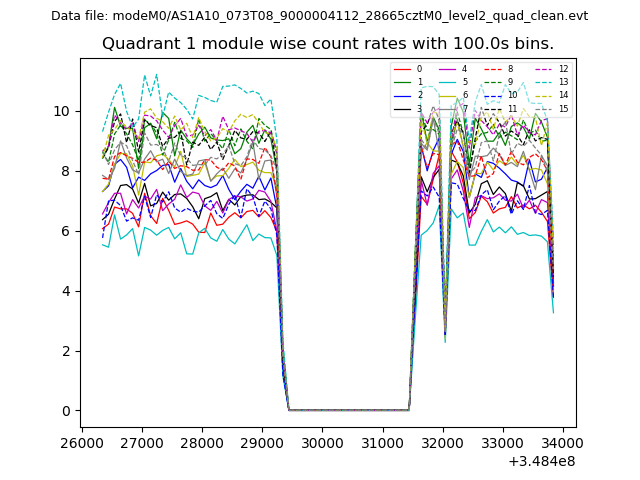
| Module-wise count rates for Quadrant A Data is divided into 100 sec bins |
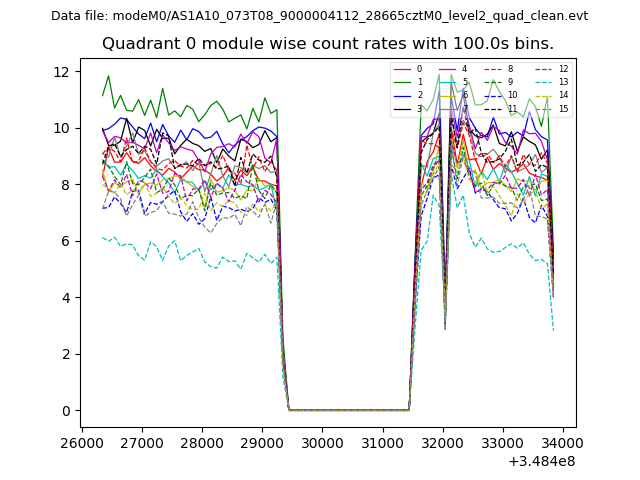 |
 |
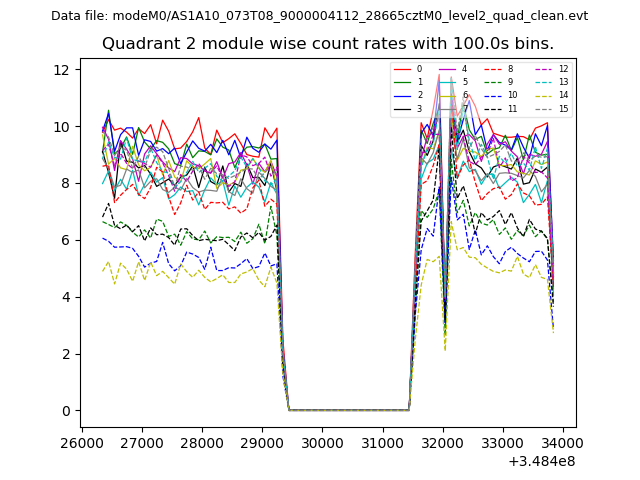
| Module-wise count rates for Quadrant B Data is divided into 100 sec bins |
 |
 |
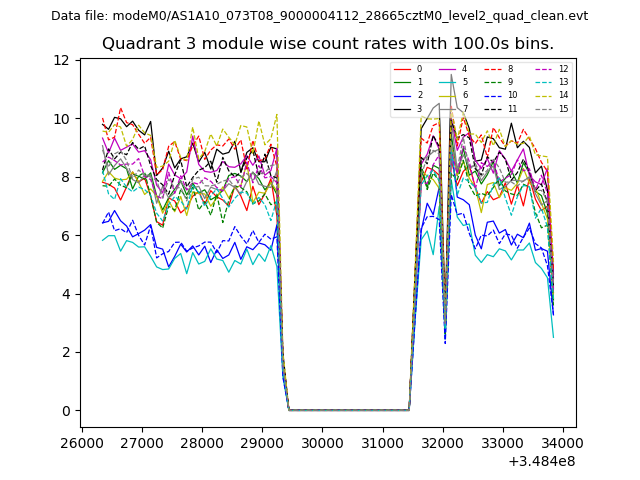
| Module-wise count rates for Quadrant C Data is divided into 100 sec bins |
 |
 |
| Module-wise count rates for Quadrant D Data is divided into 100 sec bins |
 |
 |
| Parameter | Plot |
|---|---|
| CZT HV Monitor | 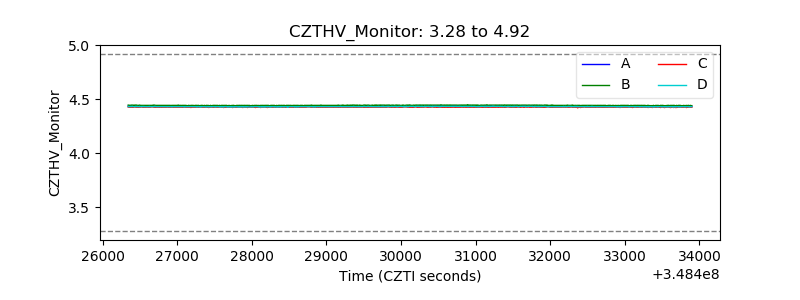 |
| D_VDD | 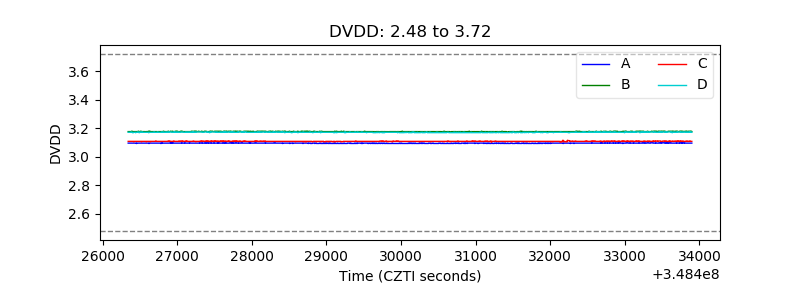 |
| Temperature 1 | 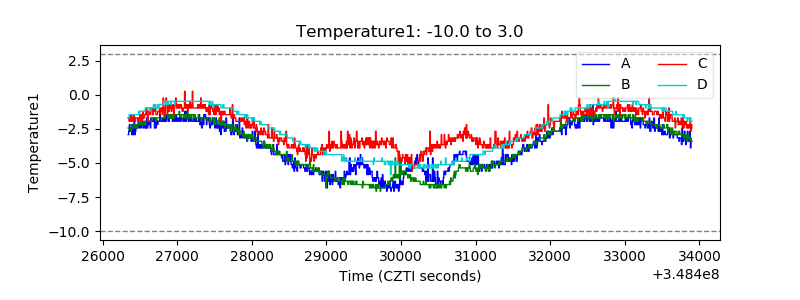 |
| Veto HV Monitor | 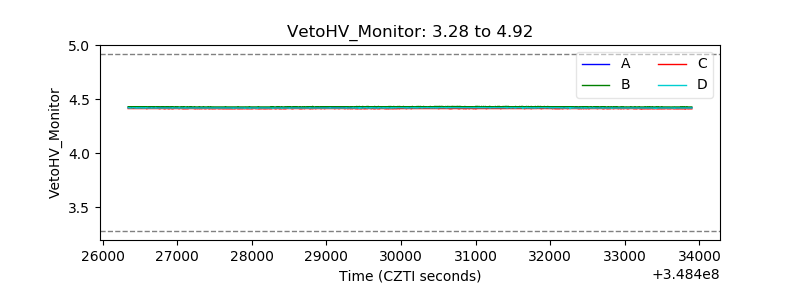 |
| Veto LLD | 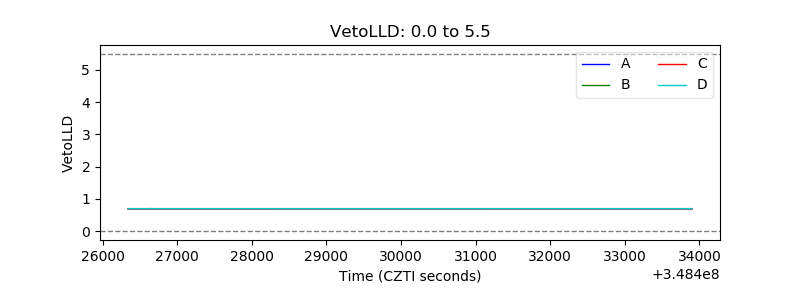 |
| Alpha Counter | 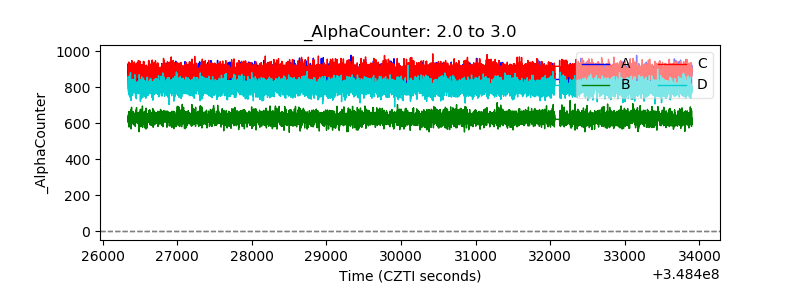 |
| _CPM_Rate | 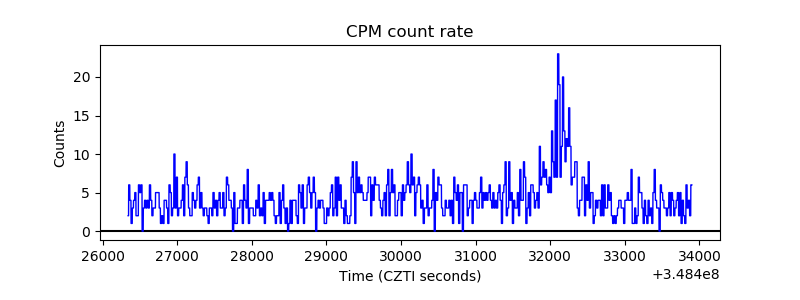 |
| CZT Counter | 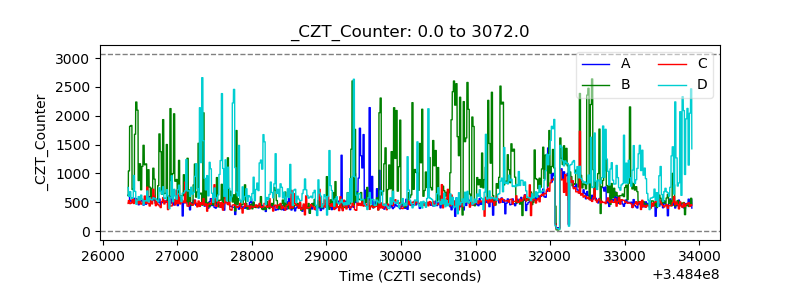 |
| +2.5 Volts monitor |  |
| +5 Volts monitor |  |
| _ROLL_ROT | 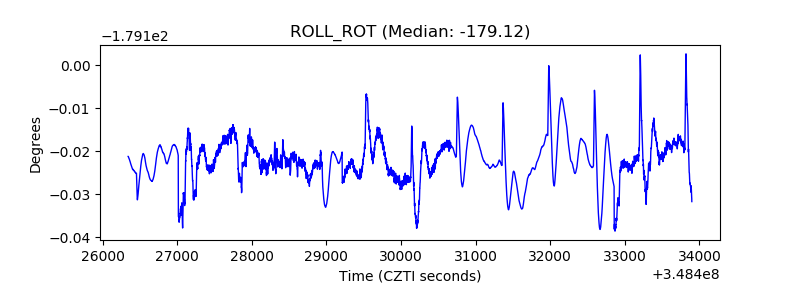 |
| _Roll_DEC | 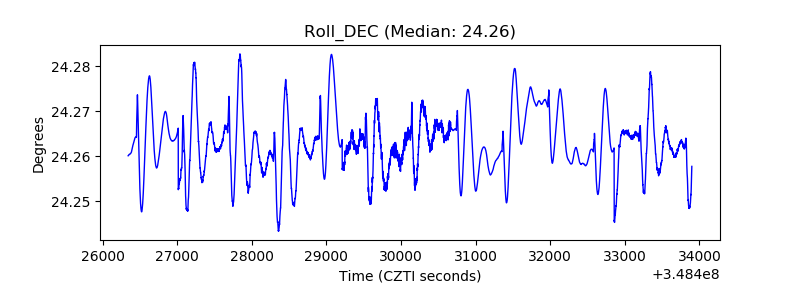 |
| _Roll_RA | 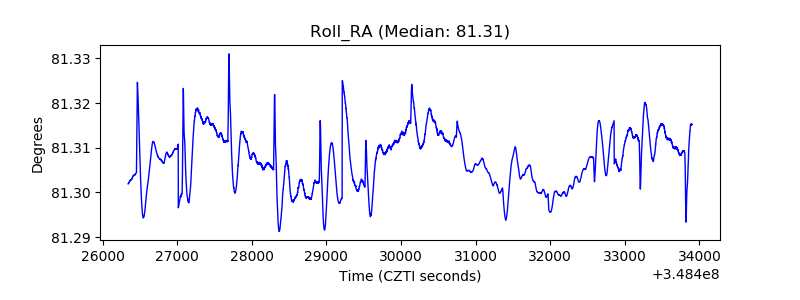 |
| Veto Counter | 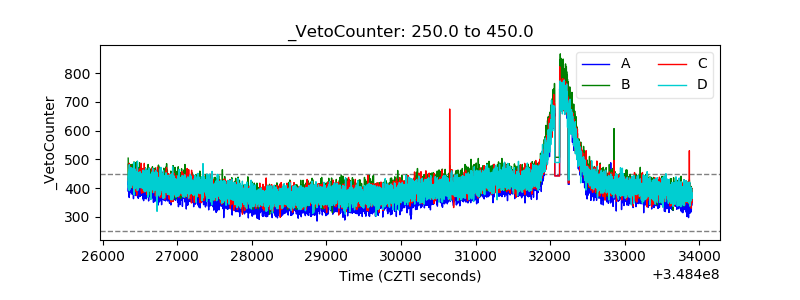 |