| Param | Original file | Final file |
|---|---|---|
| Filename | modeM0/AS1A10_073T08_9000004112_28669cztM0_level2.evt | modeM0/AS1A10_073T08_9000004112_28669cztM0_level2_quad_clean.evt |
| Size (bytes) | 636,249,600 | 106,024,320 |
| Size | 606.8 MB | 101.1 MB |
| Events in quadrant A | 3,696,514 | 699,987 |
| Events in quadrant B | 5,509,173 | 686,710 |
| Events in quadrant C | 3,656,986 | 670,607 |
| Events in quadrant D | 5,904,808 | 637,911 |
| Mode M0 | |||
|---|---|---|---|
| Quadrant | BADHDUFLAG | Total packets | Discarded packets |
| A | 0 | 15785 | 2 |
| B | 0 | 21383 | 2 |
| C | 0 | 15569 | 2 |
| D | 0 | 22504 | 2 |
| Mode SS | |||
|---|---|---|---|
| Quadrant | BADHDUFLAG | Total packets | Discarded packets |
| A | 0 | 150 | 0 |
| B | 0 | 150 | 0 |
| C | 0 | 150 | 0 |
| D | 0 | 150 | 0 |
| Mode M9 | |||
|---|---|---|---|
| Quadrant | BADHDUFLAG | Total packets | Discarded packets |
| A | 0 | 4 | 0 |
| B | 0 | 4 | 0 |
| C | 0 | 4 | 0 |
| D | 0 | 4 | 0 |
| Quadrant | Total seconds | Saturated seconds | Saturation percentage |
|---|---|---|---|
| A | 7407 | 96 | 1.296071% |
| B | 7408 | 482 | 6.506479% |
| C | 7408 | 109 | 1.471382% |
| D | 7408 | 344 | 4.643629% |
Noise dominated data is calculated using 1-second bins in cleaned event files. If a bin has >2000 counts, and if more than 50% of those come from <1% of pixels, then it is considered to be noise-dominated and hence unusable.
| Quadrant | # 1 sec bins | Bins with >0 counts | Bins with >2000 counts | High rate bins dominated by noise | Noise dominated (total time) | Noise dominated (detector-on time) | Marked lightcurve |
|---|---|---|---|---|---|---|---|
| A | 7772 | 7408 | 13 | 13 | 0.17% | 0.18% | 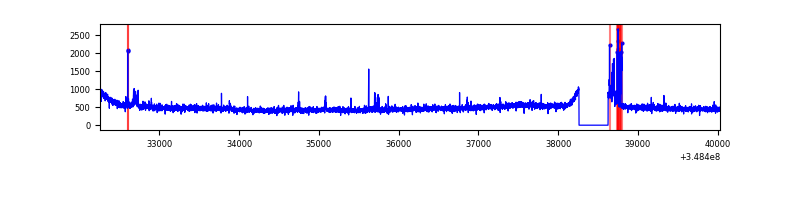 |
| B | 7773 | 7408 | 227 | 227 | 2.92% | 3.06% | 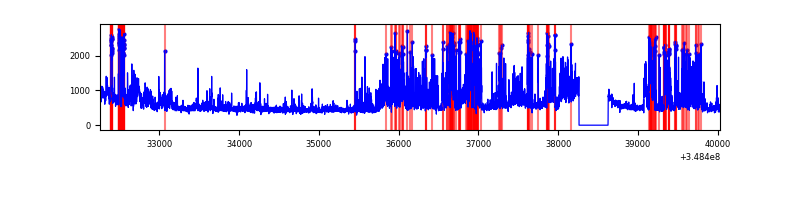 |
| C | 7773 | 7408 | 19 | 19 | 0.24% | 0.26% | 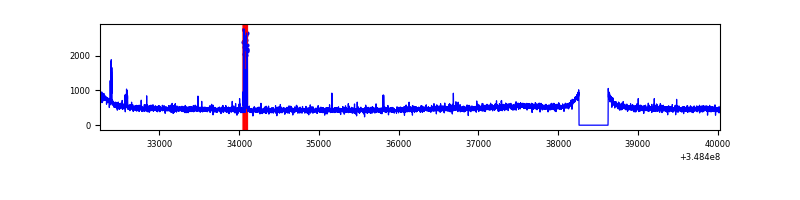 |
| D | 7773 | 7409 | 271 | 271 | 3.49% | 3.66% | 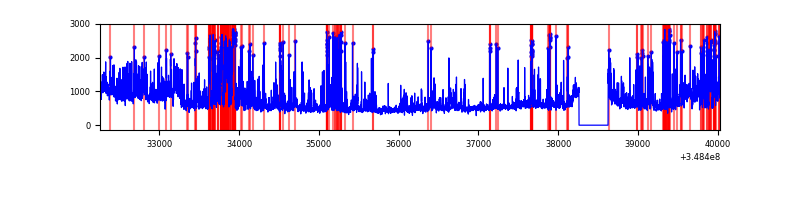 |
Top three noisy pixels from each quadrant. If the there are fewer than three noisy pixels in the level2.evt file, extra rows are filled as -1
| Pixel properties | Quadrant properties | ||||||
|---|---|---|---|---|---|---|---|
| Quadrant | DetID | PixID | Counts | Sigma | Mean | Median | Sigma |
| A | 15 | 174 | 142242 | 756.28 | 920 | 901 | 186.9 |
| A | 13 | 254 | 13522 | 67.53 | 920 | 901 | 186.9 |
| A | 3 | 137 | 8869 | 42.63 | 920 | 901 | 186.9 |
| B | 10 | 245 | 1962046 | 11385.38 | 894 | 872 | 172.3 |
| B | 12 | 111 | 21193 | 117.97 | 894 | 872 | 172.3 |
| B | 11 | 111 | 19020 | 105.35 | 894 | 872 | 172.3 |
| C | 14 | 238 | 148609 | 716.97 | 873 | 879 | 206.0 |
| C | 2 | 16 | 84179 | 404.28 | 873 | 879 | 206.0 |
| C | 14 | 254 | 13812 | 62.77 | 873 | 879 | 206.0 |
| D | 1 | 52 | 1278655 | 6057.34 | 875 | 852 | 211.0 |
| D | 8 | 195 | 880754 | 4171.12 | 875 | 852 | 211.0 |
| D | 13 | 104 | 294544 | 1392.23 | 875 | 852 | 211.0 |
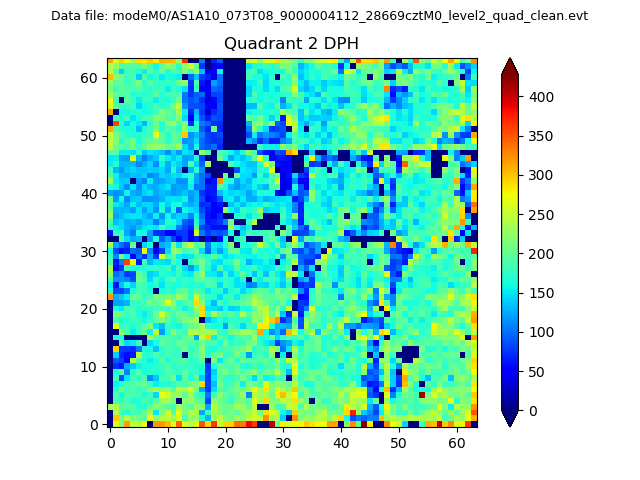
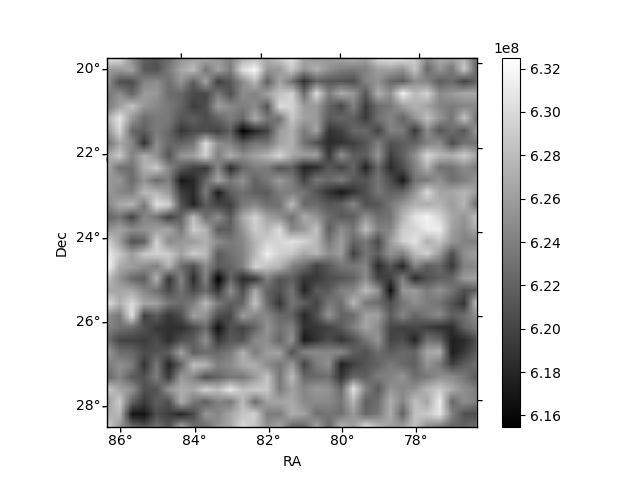
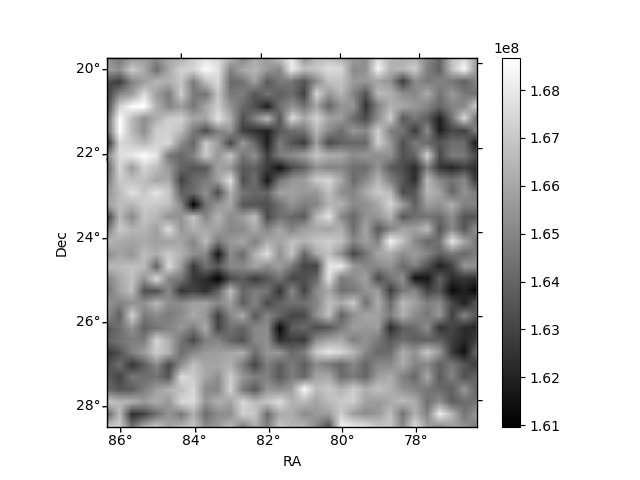
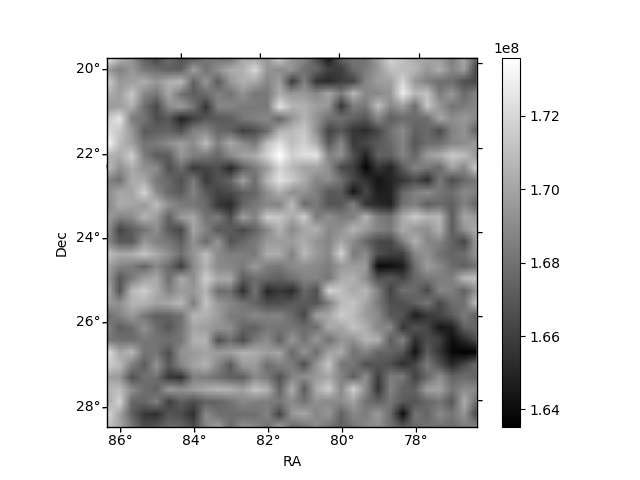
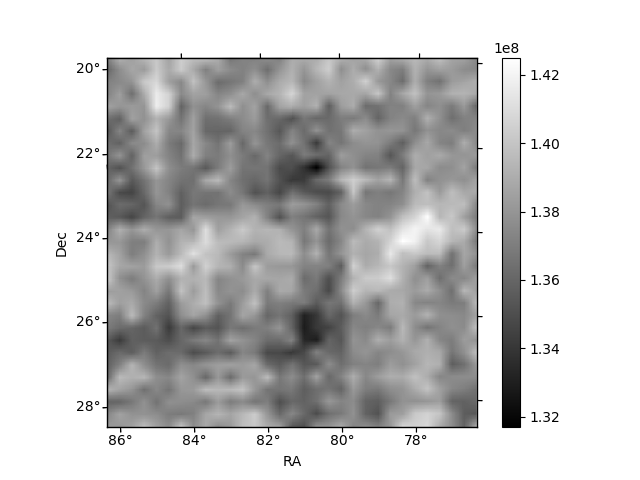
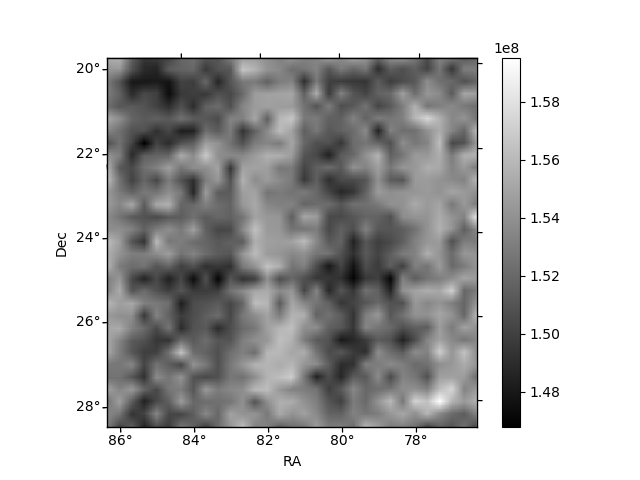
Histogram calculated using DETX and DETY for each event in the final _common_clean file
| Quadrant A | 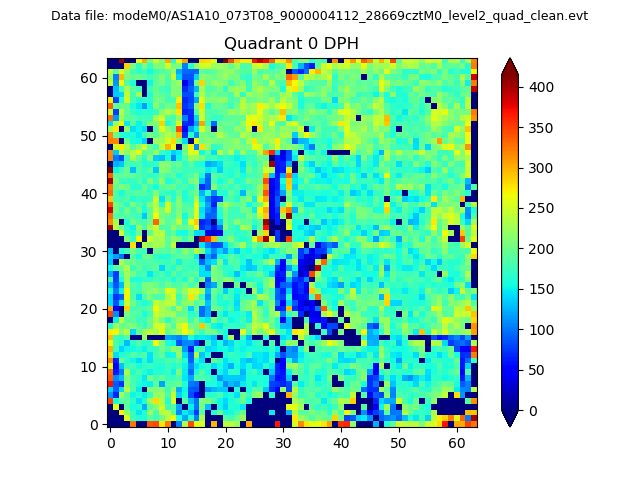 |
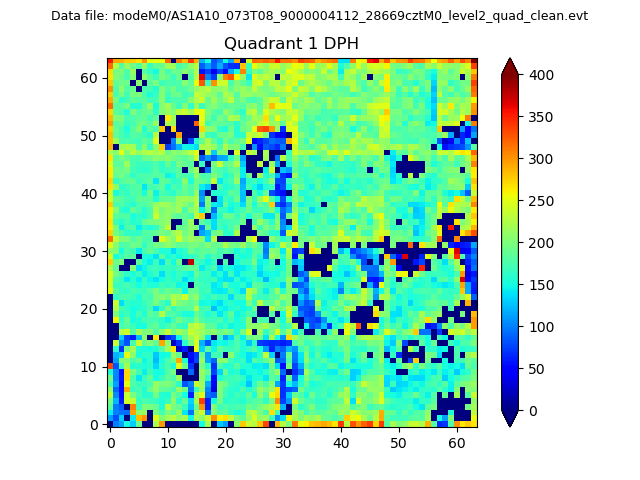 |
Quadrant B |
|---|---|---|---|
| Quadrant D | 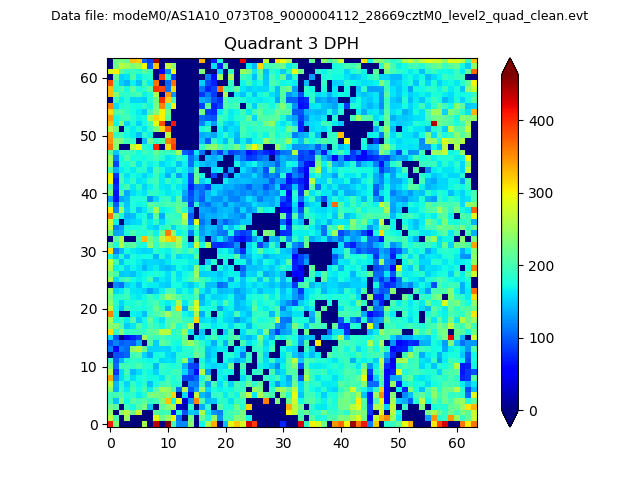 |
 |
Quadrant C |
| Plot type | Count rate plots | Images |
|---|---|---|
| Comparison with Poisson distribution Blue bars denote a histogram of data divided into 1 sec bins. Red curve is a Poisson curve with rate = median count rate of data. |
 |
 |
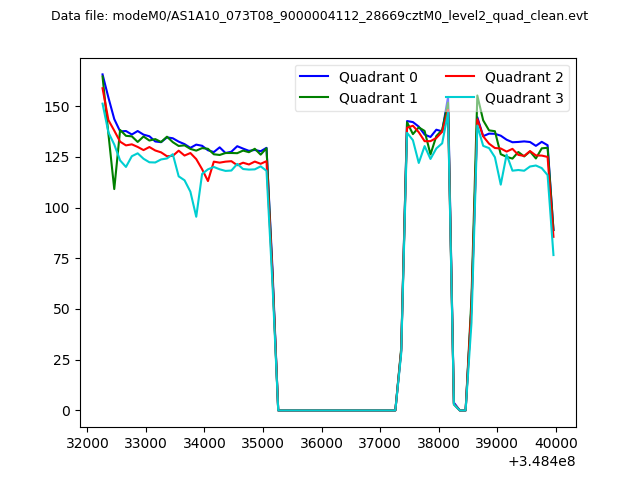
| Quadrant-wise count rates Data is divided into 100 sec bins |
 |
|
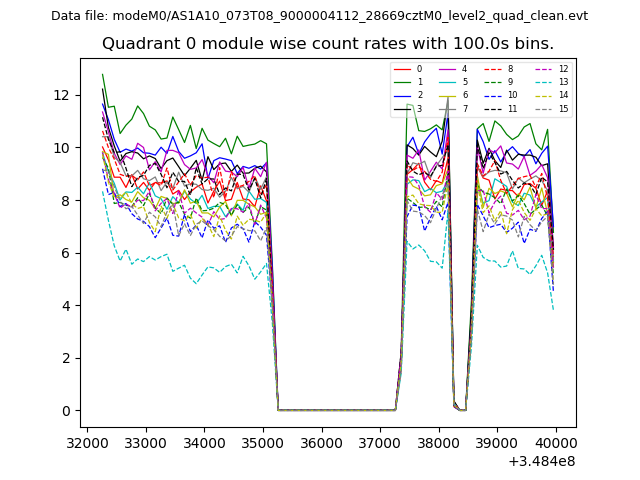
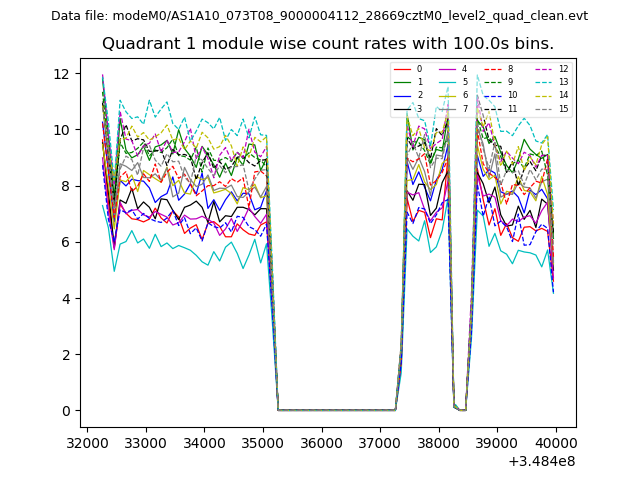
| Module-wise count rates for Quadrant A Data is divided into 100 sec bins |
 |
 |
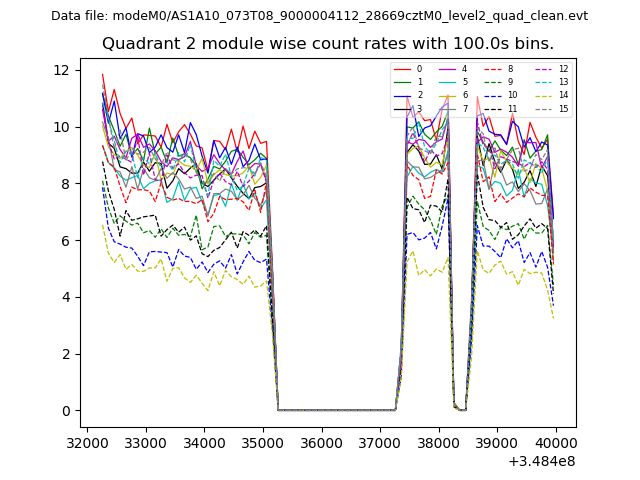
| Module-wise count rates for Quadrant B Data is divided into 100 sec bins |
 |
 |
| Module-wise count rates for Quadrant C Data is divided into 100 sec bins |
 |
 |
| Module-wise count rates for Quadrant D Data is divided into 100 sec bins |
 |
 |
| Parameter | Plot |
|---|---|
| CZT HV Monitor | 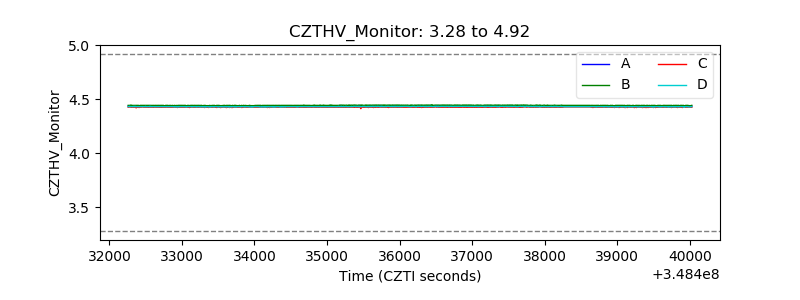 |
| D_VDD | 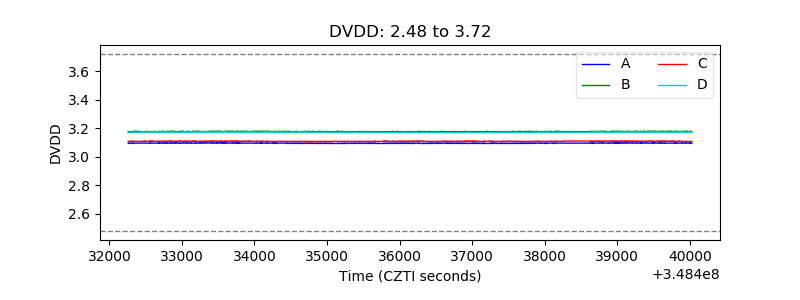 |
| Temperature 1 | 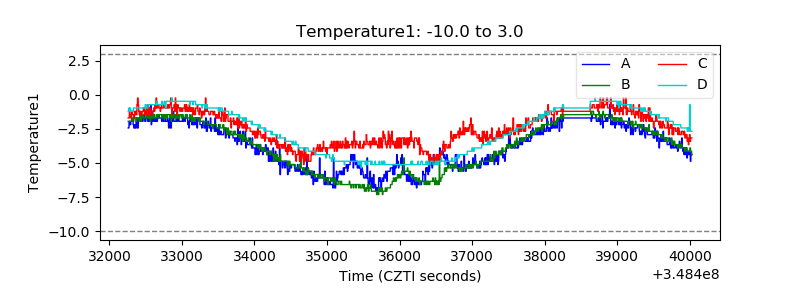 |
| Veto HV Monitor | 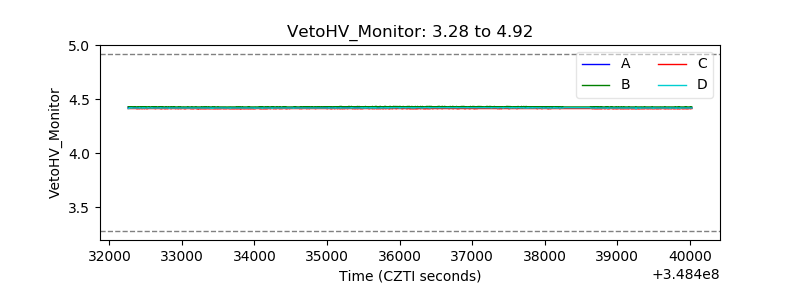 |
| Veto LLD | 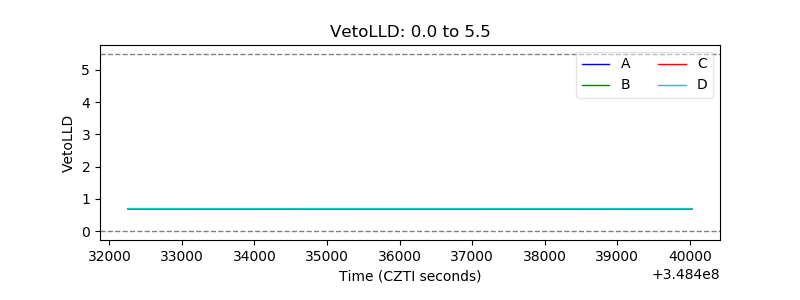 |
| Alpha Counter | 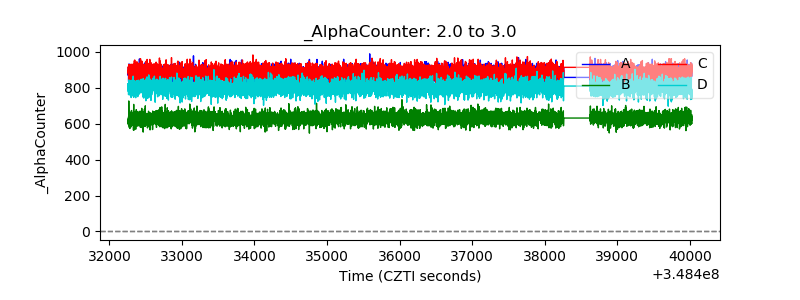 |
| _CPM_Rate | 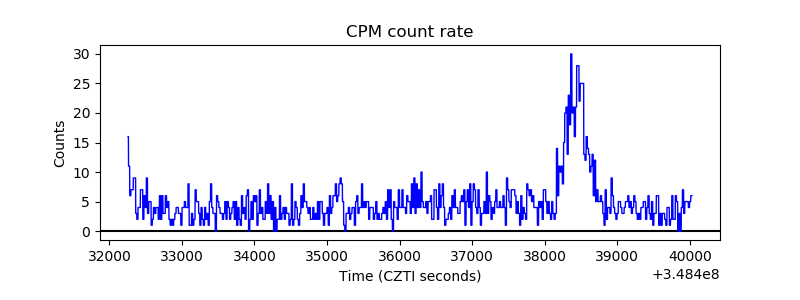 |
| CZT Counter | 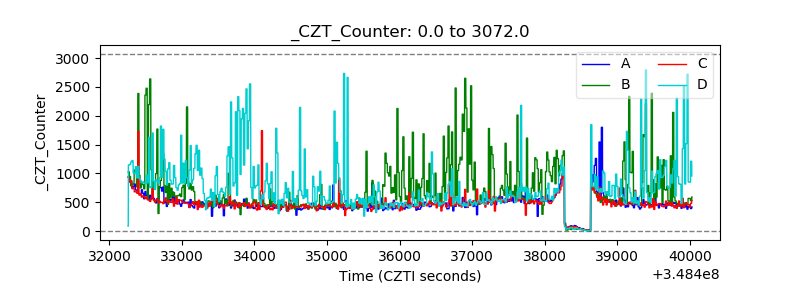 |
| +2.5 Volts monitor | 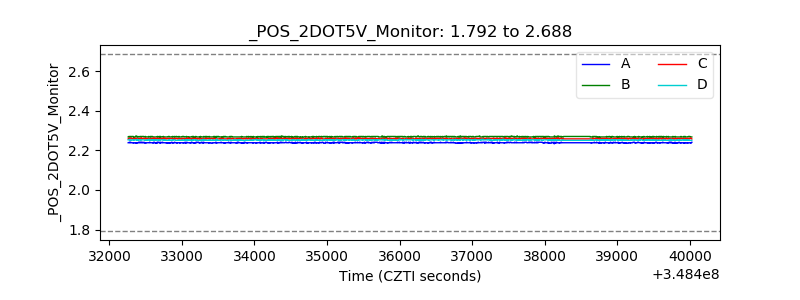 |
| +5 Volts monitor |  |
| _ROLL_ROT |  |
| _Roll_DEC |  |
| _Roll_RA | 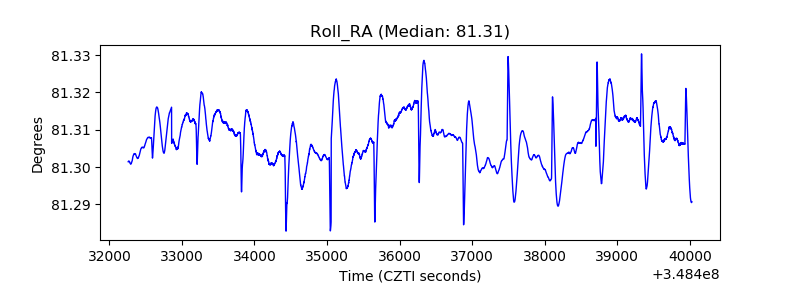 |
| Veto Counter | 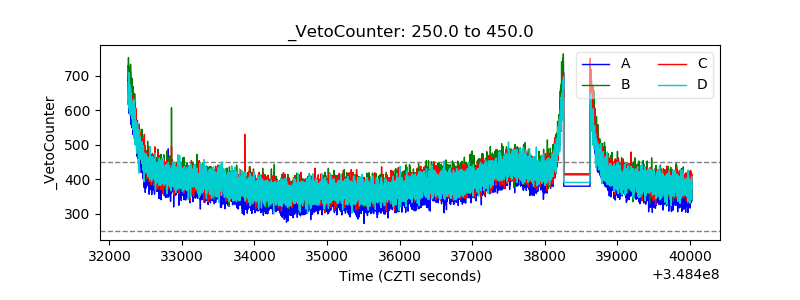 |