| Param | Original file | Final file |
|---|---|---|
| Filename | modeM0/AS1A10_110T03_9000004114cztM0_level2.fits | modeM0/AS1A10_110T03_9000004114cztM0_level2_quad_clean.evt |
| Size (bytes) | 756,069,120 | 568,635,840 |
| Size | 721.0 MB | 542.3 MB |
| Events in quadrant A | 4,776,044 | 3,202,280 |
| Events in quadrant B | 4,507,734 | 3,194,657 |
| Events in quadrant C | 4,611,602 | 3,044,527 |
| Events in quadrant D | 3,891,362 | 2,669,736 |
| Mode M9 | |||
|---|---|---|---|
| Quadrant | BADHDUFLAG | Total packets | Discarded packets |
| A | 0 | 119 | 0 |
| B | 0 | 119 | 0 |
| C | 0 | 119 | 0 |
| D | 0 | 119 | 0 |
| Mode M0 | |||
|---|---|---|---|
| Quadrant | BADHDUFLAG | Total packets | Discarded packets |
| A | 0 | 156231 | 0 |
| B | 0 | 172291 | 0 |
| C | 0 | 163043 | 0 |
| D | 0 | 261755 | 0 |
| Mode SS | |||
|---|---|---|---|
| Quadrant | BADHDUFLAG | Total packets | Discarded packets |
| A | 0 | 1516 | 0 |
| B | 0 | 1516 | 0 |
| C | 0 | 1516 | 0 |
| D | 0 | 1516 | 0 |
| Quadrant | Total seconds | Saturated seconds | Saturation percentage |
|---|---|---|---|
| A | 74493 | 860 | 1.154471% |
| B | 74493 | 2146 | 2.880808% |
| C | 74493 | 2270 | 3.047266% |
| D | 74493 | 7705 | 10.343254% |
Noise dominated data is calculated using 1-second bins in cleaned event files. If a bin has >2000 counts, and if more than 50% of those come from <1% of pixels, then it is considered to be noise-dominated and hence unusable.
| Quadrant | # 1 sec bins | Bins with >0 counts | Bins with >2000 counts | High rate bins dominated by noise | Noise dominated (total time) | Noise dominated (detector-on time) | Marked lightcurve |
|---|---|---|---|---|---|---|---|
| A | 86257 | 74479 | 0 | 0 | 0.00% | 0.00% |  |
| B | 86258 | 74473 | 0 | 0 | 0.00% | 0.00% |  |
| C | 86257 | 74470 | 0 | 0 | 0.00% | 0.00% |  |
| D | 86257 | 74376 | 0 | 0 | 0.00% | 0.00% |  |
Top three noisy pixels from each quadrant. If the there are fewer than three noisy pixels in the level2.evt file, extra rows are filled as -1
| Pixel properties | Quadrant properties | ||||||
|---|---|---|---|---|---|---|---|
| Quadrant | DetID | PixID | Counts | Sigma | Mean | Median | Sigma |
| A | 0 | 29 | 4578 | 11.16 | 1245 | 1173 | 305.1 |
| A | 7 | 110 | 3746 | 8.43 | 1245 | 1173 | 305.1 |
| A | 0 | 30 | 3558 | 7.82 | 1245 | 1173 | 305.1 |
| B | 2 | 9 | 3725 | 11.07 | 1191 | 1137 | 233.8 |
| B | 2 | 8 | 3051 | 8.19 | 1191 | 1137 | 233.8 |
| B | 5 | 255 | 2986 | 7.91 | 1191 | 1137 | 233.8 |
| C | 1 | 80 | 3523 | 7.83 | 1219 | 1146 | 303.5 |
| C | 1 | 81 | 3471 | 7.66 | 1219 | 1146 | 303.5 |
| C | 3 | 126 | 3114 | 6.48 | 1219 | 1146 | 303.5 |
| D | 15 | 46 | 2914 | 6.51 | 1114 | 1020 | 291.1 |
| D | 6 | 67 | 2684 | 5.72 | 1114 | 1020 | 291.1 |
| D | 6 | 231 | 2646 | 5.59 | 1114 | 1020 | 291.1 |
Histogram calculated using DETX and DETY for each event in the final _common_clean file
| Quadrant A |  |
 |
Quadrant B |
|---|---|---|---|
| Quadrant D |  |
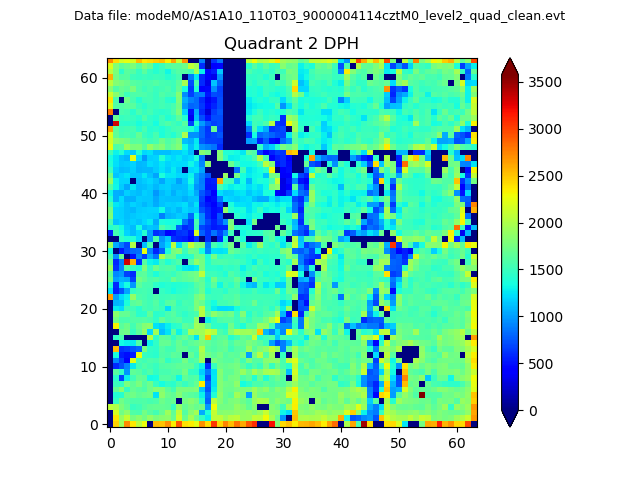 |
Quadrant C |
| Plot type | Count rate plots | Images |
|---|---|---|
| Comparison with Poisson distribution Blue bars denote a histogram of data divided into 1 sec bins. Red curve is a Poisson curve with rate = median count rate of data. |
 |
 |
| Quadrant-wise count rates Data is divided into 100 sec bins |
 |
|
| Module-wise count rates for Quadrant A Data is divided into 100 sec bins |
 |
 |
| Module-wise count rates for Quadrant B Data is divided into 100 sec bins |
 |
 |
| Module-wise count rates for Quadrant C Data is divided into 100 sec bins |
 |
 |
| Module-wise count rates for Quadrant D Data is divided into 100 sec bins |
 |
 |
| Parameter | Plot |
|---|---|
| CZT HV Monitor |  |
| D_VDD |  |
| Temperature 1 |  |
| Veto HV Monitor |  |
| Veto LLD |  |
| Alpha Counter |  |
| _CPM_Rate |  |
| CZT Counter |  |
| +2.5 Volts monitor |  |
| +5 Volts monitor |  |
| _ROLL_ROT |  |
| _Roll_DEC |  |
| _Roll_RA |  |
| Veto Counter |  |