| Param | Original file | Final file |
|---|---|---|
| Filename | modeM0/AS1A10_110T03_9000004114_28669cztM0_level2.evt | modeM0/AS1A10_110T03_9000004114_28669cztM0_level2_quad_clean.evt |
| Size (bytes) | 1,127,352,960 | 153,904,320 |
| Size | 1.0 GB | 146.8 MB |
| Events in quadrant A | 6,565,014 | 953,377 |
| Events in quadrant B | 8,293,439 | 967,221 |
| Events in quadrant C | 6,669,785 | 925,776 |
| Events in quadrant D | 11,674,632 | 853,995 |
| Mode M9 | |||
|---|---|---|---|
| Quadrant | BADHDUFLAG | Total packets | Discarded packets |
| A | 0 | 16 | 0 |
| B | 0 | 16 | 0 |
| C | 0 | 16 | 0 |
| D | 0 | 16 | 0 |
| Mode M0 | |||
|---|---|---|---|
| Quadrant | BADHDUFLAG | Total packets | Discarded packets |
| A | 0 | 28555 | 2 |
| B | 0 | 33712 | 2 |
| C | 0 | 28689 | 2 |
| D | 0 | 44504 | 2 |
| Mode SS | |||
|---|---|---|---|
| Quadrant | BADHDUFLAG | Total packets | Discarded packets |
| A | 0 | 286 | 0 |
| B | 0 | 286 | 0 |
| C | 0 | 286 | 0 |
| D | 0 | 286 | 0 |
| Quadrant | Total seconds | Saturated seconds | Saturation percentage |
|---|---|---|---|
| A | 13900 | 95 | 0.683453% |
| B | 13900 | 572 | 4.115108% |
| C | 13900 | 214 | 1.539568% |
| D | 13900 | 1023 | 7.359712% |
Noise dominated data is calculated using 1-second bins in cleaned event files. If a bin has >2000 counts, and if more than 50% of those come from <1% of pixels, then it is considered to be noise-dominated and hence unusable.
| Quadrant | # 1 sec bins | Bins with >0 counts | Bins with >2000 counts | High rate bins dominated by noise | Noise dominated (total time) | Noise dominated (detector-on time) | Marked lightcurve |
|---|---|---|---|---|---|---|---|
| A | 15114 | 13899 | 0 | 0 | 0.00% | 0.00% | 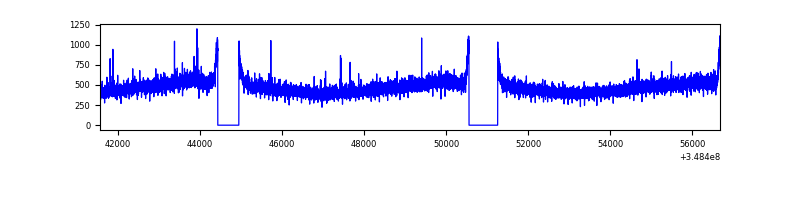 |
| B | 15114 | 13899 | 138 | 138 | 0.91% | 0.99% | 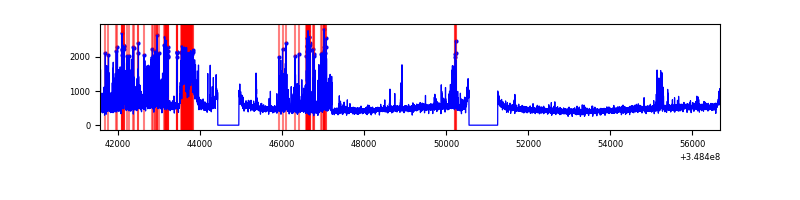 |
| C | 15114 | 13899 | 0 | 0 | 0.00% | 0.00% | 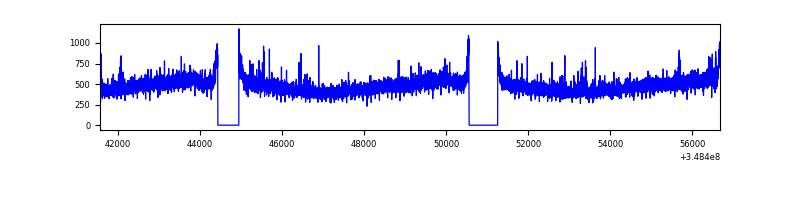 |
| D | 15114 | 13899 | 836 | 836 | 5.53% | 6.01% | 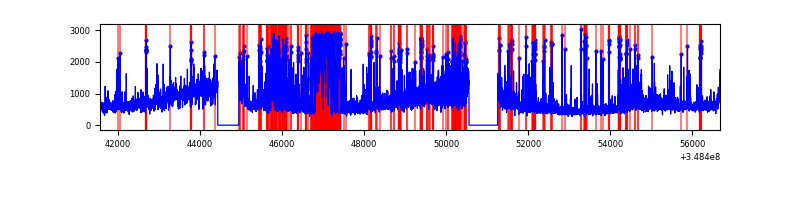 |
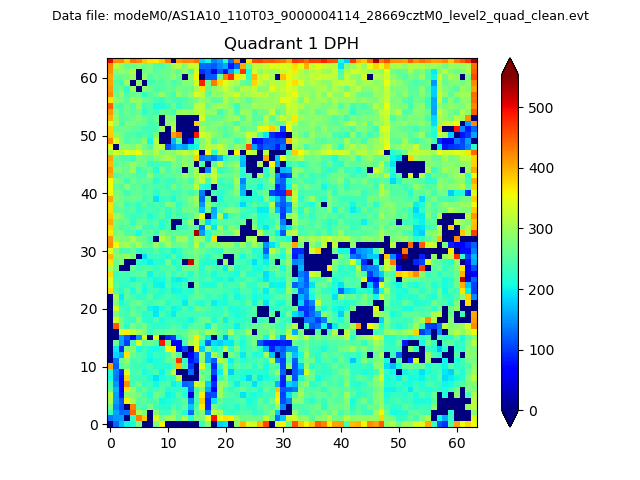
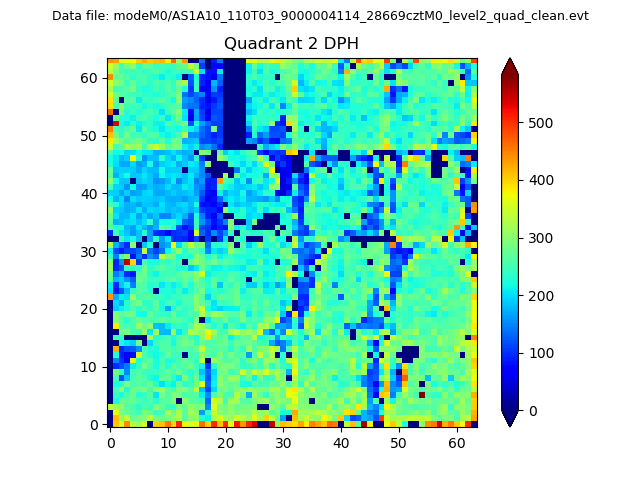
Top three noisy pixels from each quadrant. If the there are fewer than three noisy pixels in the level2.evt file, extra rows are filled as -1
| Pixel properties | Quadrant properties | ||||||
|---|---|---|---|---|---|---|---|
| Quadrant | DetID | PixID | Counts | Sigma | Mean | Median | Sigma |
| A | 13 | 254 | 23698 | 64.36 | 1696 | 1654 | 342.5 |
| A | 3 | 137 | 16972 | 44.72 | 1696 | 1654 | 342.5 |
| A | 15 | 174 | 16431 | 43.14 | 1696 | 1654 | 342.5 |
| B | 10 | 245 | 1307881 | 4081.01 | 1663 | 1622 | 320.1 |
| B | 15 | 33 | 405671 | 1262.33 | 1663 | 1622 | 320.1 |
| B | 12 | 111 | 40115 | 120.26 | 1663 | 1622 | 320.1 |
| C | 14 | 238 | 287846 | 755.11 | 1616 | 1626 | 379.0 |
| C | 14 | 254 | 44401 | 112.85 | 1616 | 1626 | 379.0 |
| C | 3 | 233 | 17513 | 41.91 | 1616 | 1626 | 379.0 |
| D | 1 | 52 | 4037074 | 10547.13 | 1587 | 1544 | 382.6 |
| D | 8 | 195 | 1432248 | 3739.24 | 1587 | 1544 | 382.6 |
| D | 2 | 234 | 58511 | 148.89 | 1587 | 1544 | 382.6 |
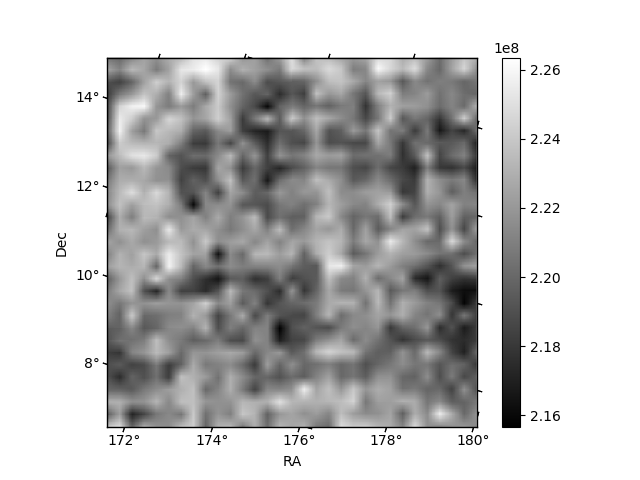
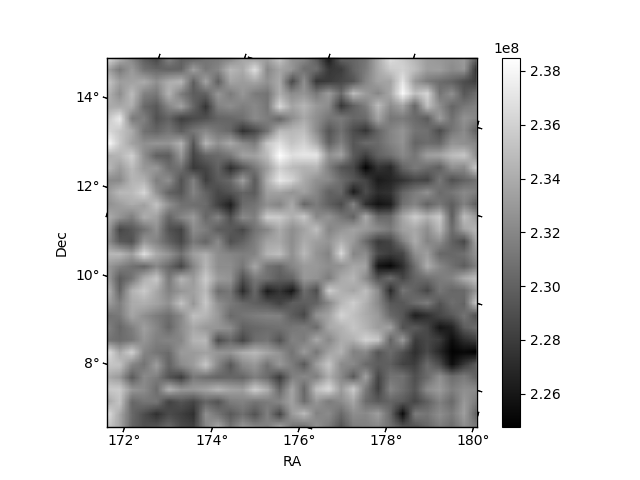
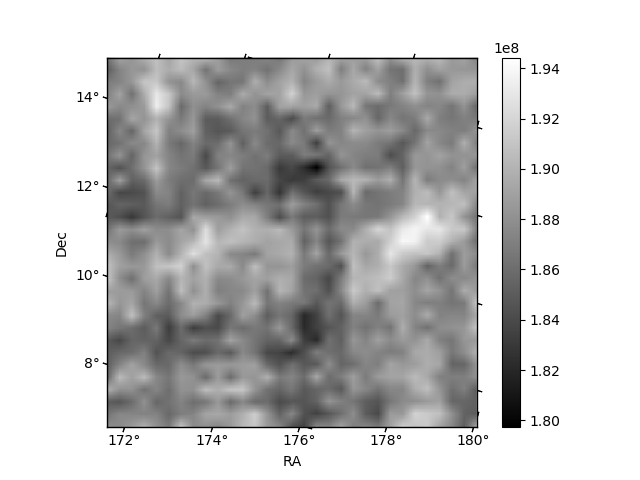
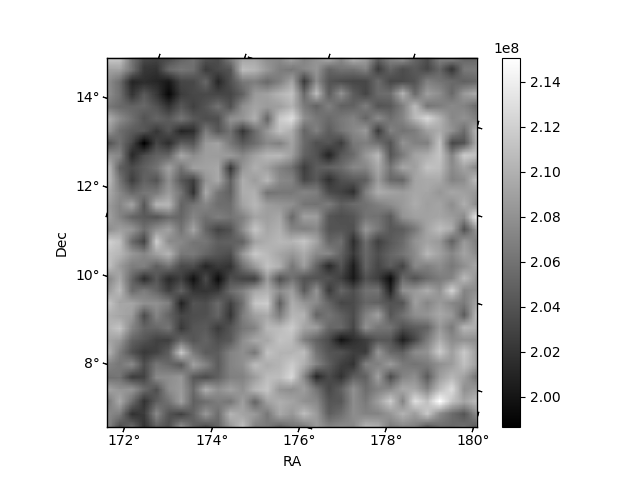
Histogram calculated using DETX and DETY for each event in the final _common_clean file
| Quadrant A | 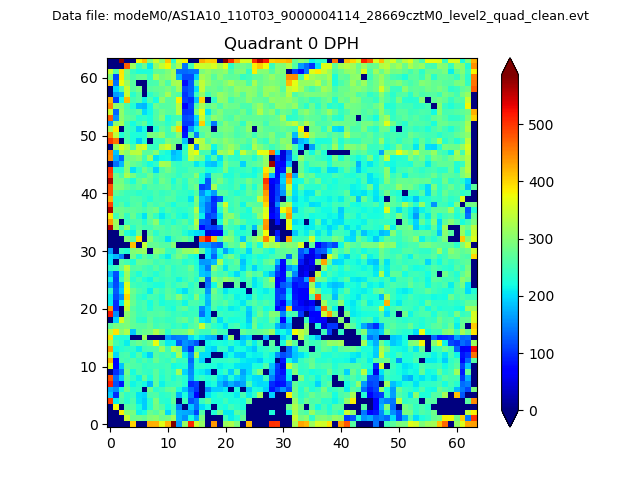 |
 |
Quadrant B |
|---|---|---|---|
| Quadrant D | 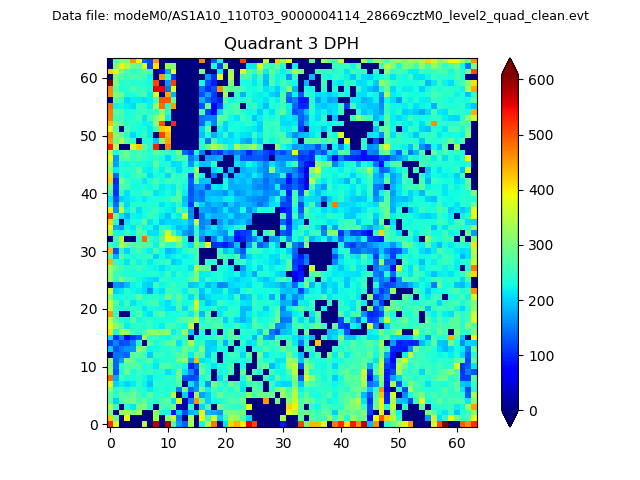 |
 |
Quadrant C |
| Plot type | Count rate plots | Images |
|---|---|---|
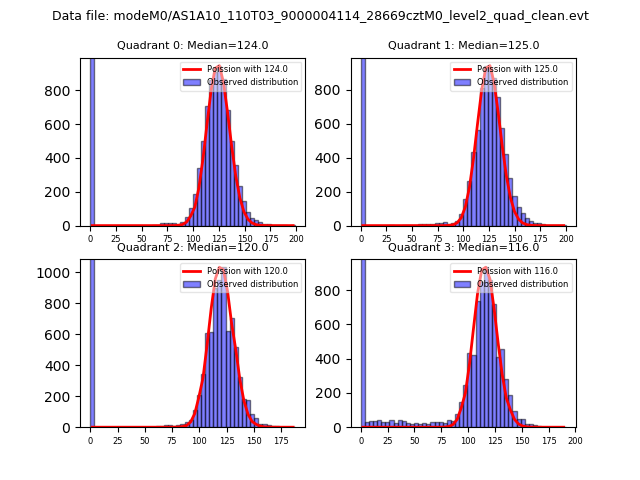
| Comparison with Poisson distribution Blue bars denote a histogram of data divided into 1 sec bins. Red curve is a Poisson curve with rate = median count rate of data. |
 |
 |
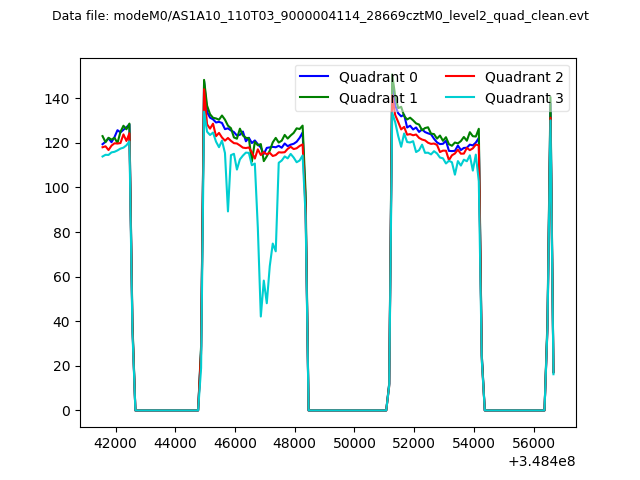
| Quadrant-wise count rates Data is divided into 100 sec bins |
 |
|
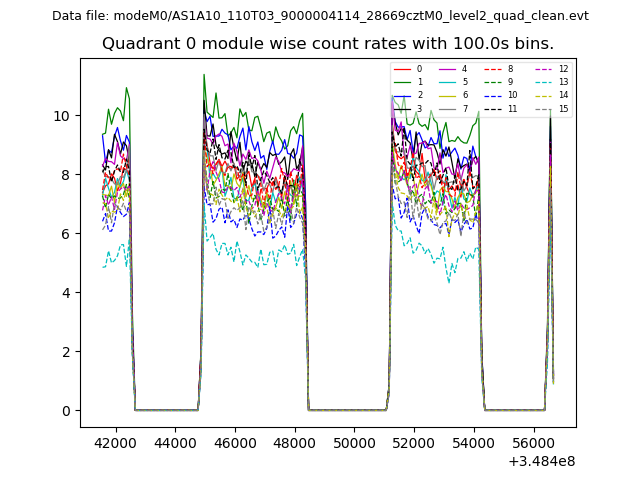
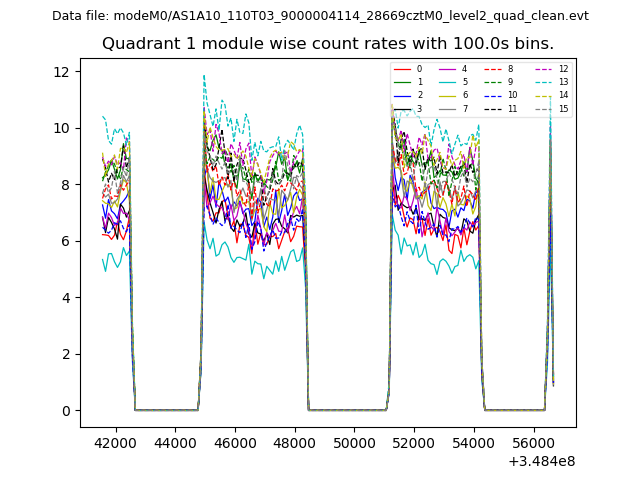
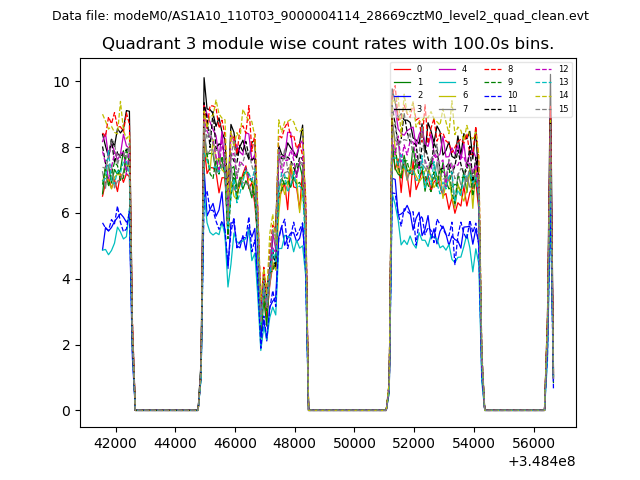
| Module-wise count rates for Quadrant A Data is divided into 100 sec bins |
 |
 |
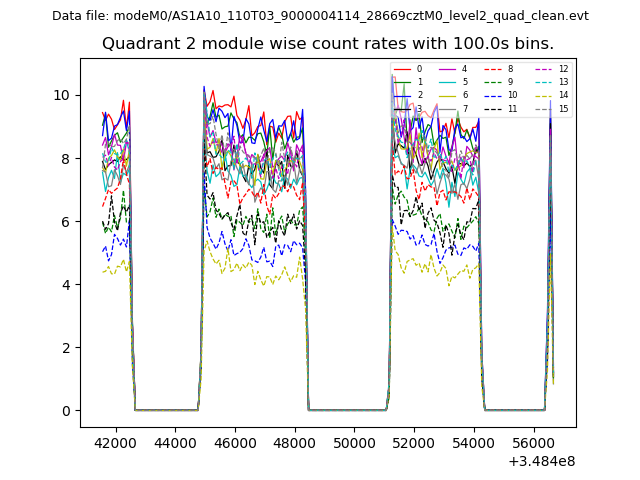
| Module-wise count rates for Quadrant B Data is divided into 100 sec bins |
 |
 |
| Module-wise count rates for Quadrant C Data is divided into 100 sec bins |
 |
 |
| Module-wise count rates for Quadrant D Data is divided into 100 sec bins |
 |
 |
| Parameter | Plot |
|---|---|
| CZT HV Monitor | 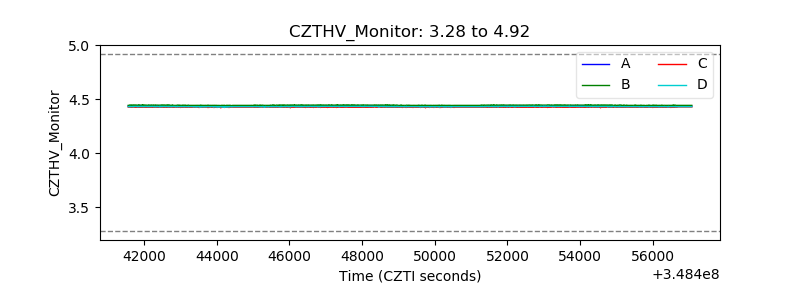 |
| D_VDD | 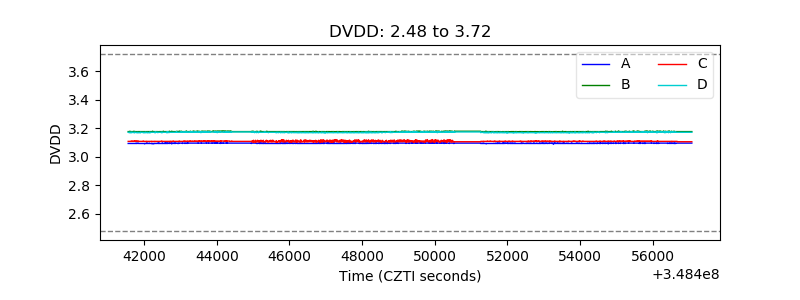 |
| Temperature 1 | 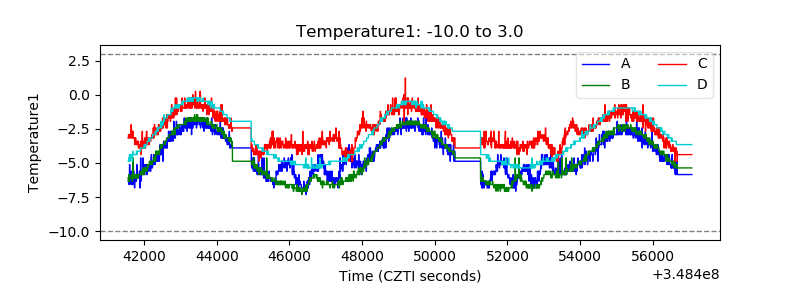 |
| Veto HV Monitor | 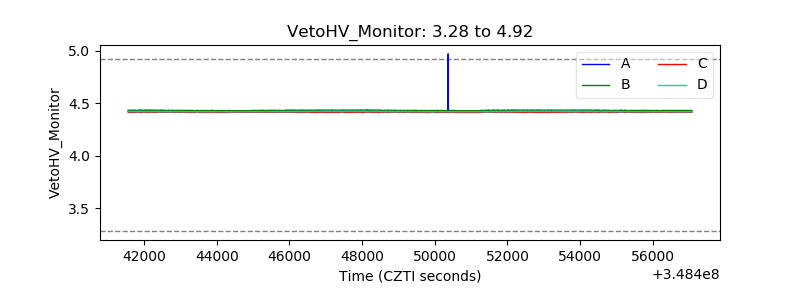 |
| Veto LLD | 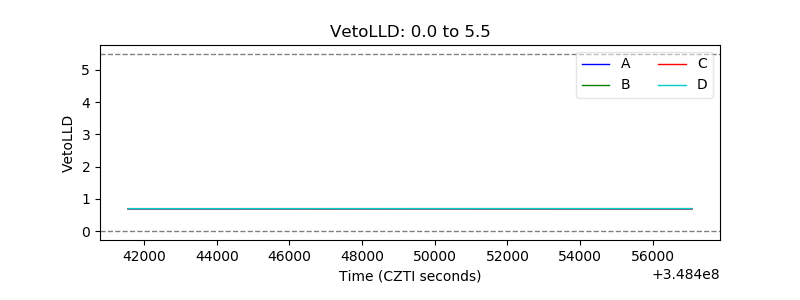 |
| Alpha Counter | 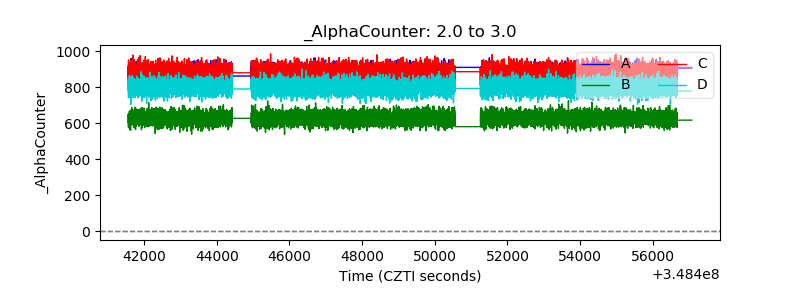 |
| _CPM_Rate | 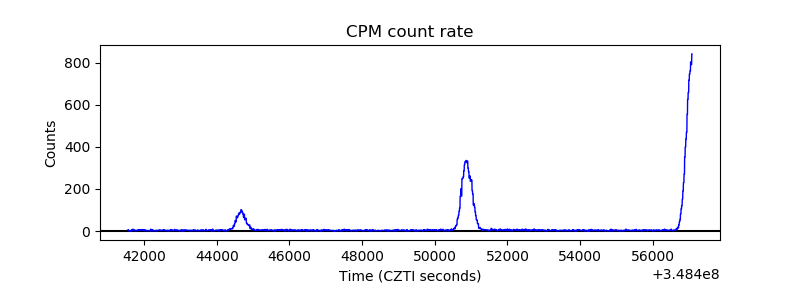 |
| CZT Counter | 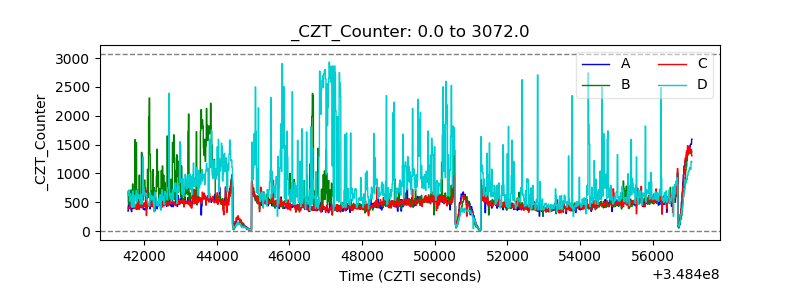 |
| +2.5 Volts monitor | 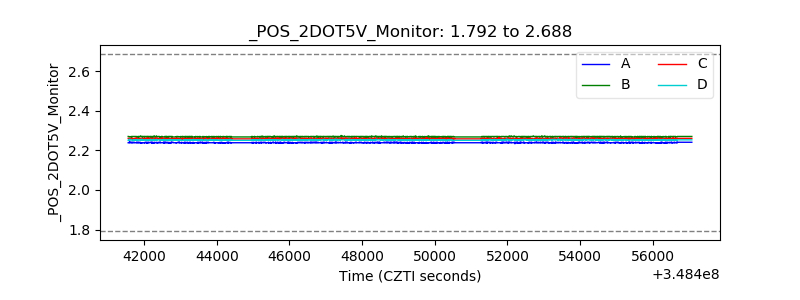 |
| +5 Volts monitor |  |
| _ROLL_ROT | 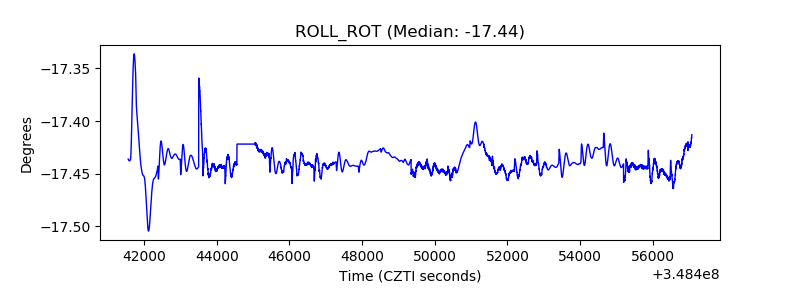 |
| _Roll_DEC | 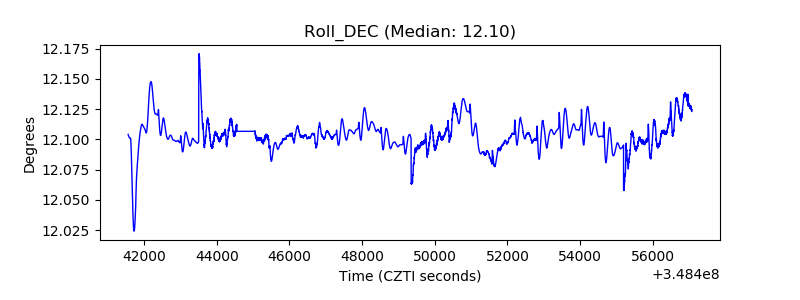 |
| _Roll_RA | 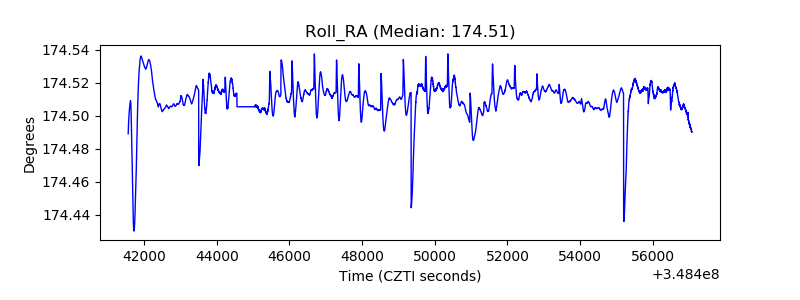 |
| Veto Counter | 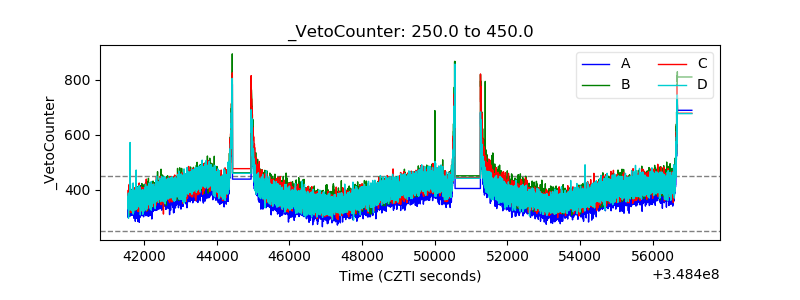 |