| Param | Original file | Final file |
|---|---|---|
| Filename | modeM0/AS1A10_110T03_9000004114_28672cztM0_level2.evt | modeM0/AS1A10_110T03_9000004114_28672cztM0_level2_quad_clean.evt |
| Size (bytes) | 513,282,240 | 89,818,560 |
| Size | 489.5 MB | 85.7 MB |
| Events in quadrant A | 3,073,260 | 586,138 |
| Events in quadrant B | 3,557,088 | 596,621 |
| Events in quadrant C | 3,177,688 | 564,370 |
| Events in quadrant D | 5,315,763 | 539,642 |
| Mode M9 | |||
|---|---|---|---|
| Quadrant | BADHDUFLAG | Total packets | Discarded packets |
| A | 0 | 11 | 0 |
| B | 0 | 11 | 0 |
| C | 0 | 11 | 0 |
| D | 0 | 11 | 0 |
| Mode M0 | |||
|---|---|---|---|
| Quadrant | BADHDUFLAG | Total packets | Discarded packets |
| A | 0 | 12802 | 1 |
| B | 0 | 14443 | 1 |
| C | 0 | 13123 | 2 |
| D | 0 | 19930 | 1 |
| Mode SS | |||
|---|---|---|---|
| Quadrant | BADHDUFLAG | Total packets | Discarded packets |
| A | 0 | 128 | 0 |
| B | 0 | 128 | 0 |
| C | 0 | 128 | 0 |
| D | 0 | 128 | 0 |
| Quadrant | Total seconds | Saturated seconds | Saturation percentage |
|---|---|---|---|
| A | 6198 | 50 | 0.806712% |
| B | 6198 | 104 | 1.677961% |
| C | 6198 | 154 | 2.484672% |
| D | 6198 | 507 | 8.180058% |
Noise dominated data is calculated using 1-second bins in cleaned event files. If a bin has >2000 counts, and if more than 50% of those come from <1% of pixels, then it is considered to be noise-dominated and hence unusable.
| Quadrant | # 1 sec bins | Bins with >0 counts | Bins with >2000 counts | High rate bins dominated by noise | Noise dominated (total time) | Noise dominated (detector-on time) | Marked lightcurve |
|---|---|---|---|---|---|---|---|
| A | 7348 | 6198 | 0 | 0 | 0.00% | 0.00% | 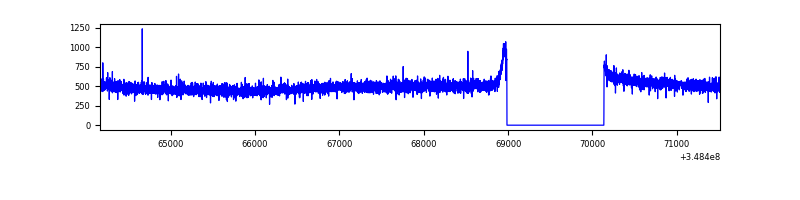 |
| B | 7348 | 6198 | 18 | 18 | 0.24% | 0.29% | 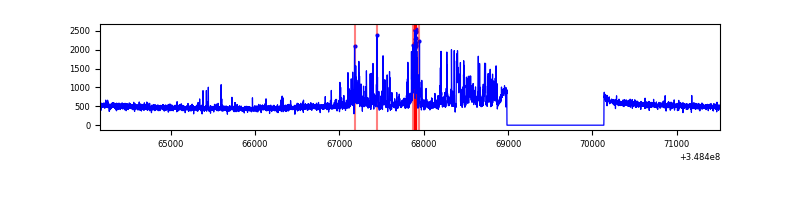 |
| C | 7348 | 6198 | 0 | 0 | 0.00% | 0.00% | 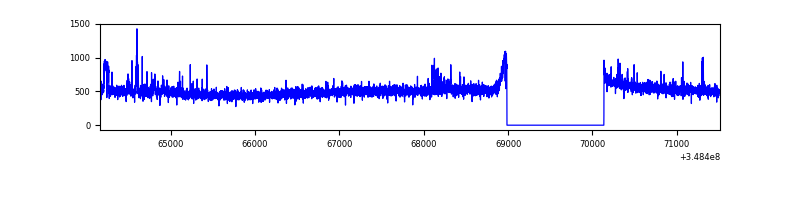 |
| D | 7348 | 6198 | 477 | 477 | 6.49% | 7.70% | 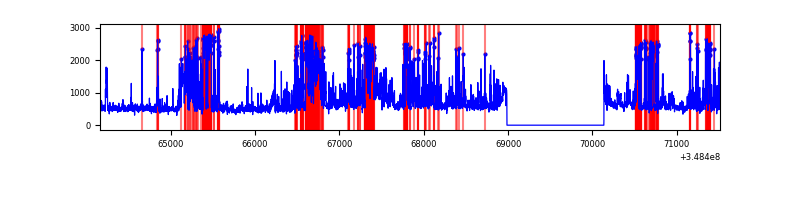 |
Top three noisy pixels from each quadrant. If the there are fewer than three noisy pixels in the level2.evt file, extra rows are filled as -1
| Pixel properties | Quadrant properties | ||||||
|---|---|---|---|---|---|---|---|
| Quadrant | DetID | PixID | Counts | Sigma | Mean | Median | Sigma |
| A | 13 | 254 | 10749 | 63.44 | 796 | 783 | 157.1 |
| A | 3 | 137 | 7523 | 42.9 | 796 | 783 | 157.1 |
| A | 0 | 226 | 6860 | 38.68 | 796 | 783 | 157.1 |
| B | 10 | 245 | 448588 | 3037.52 | 783 | 764 | 147.4 |
| B | 12 | 16 | 24840 | 163.3 | 783 | 764 | 147.4 |
| B | 12 | 111 | 18090 | 117.52 | 783 | 764 | 147.4 |
| C | 14 | 238 | 155915 | 876.32 | 755 | 760 | 177.1 |
| C | 14 | 254 | 45532 | 252.87 | 755 | 760 | 177.1 |
| C | 3 | 233 | 37174 | 205.66 | 755 | 760 | 177.1 |
| D | 1 | 52 | 2113159 | 11996.8 | 748 | 731 | 176.1 |
| D | 8 | 195 | 312214 | 1768.96 | 748 | 731 | 176.1 |
| D | 2 | 234 | 21567 | 118.33 | 748 | 731 | 176.1 |
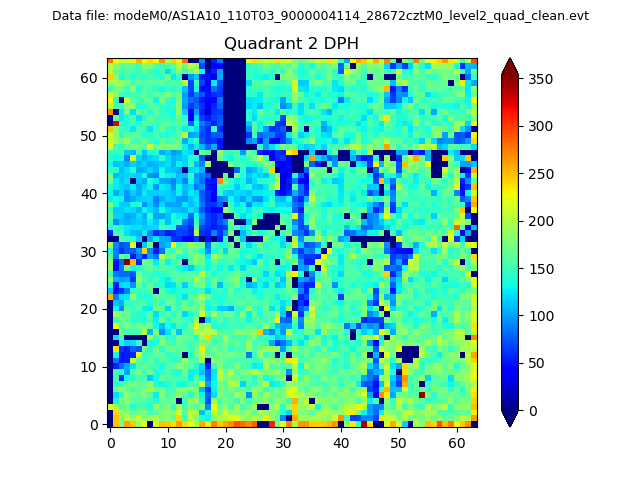
Histogram calculated using DETX and DETY for each event in the final _common_clean file
| Quadrant A | 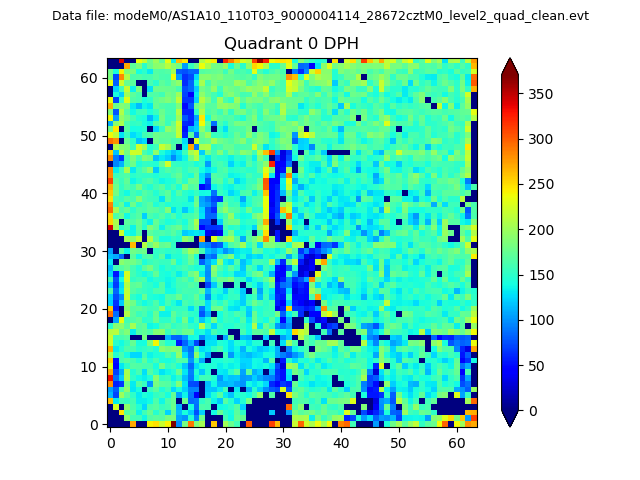 |
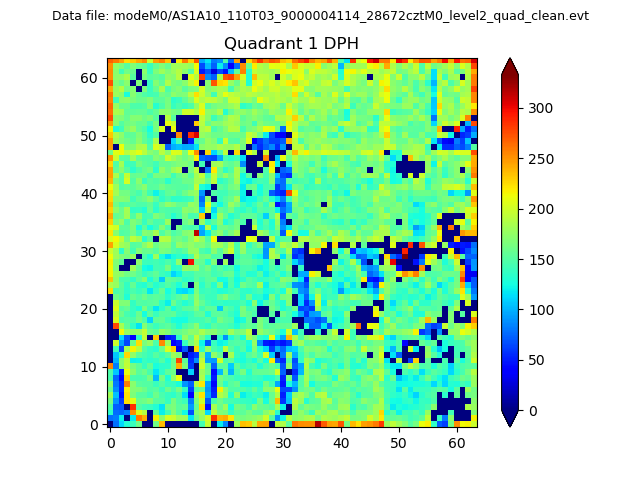 |
Quadrant B |
|---|---|---|---|
| Quadrant D | 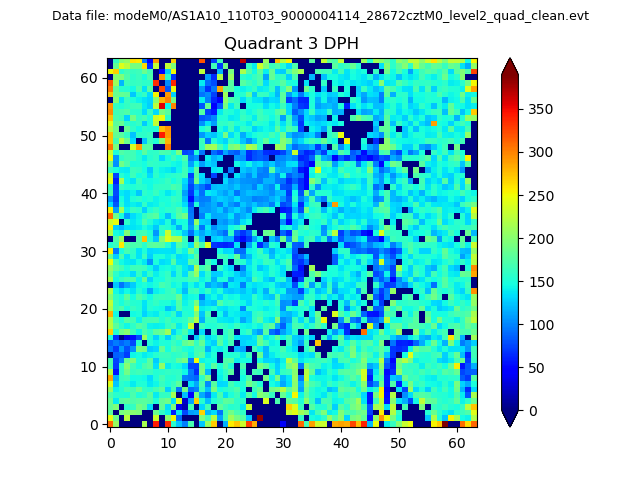 |
 |
Quadrant C |
| Plot type | Count rate plots | Images |
|---|---|---|
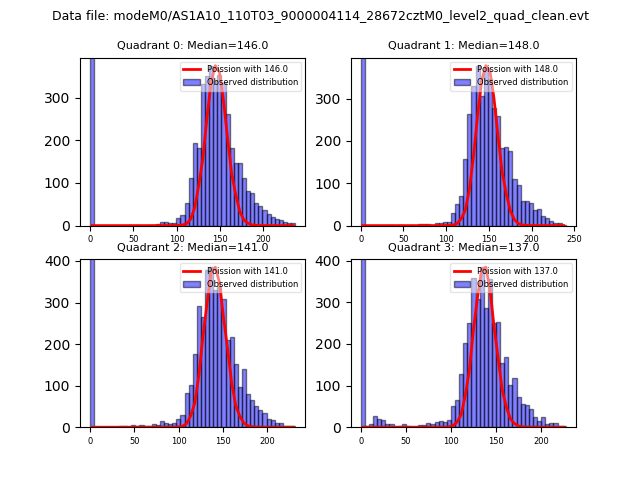
| Comparison with Poisson distribution Blue bars denote a histogram of data divided into 1 sec bins. Red curve is a Poisson curve with rate = median count rate of data. |
 |
 |
| Quadrant-wise count rates Data is divided into 100 sec bins |
 |
|
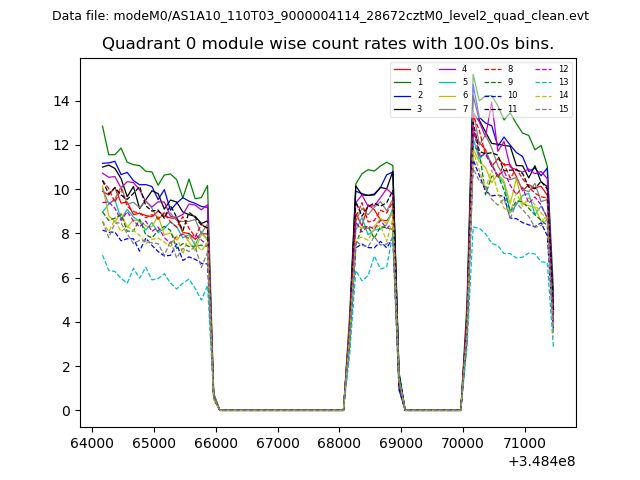
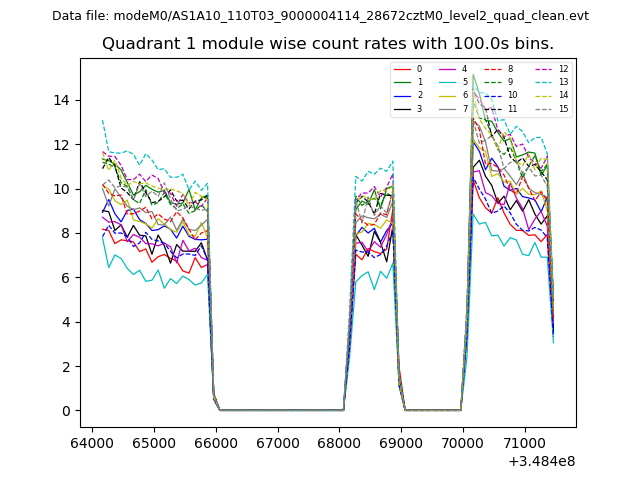
| Module-wise count rates for Quadrant A Data is divided into 100 sec bins |
 |
 |
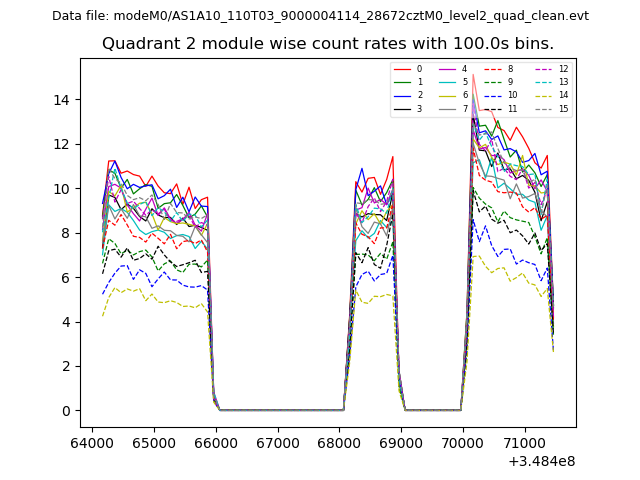
| Module-wise count rates for Quadrant B Data is divided into 100 sec bins |
 |
 |
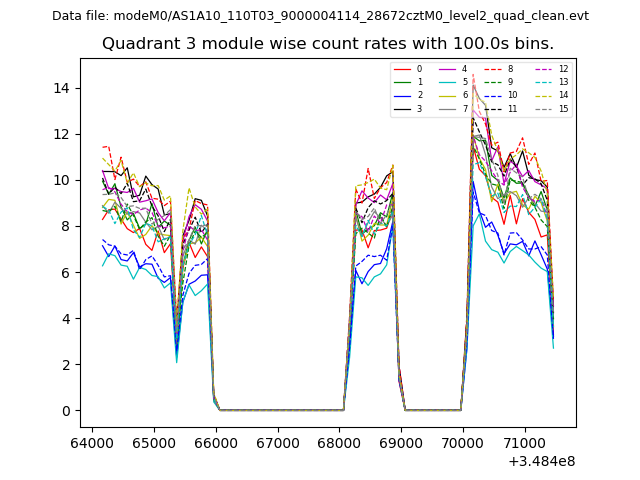
| Module-wise count rates for Quadrant C Data is divided into 100 sec bins |
 |
 |
| Module-wise count rates for Quadrant D Data is divided into 100 sec bins |
 |
 |
| Parameter | Plot |
|---|---|
| CZT HV Monitor | 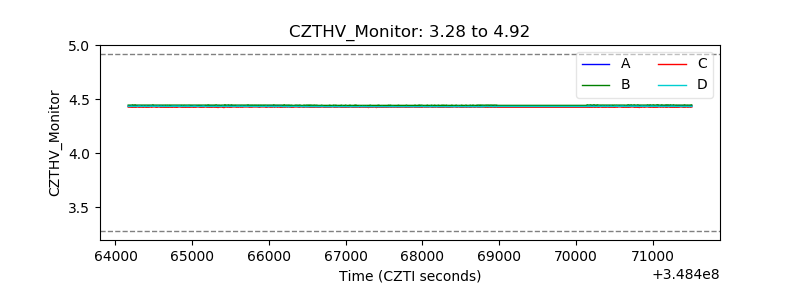 |
| D_VDD | 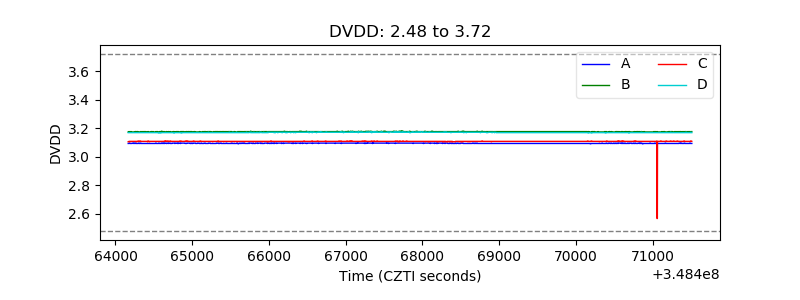 |
| Temperature 1 | 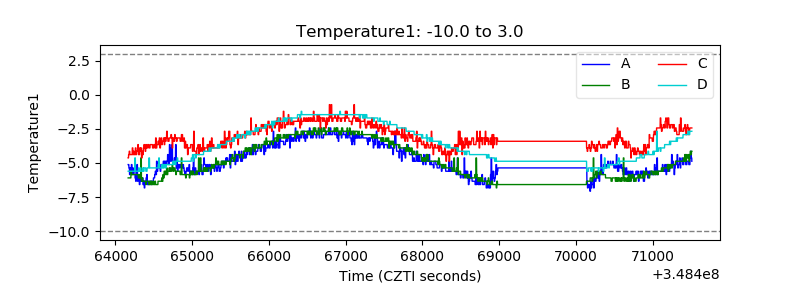 |
| Veto HV Monitor | 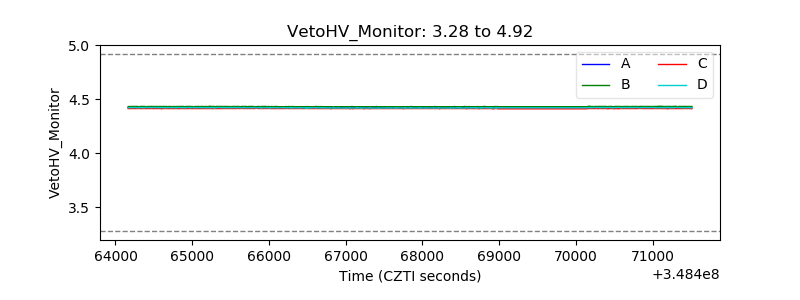 |
| Veto LLD | 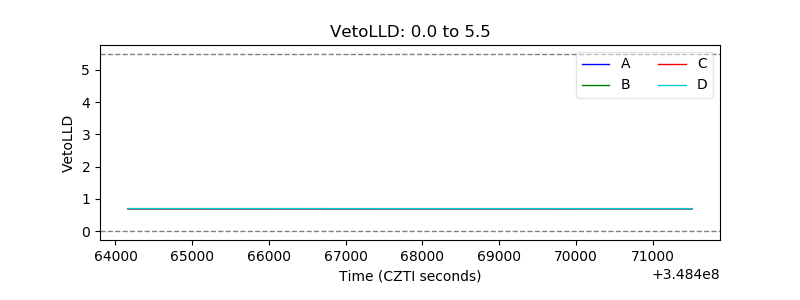 |
| Alpha Counter | 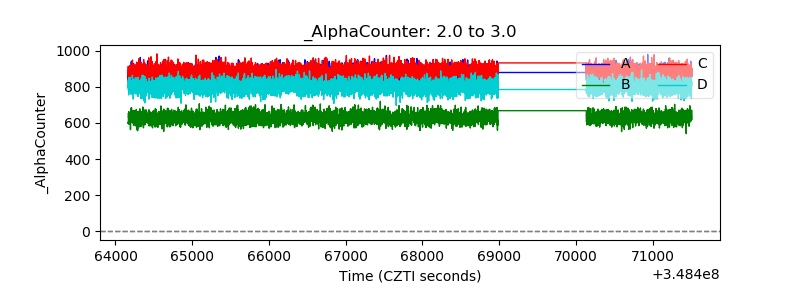 |
| _CPM_Rate | 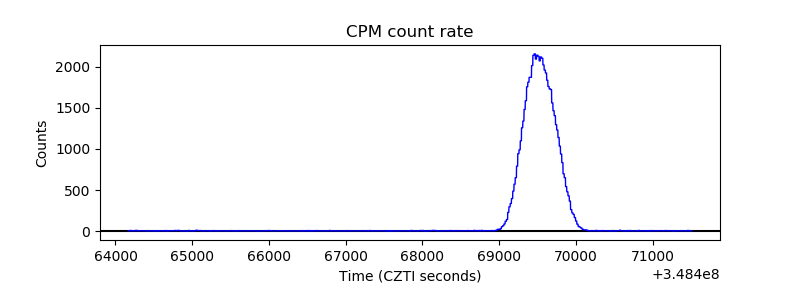 |
| CZT Counter | 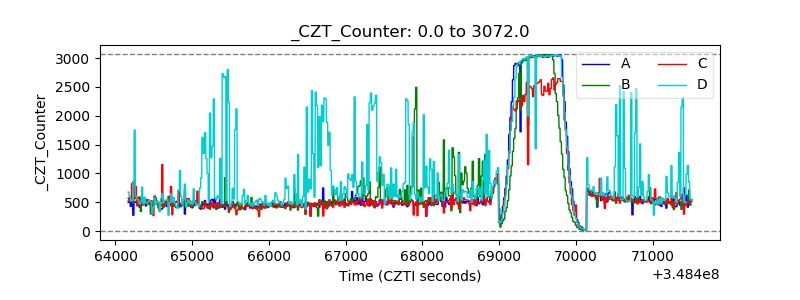 |
| +2.5 Volts monitor |  |
| +5 Volts monitor |  |
| _ROLL_ROT | 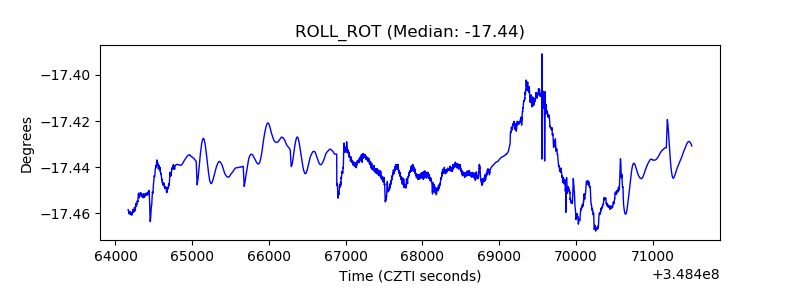 |
| _Roll_DEC | 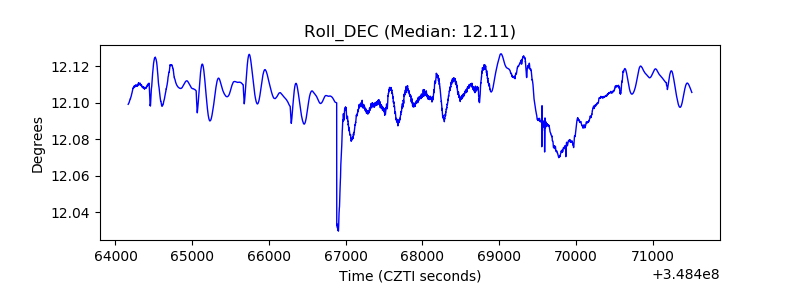 |
| _Roll_RA | 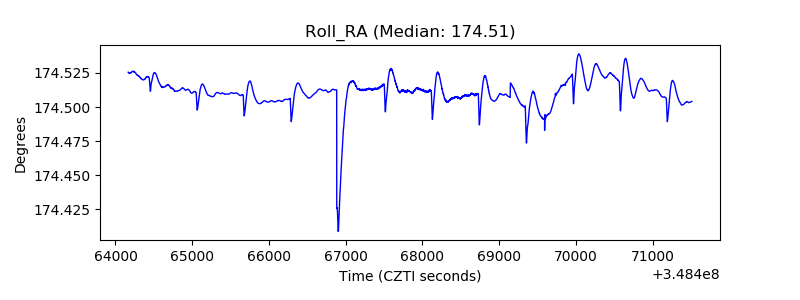 |
| Veto Counter | 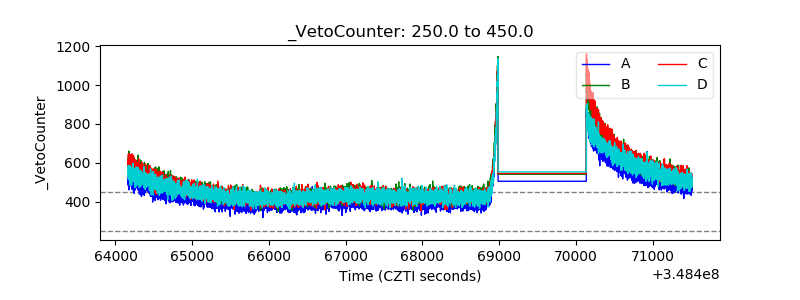 |