| Param | Original file | Final file |
|---|---|---|
| Filename | modeM0/AS1A10_110T03_9000004114_28673cztM0_level2.evt | modeM0/AS1A10_110T03_9000004114_28673cztM0_level2_quad_clean.evt |
| Size (bytes) | 498,879,360 | 84,432,960 |
| Size | 475.8 MB | 80.5 MB |
| Events in quadrant A | 3,018,231 | 552,447 |
| Events in quadrant B | 3,379,457 | 555,912 |
| Events in quadrant C | 3,089,384 | 535,029 |
| Events in quadrant D | 5,233,350 | 512,970 |
| Mode M9 | |||
|---|---|---|---|
| Quadrant | BADHDUFLAG | Total packets | Discarded packets |
| A | 0 | 13 | 0 |
| B | 0 | 13 | 0 |
| C | 0 | 13 | 0 |
| D | 0 | 13 | 0 |
| Mode M0 | |||
|---|---|---|---|
| Quadrant | BADHDUFLAG | Total packets | Discarded packets |
| A | 0 | 12259 | 1 |
| B | 0 | 13329 | 1 |
| C | 0 | 12453 | 1 |
| D | 0 | 19504 | 1 |
| Mode SS | |||
|---|---|---|---|
| Quadrant | BADHDUFLAG | Total packets | Discarded packets |
| A | 0 | 116 | 0 |
| B | 0 | 116 | 0 |
| C | 0 | 116 | 0 |
| D | 0 | 116 | 0 |
| Quadrant | Total seconds | Saturated seconds | Saturation percentage |
|---|---|---|---|
| A | 5728 | 46 | 0.803073% |
| B | 5728 | 172 | 3.002793% |
| C | 5727 | 117 | 2.042954% |
| D | 5728 | 443 | 7.733939% |
Noise dominated data is calculated using 1-second bins in cleaned event files. If a bin has >2000 counts, and if more than 50% of those come from <1% of pixels, then it is considered to be noise-dominated and hence unusable.
| Quadrant | # 1 sec bins | Bins with >0 counts | Bins with >2000 counts | High rate bins dominated by noise | Noise dominated (total time) | Noise dominated (detector-on time) | Marked lightcurve |
|---|---|---|---|---|---|---|---|
| A | 6978 | 5728 | 1 | 1 | 0.01% | 0.02% | 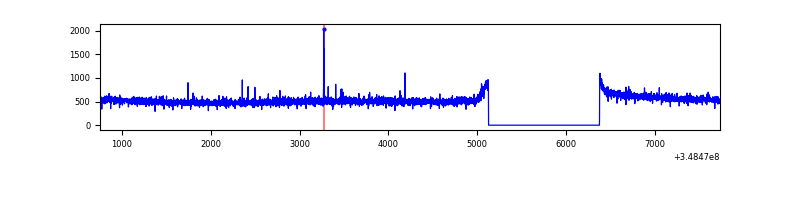 |
| B | 6978 | 5728 | 82 | 82 | 1.18% | 1.43% | 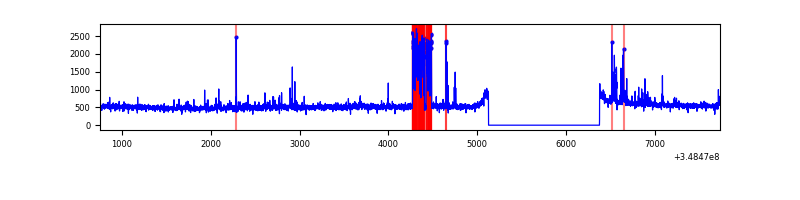 |
| C | 6977 | 5727 | 0 | 0 | 0.00% | 0.00% |  |
| D | 6978 | 5728 | 369 | 369 | 5.29% | 6.44% | 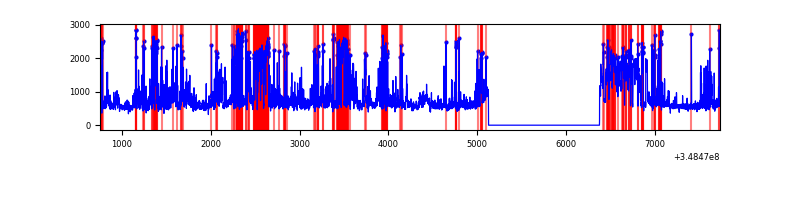 |
Top three noisy pixels from each quadrant. If the there are fewer than three noisy pixels in the level2.evt file, extra rows are filled as -1
| Pixel properties | Quadrant properties | ||||||
|---|---|---|---|---|---|---|---|
| Quadrant | DetID | PixID | Counts | Sigma | Mean | Median | Sigma |
| A | 15 | 174 | 11461 | 69.9 | 779 | 766 | 153.0 |
| A | 13 | 254 | 9971 | 60.16 | 779 | 766 | 153.0 |
| A | 3 | 137 | 7044 | 41.03 | 779 | 766 | 153.0 |
| B | 10 | 245 | 381466 | 2666.98 | 760 | 742 | 142.8 |
| B | 12 | 111 | 17033 | 114.12 | 760 | 742 | 142.8 |
| B | 11 | 111 | 15247 | 101.61 | 760 | 742 | 142.8 |
| C | 14 | 238 | 138777 | 800.53 | 742 | 750 | 172.4 |
| C | 14 | 254 | 26906 | 151.7 | 742 | 750 | 172.4 |
| C | 3 | 233 | 14527 | 79.9 | 742 | 750 | 172.4 |
| D | 1 | 52 | 2008746 | 11529.78 | 739 | 722 | 174.2 |
| D | 8 | 195 | 363580 | 2083.48 | 739 | 722 | 174.2 |
| D | 2 | 120 | 28382 | 158.82 | 739 | 722 | 174.2 |
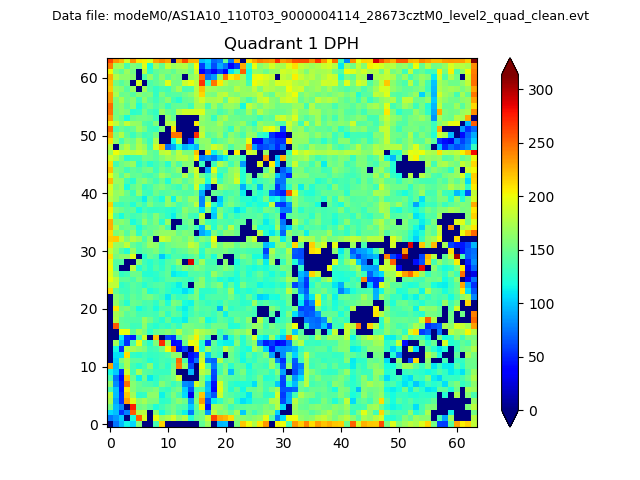
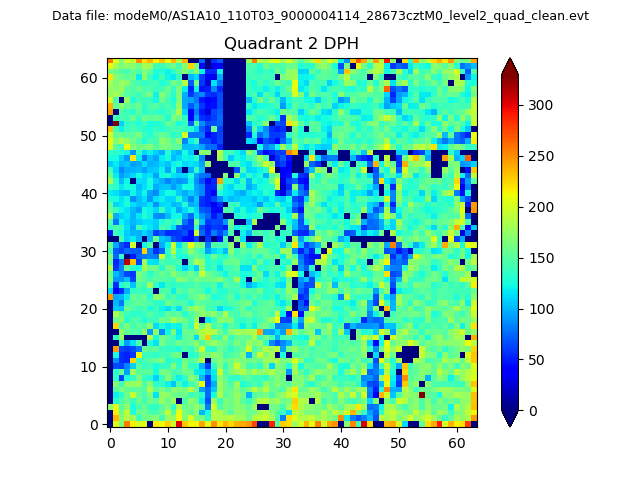
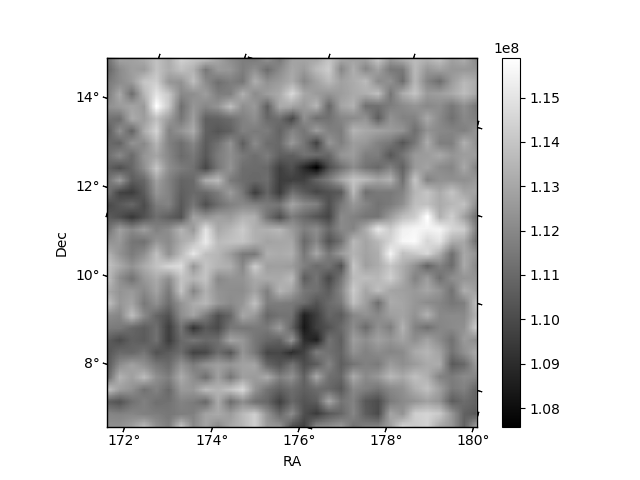
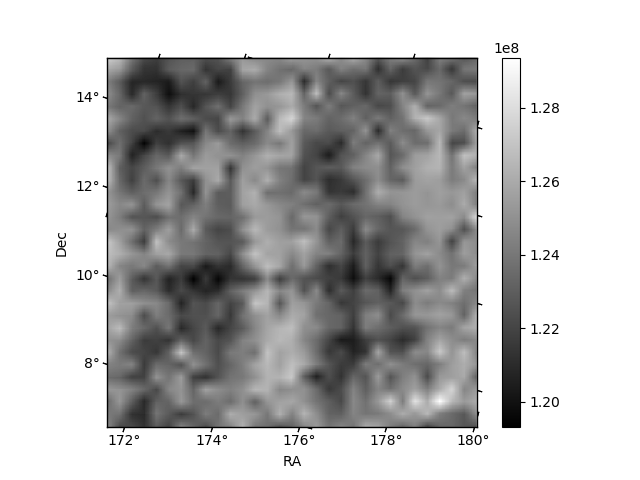
Histogram calculated using DETX and DETY for each event in the final _common_clean file
| Quadrant A | 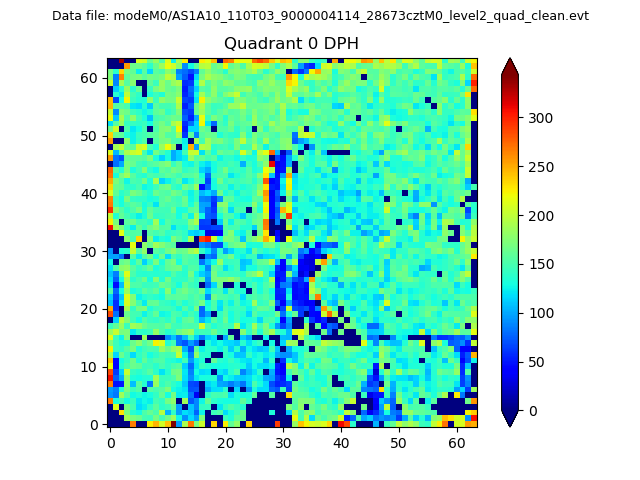 |
 |
Quadrant B |
|---|---|---|---|
| Quadrant D |  |
 |
Quadrant C |
| Plot type | Count rate plots | Images |
|---|---|---|
| Comparison with Poisson distribution Blue bars denote a histogram of data divided into 1 sec bins. Red curve is a Poisson curve with rate = median count rate of data. |
 |
 |
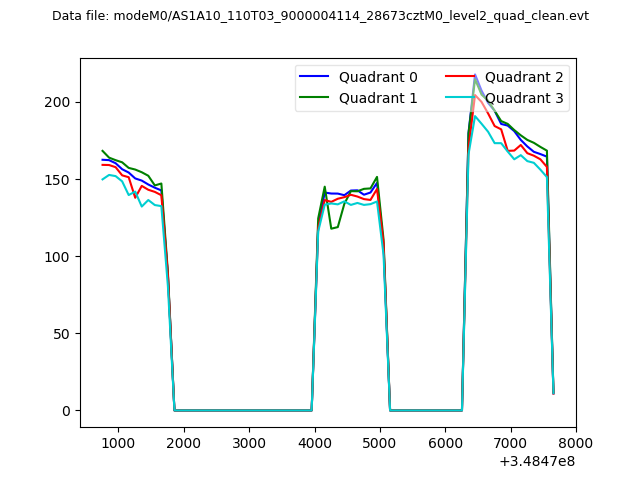
| Quadrant-wise count rates Data is divided into 100 sec bins |
 |
|
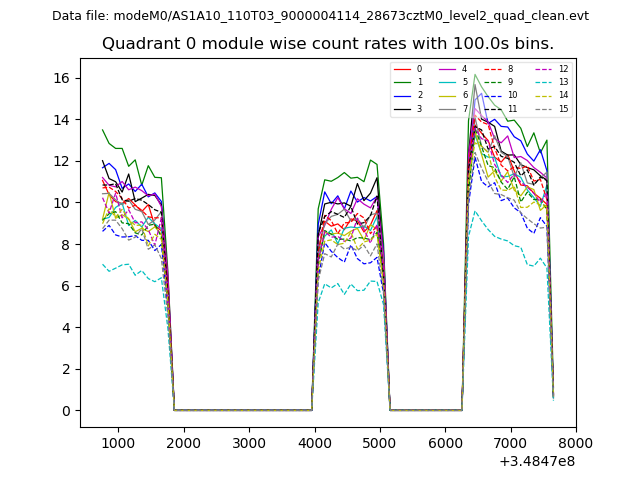
| Module-wise count rates for Quadrant A Data is divided into 100 sec bins |
 |
 |
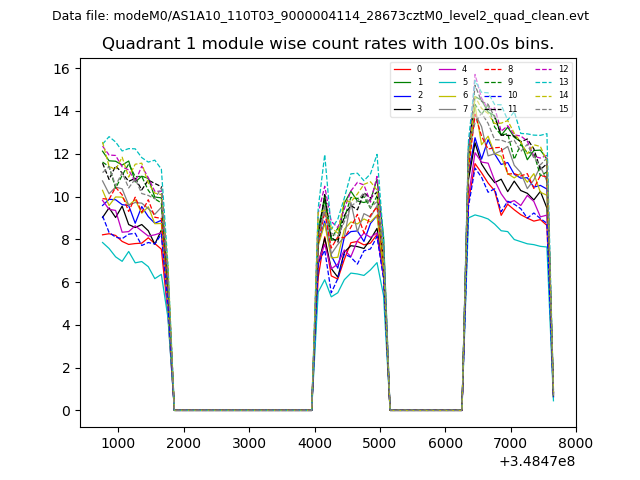
| Module-wise count rates for Quadrant B Data is divided into 100 sec bins |
 |
 |
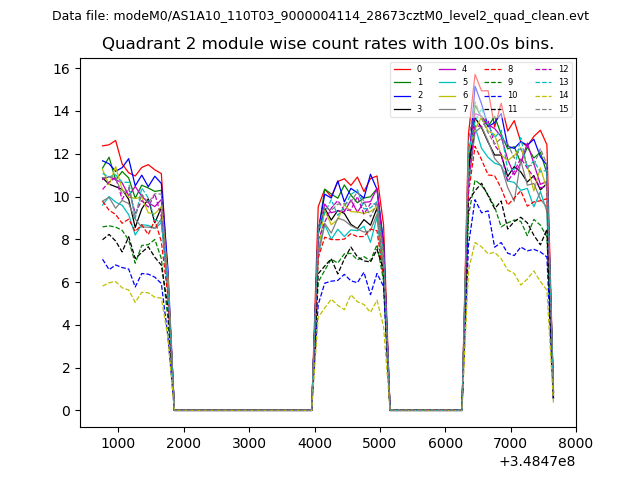
| Module-wise count rates for Quadrant C Data is divided into 100 sec bins |
 |
 |
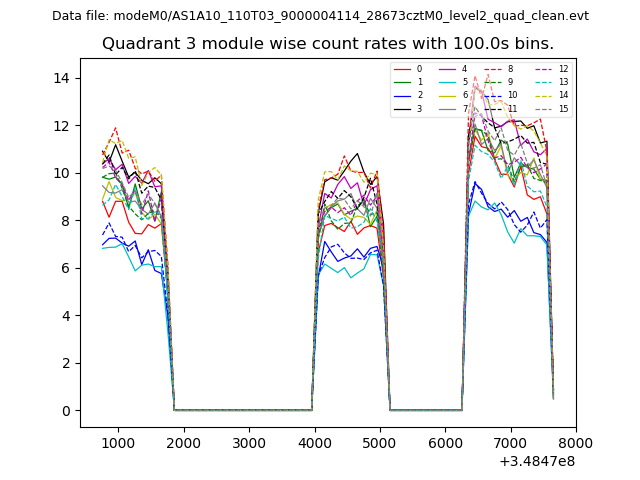
| Module-wise count rates for Quadrant D Data is divided into 100 sec bins |
 |
 |
| Parameter | Plot |
|---|---|
| CZT HV Monitor | 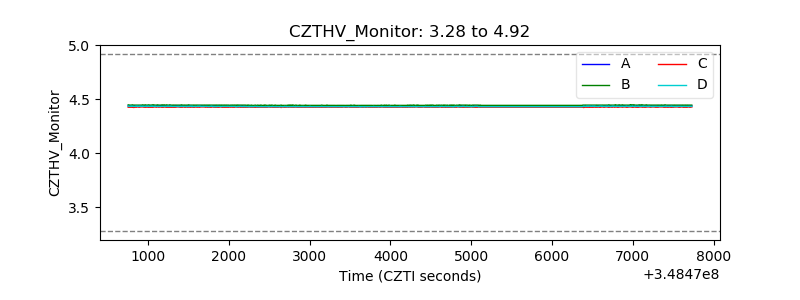 |
| D_VDD | 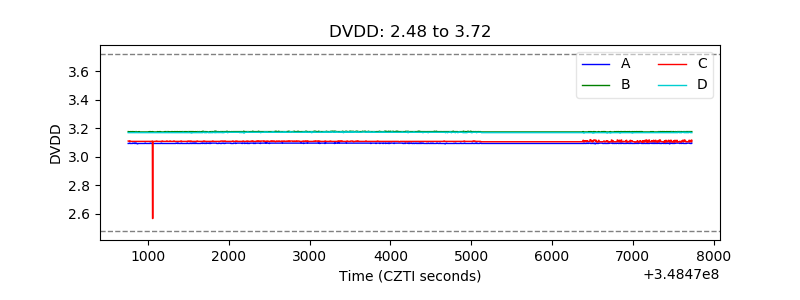 |
| Temperature 1 | 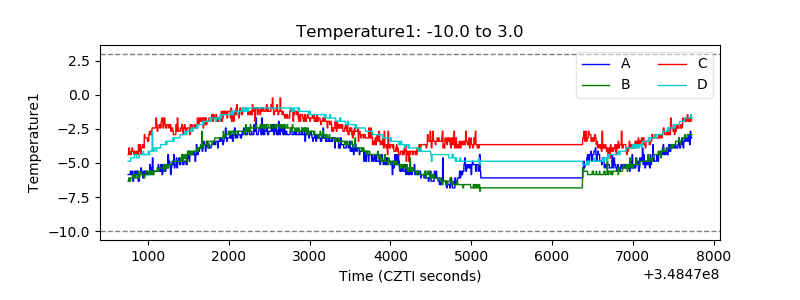 |
| Veto HV Monitor | 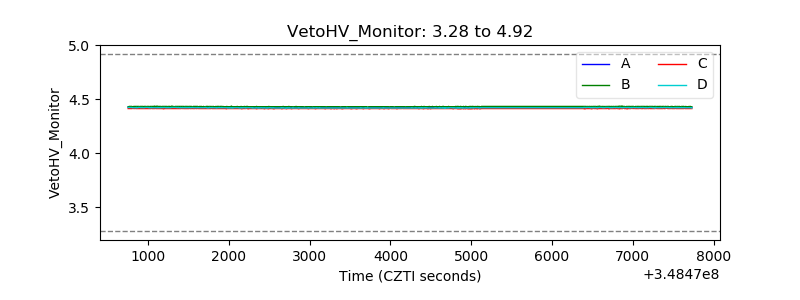 |
| Veto LLD | 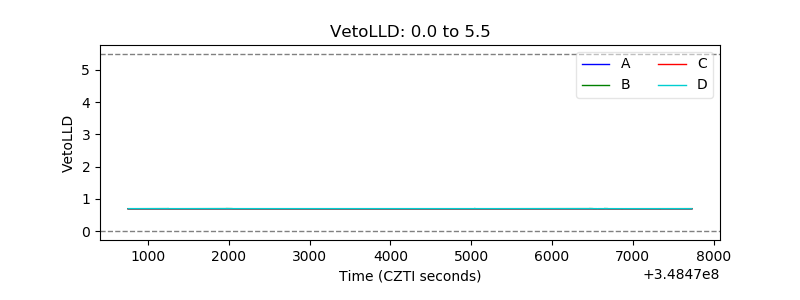 |
| Alpha Counter | 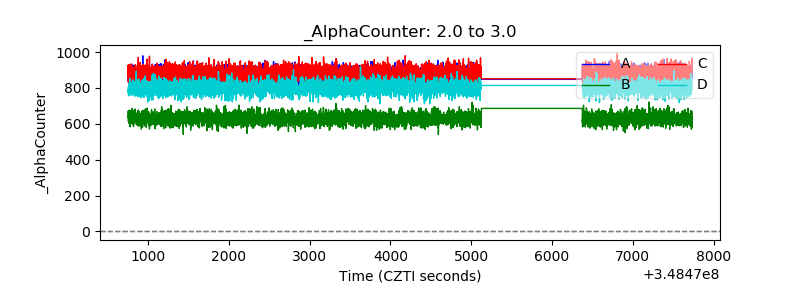 |
| _CPM_Rate | 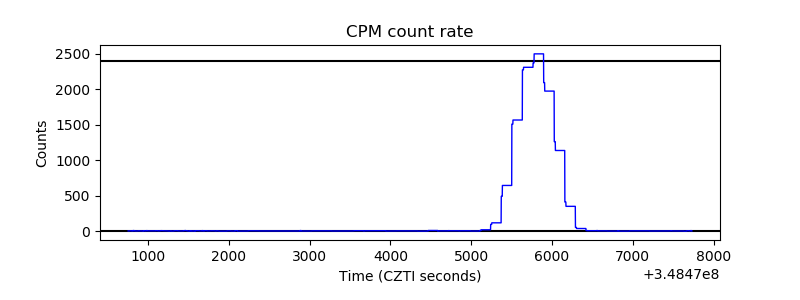 |
| CZT Counter | 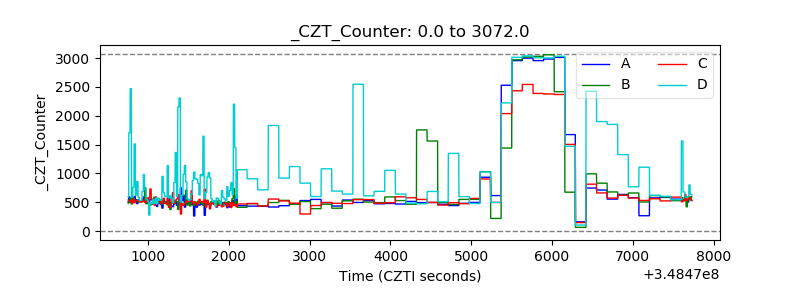 |
| +2.5 Volts monitor |  |
| +5 Volts monitor | 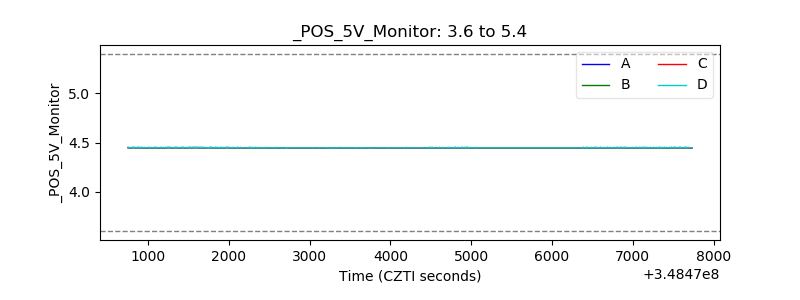 |
| _ROLL_ROT | 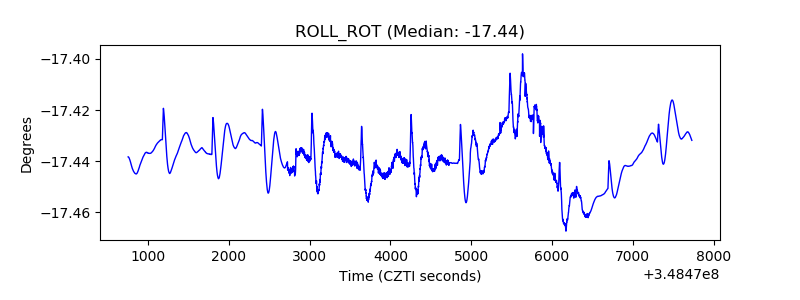 |
| _Roll_DEC | 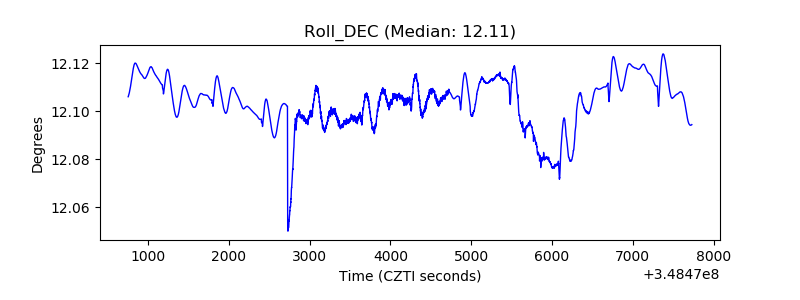 |
| _Roll_RA | 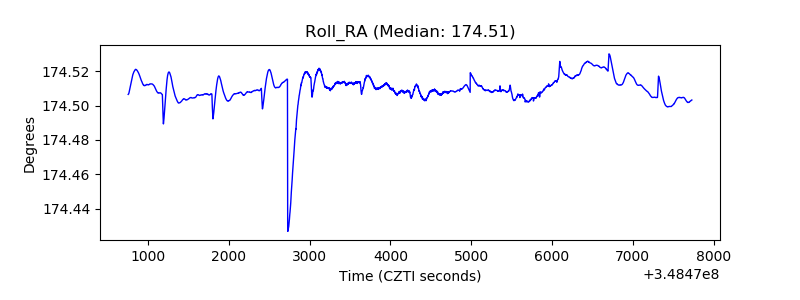 |
| Veto Counter | 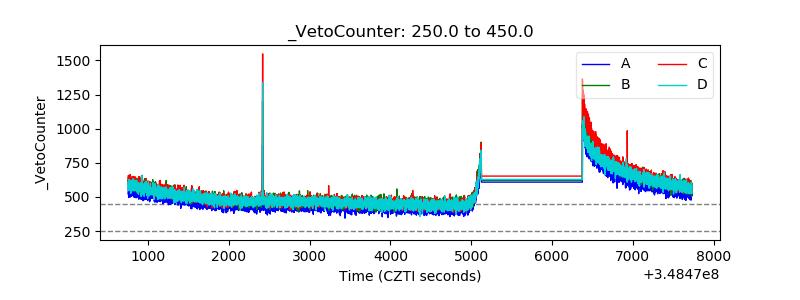 |