| Param | Original file | Final file |
|---|---|---|
| Filename | modeM0/AS1A10_110T03_9000004114_28674cztM0_level2.evt | modeM0/AS1A10_110T03_9000004114_28674cztM0_level2_quad_clean.evt |
| Size (bytes) | 540,063,360 | 75,680,640 |
| Size | 515.0 MB | 72.2 MB |
| Events in quadrant A | 3,074,338 | 489,812 |
| Events in quadrant B | 3,612,073 | 493,823 |
| Events in quadrant C | 3,107,920 | 474,844 |
| Events in quadrant D | 6,185,599 | 444,703 |
| Mode M9 | |||
|---|---|---|---|
| Quadrant | BADHDUFLAG | Total packets | Discarded packets |
| A | 0 | 13 | 0 |
| B | 0 | 13 | 0 |
| C | 0 | 13 | 0 |
| D | 0 | 13 | 0 |
| Mode M0 | |||
|---|---|---|---|
| Quadrant | BADHDUFLAG | Total packets | Discarded packets |
| A | 0 | 12309 | 1 |
| B | 0 | 14226 | 1 |
| C | 0 | 12430 | 1 |
| D | 0 | 22380 | 1 |
| Mode SS | |||
|---|---|---|---|
| Quadrant | BADHDUFLAG | Total packets | Discarded packets |
| A | 0 | 114 | 0 |
| B | 0 | 114 | 0 |
| C | 0 | 114 | 0 |
| D | 0 | 114 | 0 |
| Quadrant | Total seconds | Saturated seconds | Saturation percentage |
|---|---|---|---|
| A | 5548 | 80 | 1.441961% |
| B | 5549 | 165 | 2.973509% |
| C | 5549 | 147 | 2.649126% |
| D | 5549 | 806 | 14.525140% |
Noise dominated data is calculated using 1-second bins in cleaned event files. If a bin has >2000 counts, and if more than 50% of those come from <1% of pixels, then it is considered to be noise-dominated and hence unusable.
| Quadrant | # 1 sec bins | Bins with >0 counts | Bins with >2000 counts | High rate bins dominated by noise | Noise dominated (total time) | Noise dominated (detector-on time) | Marked lightcurve |
|---|---|---|---|---|---|---|---|
| A | 6838 | 5548 | 0 | 0 | 0.00% | 0.00% | 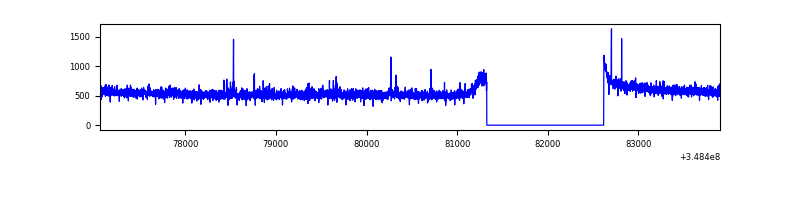 |
| B | 6839 | 5549 | 47 | 47 | 0.69% | 0.85% | 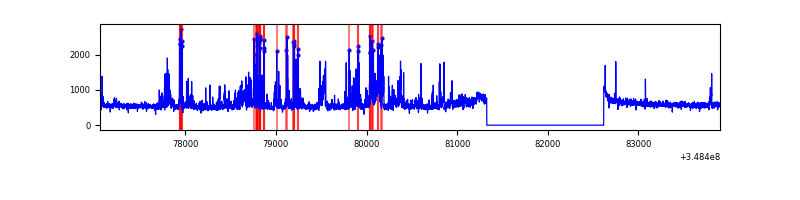 |
| C | 6839 | 5549 | 0 | 0 | 0.00% | 0.00% | 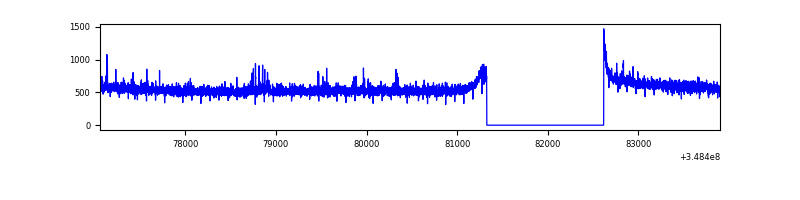 |
| D | 6839 | 5549 | 688 | 688 | 10.06% | 12.40% | 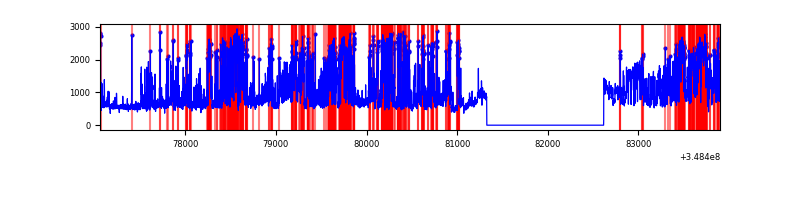 |
Top three noisy pixels from each quadrant. If the there are fewer than three noisy pixels in the level2.evt file, extra rows are filled as -1
| Pixel properties | Quadrant properties | ||||||
|---|---|---|---|---|---|---|---|
| Quadrant | DetID | PixID | Counts | Sigma | Mean | Median | Sigma |
| A | 15 | 174 | 22628 | 138.79 | 789 | 777 | 157.4 |
| A | 13 | 254 | 9619 | 56.16 | 789 | 777 | 157.4 |
| A | 10 | 67 | 8232 | 47.35 | 789 | 777 | 157.4 |
| B | 10 | 245 | 563655 | 3939.77 | 764 | 745 | 142.9 |
| B | 4 | 80 | 26820 | 182.5 | 764 | 745 | 142.9 |
| B | 0 | 190 | 18660 | 125.39 | 764 | 745 | 142.9 |
| C | 14 | 238 | 139414 | 807.17 | 750 | 760 | 171.8 |
| C | 14 | 254 | 23018 | 129.57 | 750 | 760 | 171.8 |
| C | 8 | 128 | 9345 | 49.98 | 750 | 760 | 171.8 |
| D | 1 | 52 | 3051047 | 17702.66 | 737 | 720 | 172.3 |
| D | 8 | 195 | 321784 | 1863.3 | 737 | 720 | 172.3 |
| D | 2 | 234 | 20572 | 115.21 | 737 | 720 | 172.3 |
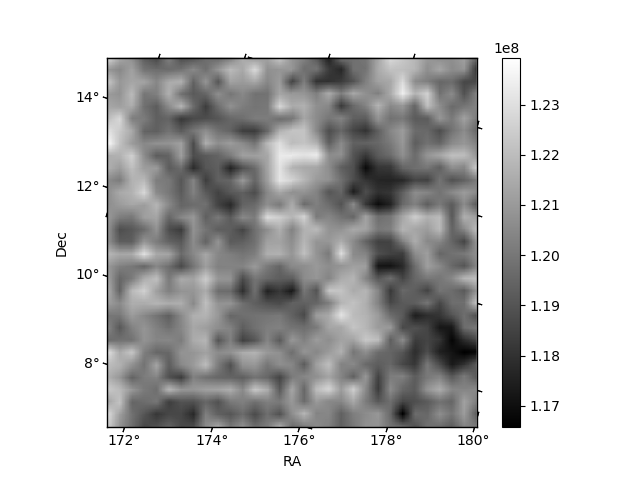
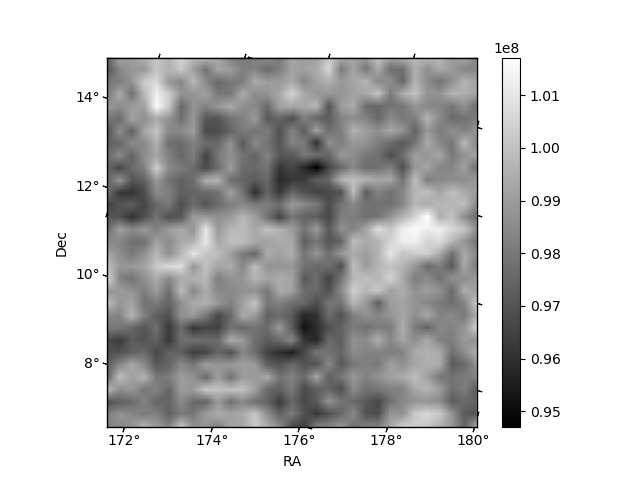
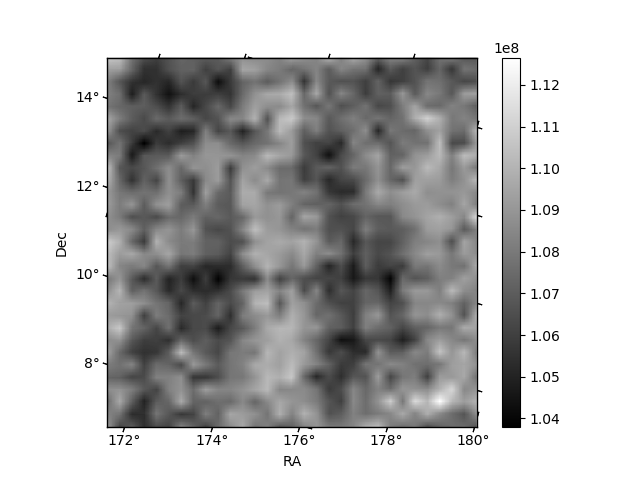
Histogram calculated using DETX and DETY for each event in the final _common_clean file
| Quadrant A | 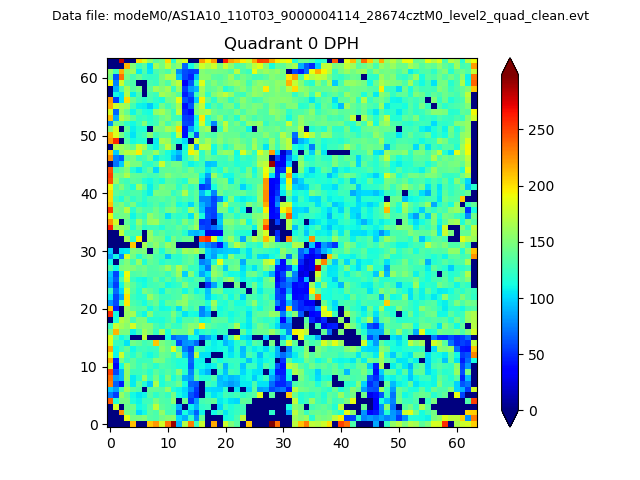 |
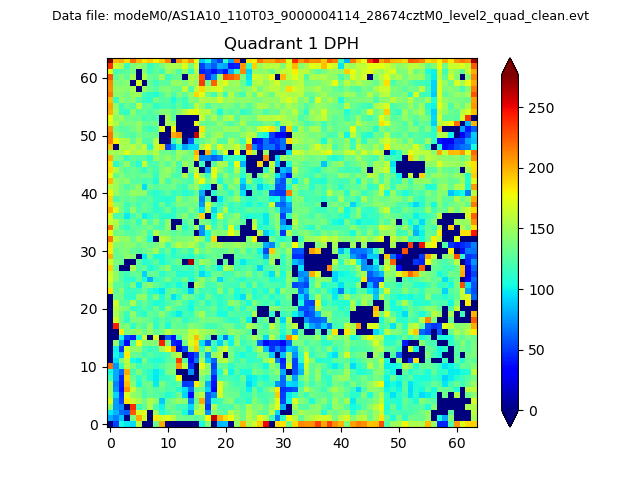 |
Quadrant B |
|---|---|---|---|
| Quadrant D | 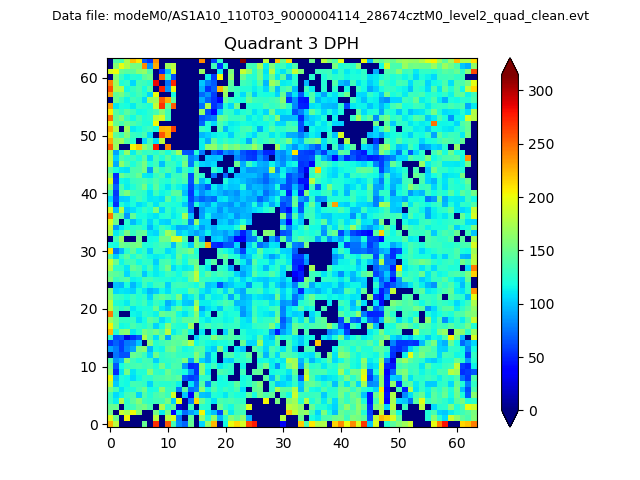 |
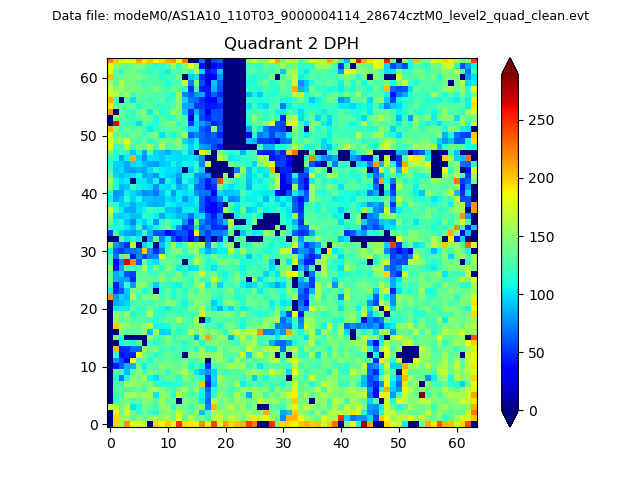 |
Quadrant C |
| Plot type | Count rate plots | Images |
|---|---|---|
| Comparison with Poisson distribution Blue bars denote a histogram of data divided into 1 sec bins. Red curve is a Poisson curve with rate = median count rate of data. |
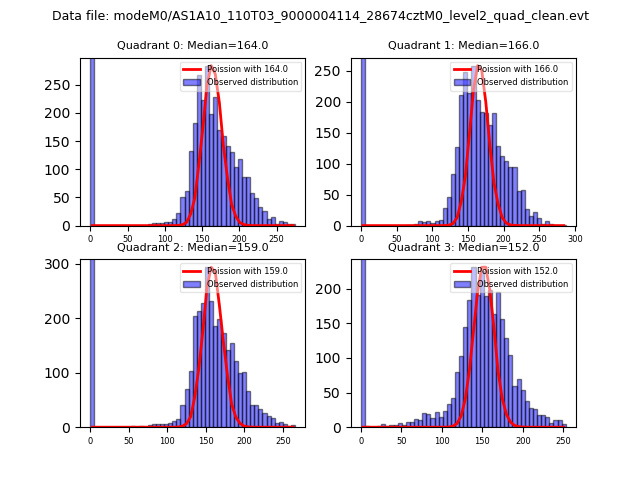 |
 |
| Quadrant-wise count rates Data is divided into 100 sec bins |
 |
|
| Module-wise count rates for Quadrant A Data is divided into 100 sec bins |
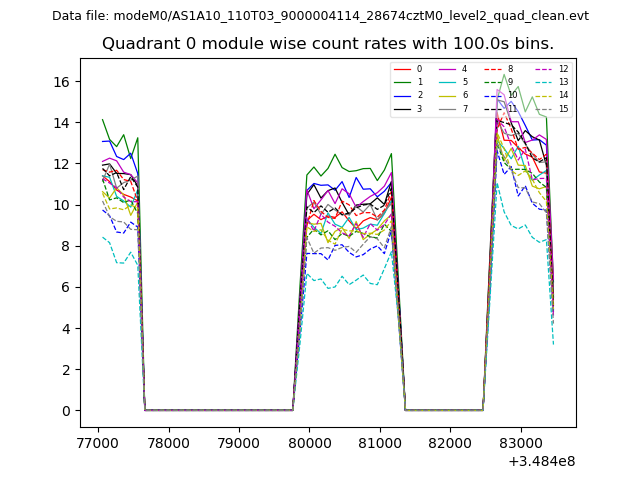 |
 |
| Module-wise count rates for Quadrant B Data is divided into 100 sec bins |
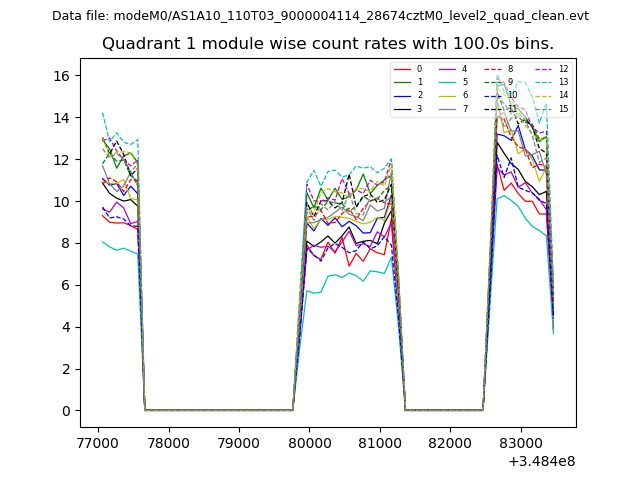 |
 |
| Module-wise count rates for Quadrant C Data is divided into 100 sec bins |
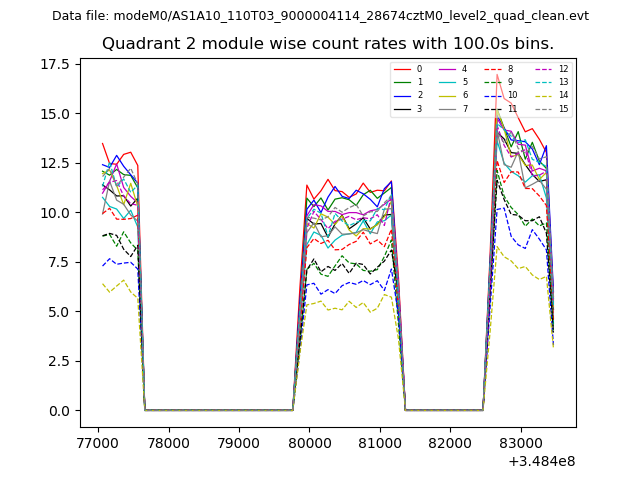 |
 |
| Module-wise count rates for Quadrant D Data is divided into 100 sec bins |
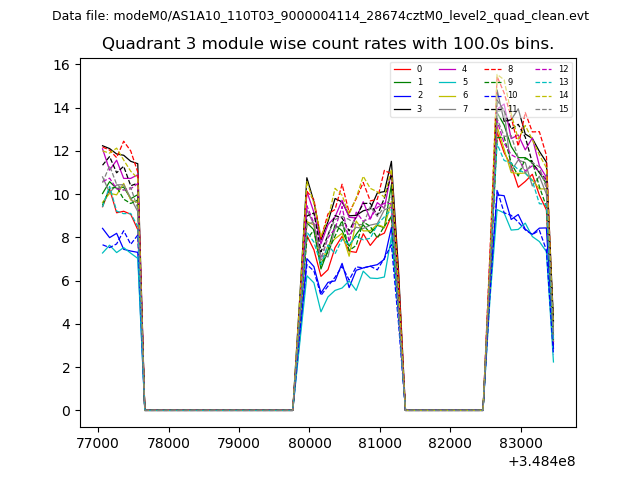 |
 |
| Parameter | Plot |
|---|---|
| CZT HV Monitor | 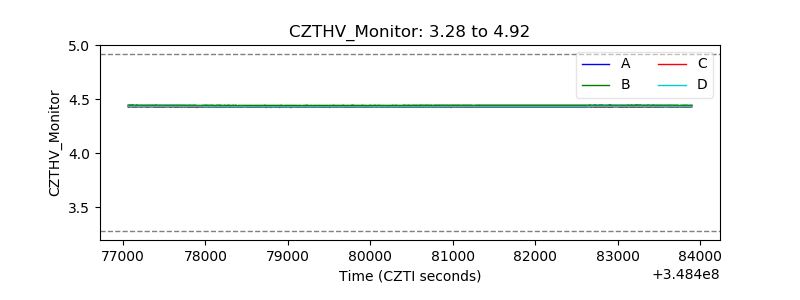 |
| D_VDD | 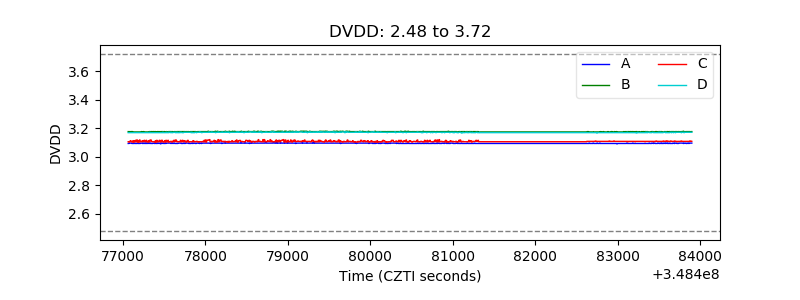 |
| Temperature 1 | 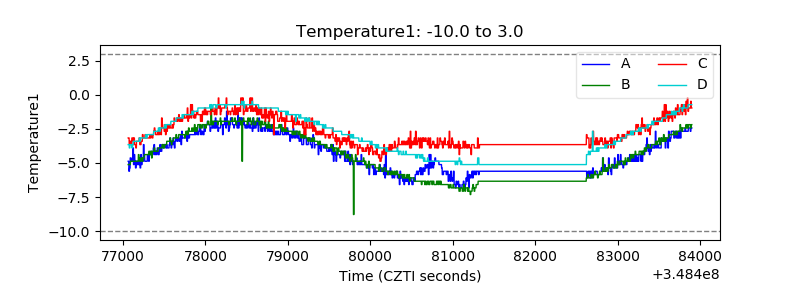 |
| Veto HV Monitor |  |
| Veto LLD |  |
| Alpha Counter |  |
| _CPM_Rate | 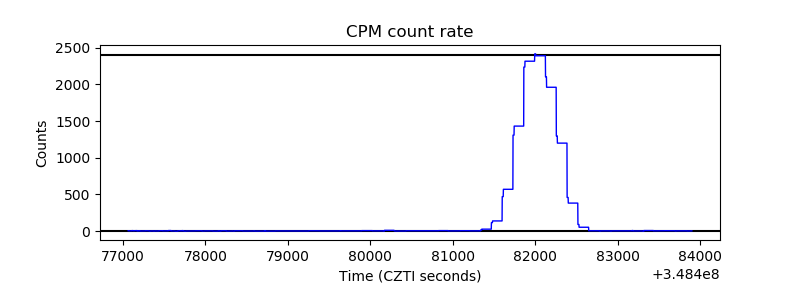 |
| CZT Counter | 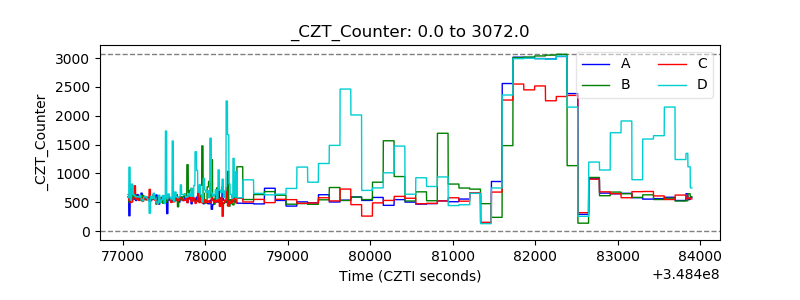 |
| +2.5 Volts monitor |  |
| +5 Volts monitor |  |
| _ROLL_ROT | 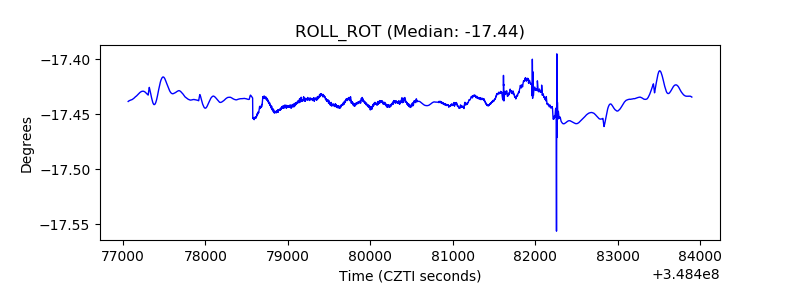 |
| _Roll_DEC | 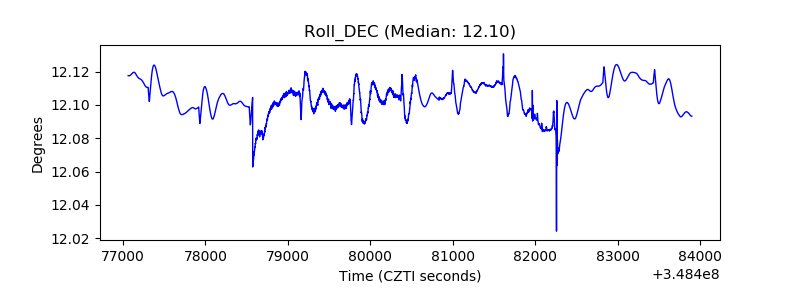 |
| _Roll_RA |  |
| Veto Counter | 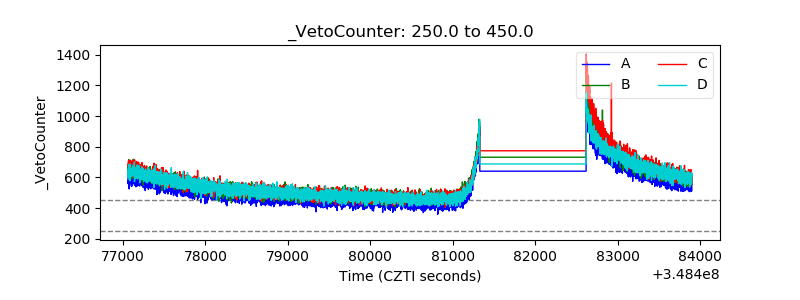 |