| Param | Original file | Final file |
|---|---|---|
| Filename | modeM0/AS1A10_110T03_9000004114_28675cztM0_level2.evt | modeM0/AS1A10_110T03_9000004114_28675cztM0_level2_quad_clean.evt |
| Size (bytes) | 583,436,160 | 84,251,520 |
| Size | 556.4 MB | 80.3 MB |
| Events in quadrant A | 3,467,476 | 543,985 |
| Events in quadrant B | 3,566,982 | 548,836 |
| Events in quadrant C | 3,536,104 | 526,630 |
| Events in quadrant D | 6,682,817 | 502,501 |
| Mode M9 | |||
|---|---|---|---|
| Quadrant | BADHDUFLAG | Total packets | Discarded packets |
| A | 0 | 13 | 0 |
| B | 0 | 13 | 0 |
| C | 0 | 13 | 0 |
| D | 0 | 13 | 0 |
| Mode M0 | |||
|---|---|---|---|
| Quadrant | BADHDUFLAG | Total packets | Discarded packets |
| A | 0 | 14040 | 2 |
| B | 0 | 14361 | 2 |
| C | 0 | 14268 | 2 |
| D | 0 | 24432 | 2 |
| Mode SS | |||
|---|---|---|---|
| Quadrant | BADHDUFLAG | Total packets | Discarded packets |
| A | 0 | 126 | 0 |
| B | 0 | 126 | 0 |
| C | 0 | 126 | 0 |
| D | 0 | 126 | 0 |
| Quadrant | Total seconds | Saturated seconds | Saturation percentage |
|---|---|---|---|
| A | 6146 | 104 | 1.692158% |
| B | 6147 | 133 | 2.163657% |
| C | 6147 | 152 | 2.472751% |
| D | 6146 | 776 | 12.626098% |
Noise dominated data is calculated using 1-second bins in cleaned event files. If a bin has >2000 counts, and if more than 50% of those come from <1% of pixels, then it is considered to be noise-dominated and hence unusable.
| Quadrant | # 1 sec bins | Bins with >0 counts | Bins with >2000 counts | High rate bins dominated by noise | Noise dominated (total time) | Noise dominated (detector-on time) | Marked lightcurve |
|---|---|---|---|---|---|---|---|
| A | 7466 | 6146 | 0 | 0 | 0.00% | 0.00% | 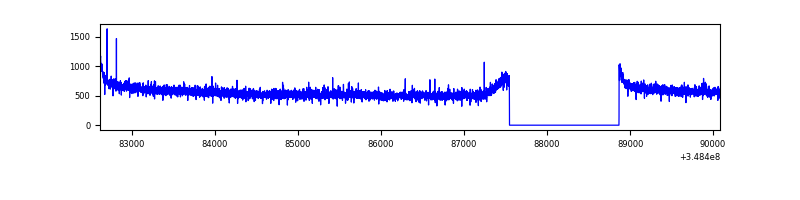 |
| B | 7467 | 6147 | 4 | 4 | 0.05% | 0.07% | 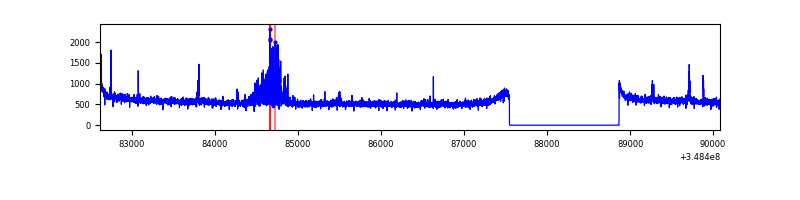 |
| C | 7467 | 6147 | 0 | 0 | 0.00% | 0.00% | 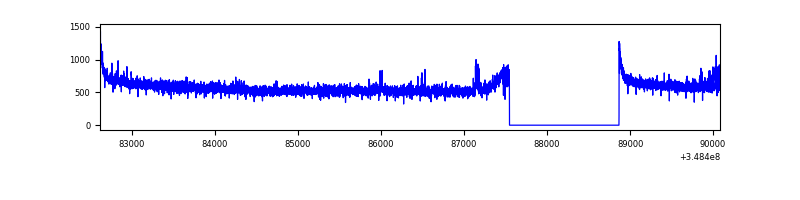 |
| D | 7466 | 6146 | 687 | 687 | 9.20% | 11.18% | 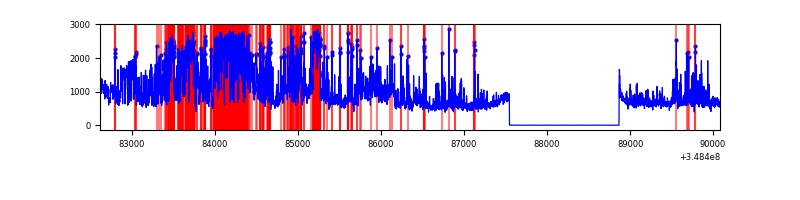 |
Top three noisy pixels from each quadrant. If the there are fewer than three noisy pixels in the level2.evt file, extra rows are filled as -1
| Pixel properties | Quadrant properties | ||||||
|---|---|---|---|---|---|---|---|
| Quadrant | DetID | PixID | Counts | Sigma | Mean | Median | Sigma |
| A | 13 | 254 | 10687 | 55.31 | 897 | 884 | 177.2 |
| A | 3 | 137 | 7758 | 38.78 | 897 | 884 | 177.2 |
| A | 0 | 226 | 7698 | 38.44 | 897 | 884 | 177.2 |
| B | 15 | 33 | 122845 | 751.56 | 871 | 851 | 162.3 |
| B | 0 | 190 | 22611 | 134.06 | 871 | 851 | 162.3 |
| B | 12 | 111 | 19265 | 113.44 | 871 | 851 | 162.3 |
| C | 14 | 238 | 152174 | 776.66 | 854 | 864 | 194.8 |
| C | 14 | 254 | 18403 | 90.03 | 854 | 864 | 194.8 |
| C | 3 | 233 | 17476 | 85.27 | 854 | 864 | 194.8 |
| D | 1 | 52 | 2747740 | 13926.9 | 842 | 824 | 197.2 |
| D | 8 | 195 | 628946 | 3184.59 | 842 | 824 | 197.2 |
| D | 12 | 79 | 48693 | 242.7 | 842 | 824 | 197.2 |
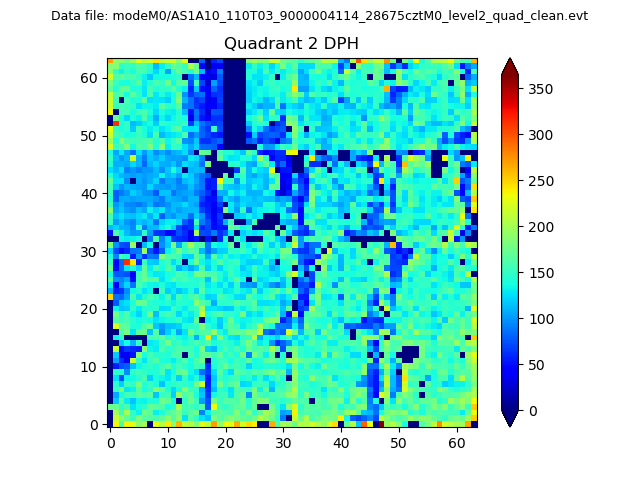
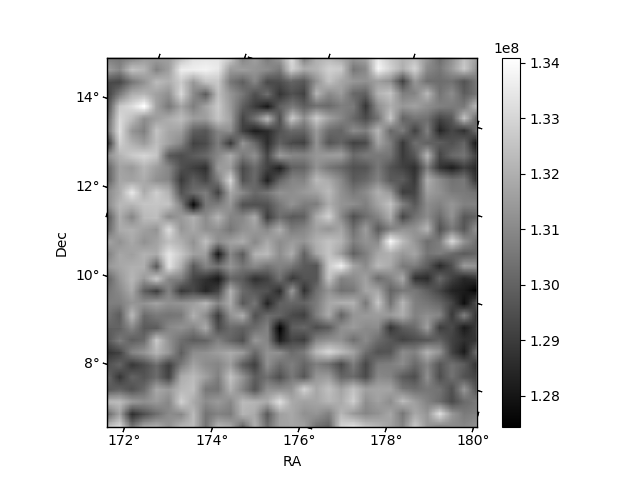
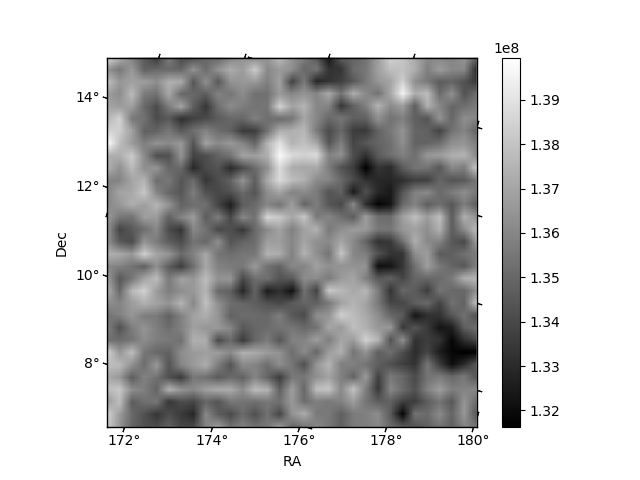
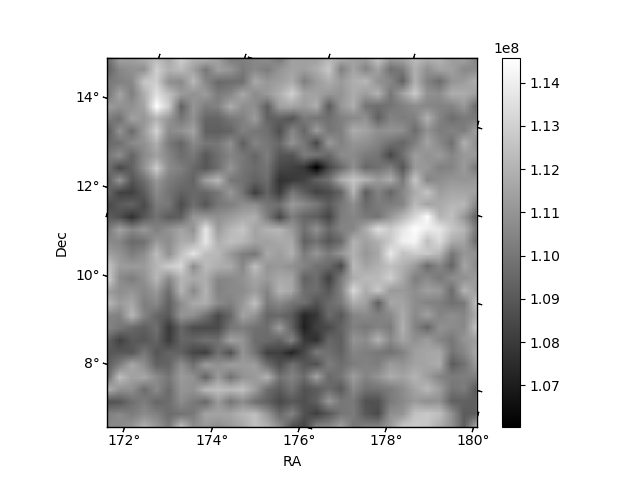
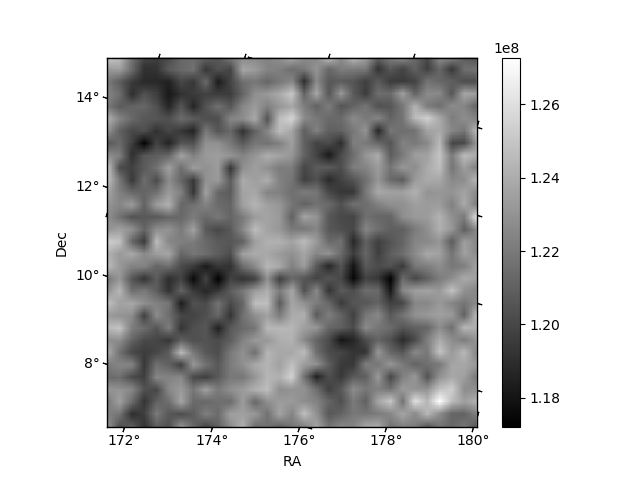
Histogram calculated using DETX and DETY for each event in the final _common_clean file
| Quadrant A | 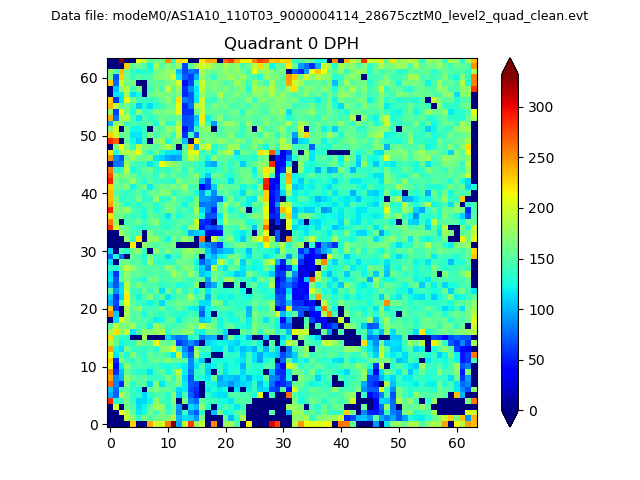 |
 |
Quadrant B |
|---|---|---|---|
| Quadrant D |  |
 |
Quadrant C |
| Plot type | Count rate plots | Images |
|---|---|---|
| Comparison with Poisson distribution Blue bars denote a histogram of data divided into 1 sec bins. Red curve is a Poisson curve with rate = median count rate of data. |
 |
 |
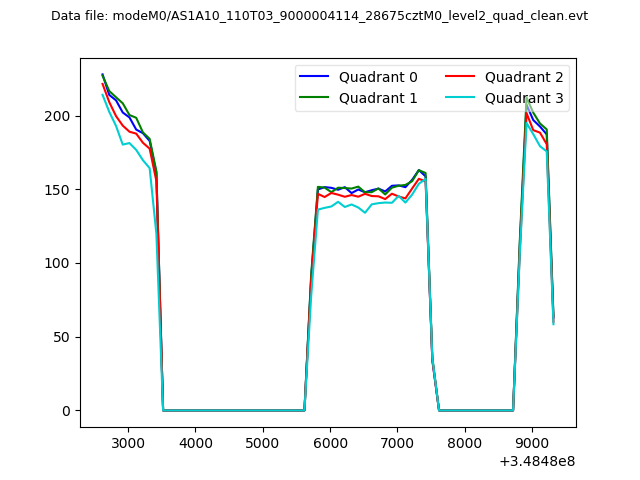
| Quadrant-wise count rates Data is divided into 100 sec bins |
 |
|
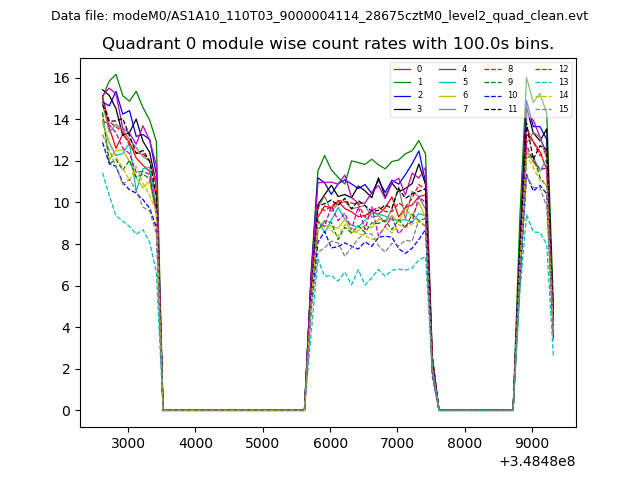
| Module-wise count rates for Quadrant A Data is divided into 100 sec bins |
 |
 |
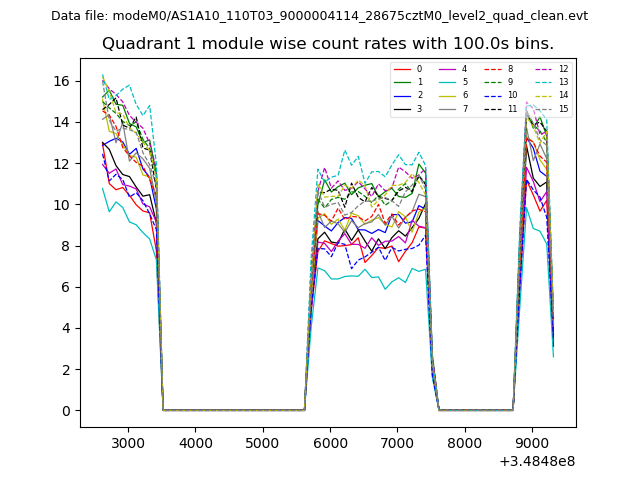
| Module-wise count rates for Quadrant B Data is divided into 100 sec bins |
 |
 |
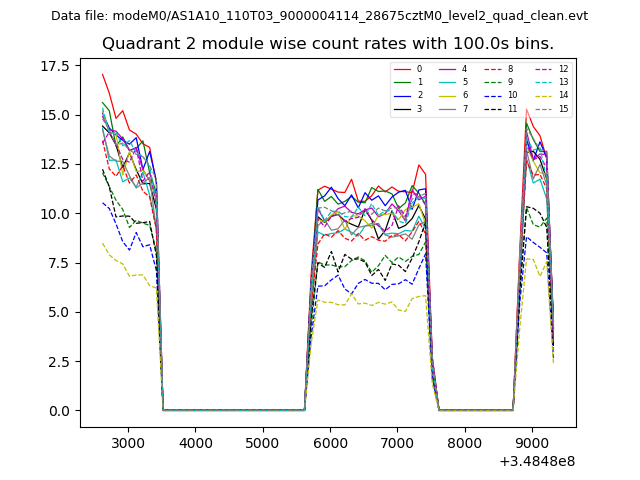
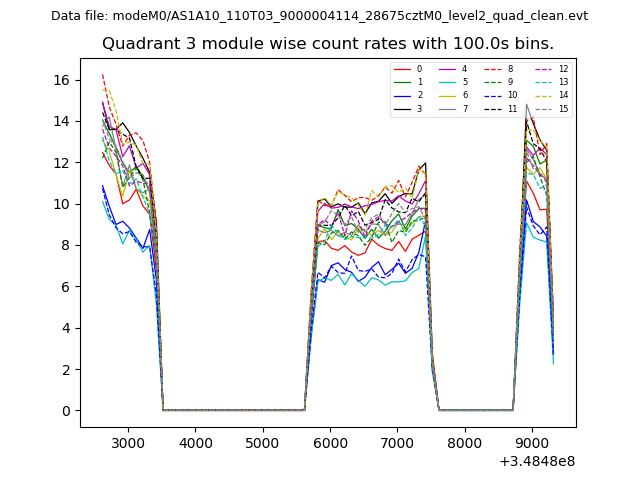
| Module-wise count rates for Quadrant C Data is divided into 100 sec bins |
 |
 |
| Module-wise count rates for Quadrant D Data is divided into 100 sec bins |
 |
 |
| Parameter | Plot |
|---|---|
| CZT HV Monitor | 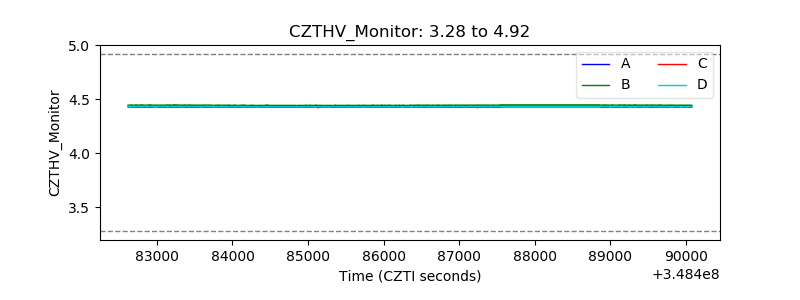 |
| D_VDD | 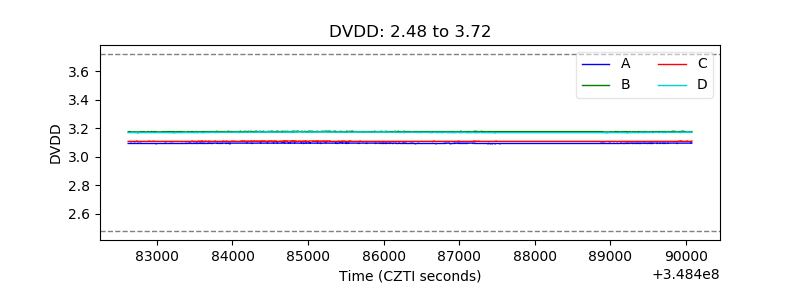 |
| Temperature 1 | 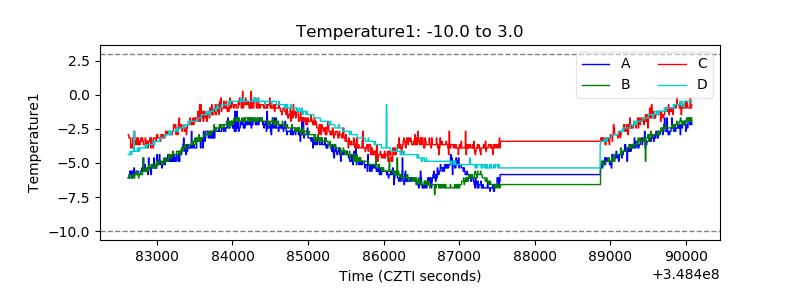 |
| Veto HV Monitor | 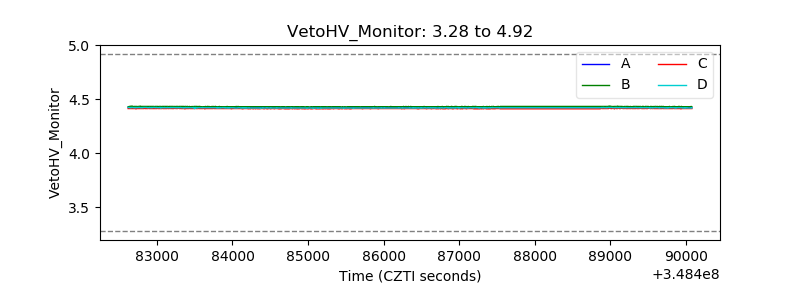 |
| Veto LLD | 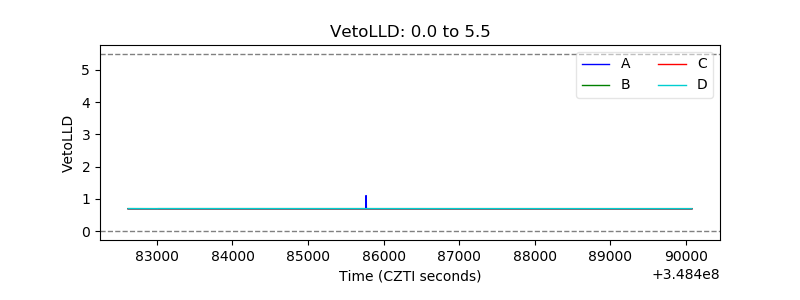 |
| Alpha Counter | 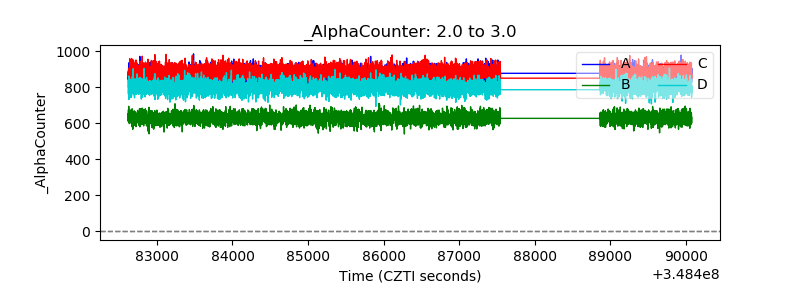 |
| _CPM_Rate | 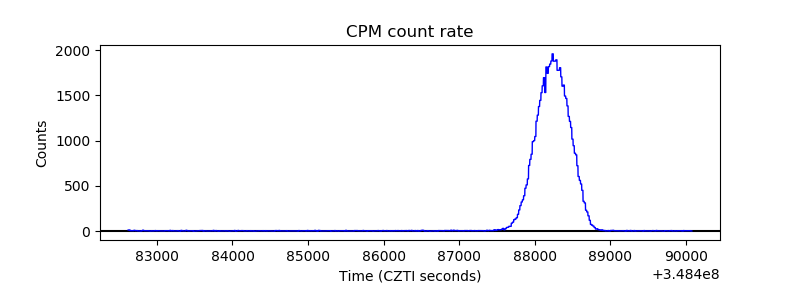 |
| CZT Counter |  |
| +2.5 Volts monitor |  |
| +5 Volts monitor | 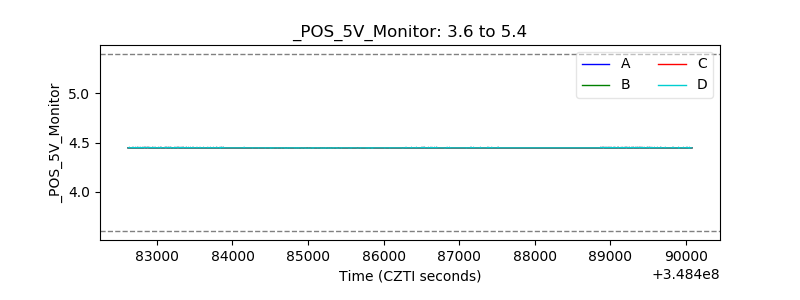 |
| _ROLL_ROT | 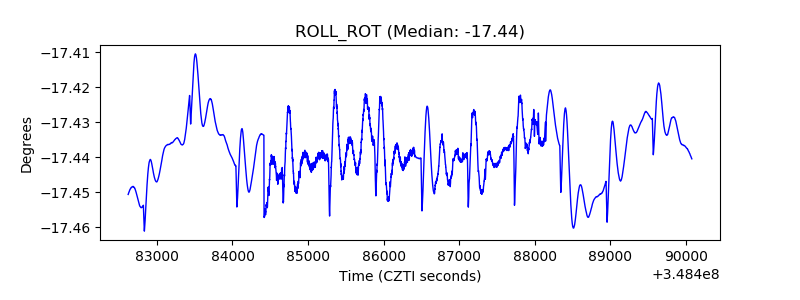 |
| _Roll_DEC | 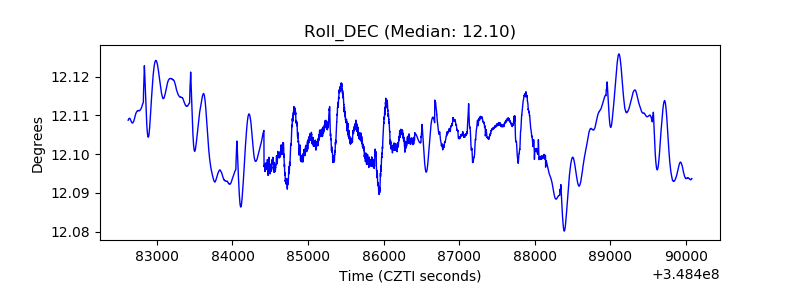 |
| _Roll_RA | 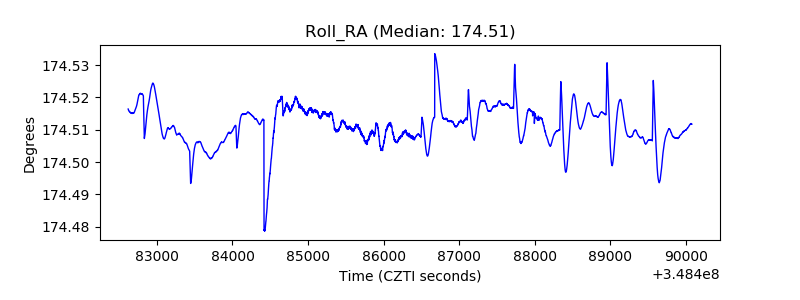 |
| Veto Counter | 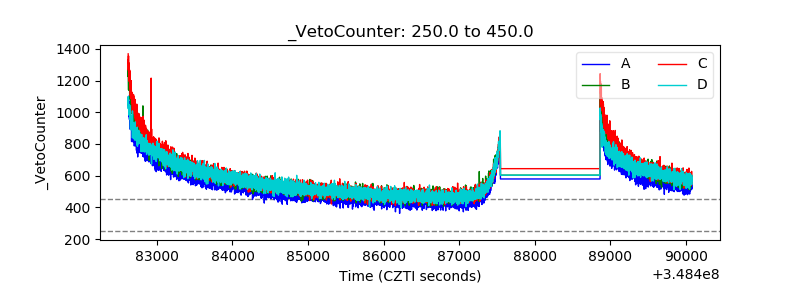 |