| Param | Original file | Final file |
|---|---|---|
| Filename | modeM0/AS1A10_110T03_9000004114_28677cztM0_level2.evt | modeM0/AS1A10_110T03_9000004114_28677cztM0_level2_quad_clean.evt |
| Size (bytes) | 586,788,480 | 67,890,240 |
| Size | 559.6 MB | 64.7 MB |
| Events in quadrant A | 3,240,159 | 410,978 |
| Events in quadrant B | 3,820,955 | 414,821 |
| Events in quadrant C | 3,340,683 | 402,102 |
| Events in quadrant D | 6,938,512 | 383,718 |
| Mode M9 | |||
|---|---|---|---|
| Quadrant | BADHDUFLAG | Total packets | Discarded packets |
| A | 0 | 10 | 0 |
| B | 0 | 10 | 0 |
| C | 0 | 10 | 0 |
| D | 0 | 10 | 0 |
| Mode M0 | |||
|---|---|---|---|
| Quadrant | BADHDUFLAG | Total packets | Discarded packets |
| A | 0 | 13334 | 1 |
| B | 0 | 15204 | 1 |
| C | 0 | 13578 | 1 |
| D | 0 | 25017 | 1 |
| Mode SS | |||
|---|---|---|---|
| Quadrant | BADHDUFLAG | Total packets | Discarded packets |
| A | 0 | 128 | 0 |
| B | 0 | 128 | 0 |
| C | 0 | 128 | 0 |
| D | 0 | 128 | 0 |
| Quadrant | Total seconds | Saturated seconds | Saturation percentage |
|---|---|---|---|
| A | 6363 | 102 | 1.603017% |
| B | 6363 | 237 | 3.724658% |
| C | 6363 | 158 | 2.483105% |
| D | 6363 | 981 | 15.417256% |
Noise dominated data is calculated using 1-second bins in cleaned event files. If a bin has >2000 counts, and if more than 50% of those come from <1% of pixels, then it is considered to be noise-dominated and hence unusable.
| Quadrant | # 1 sec bins | Bins with >0 counts | Bins with >2000 counts | High rate bins dominated by noise | Noise dominated (total time) | Noise dominated (detector-on time) | Marked lightcurve |
|---|---|---|---|---|---|---|---|
| A | 7338 | 6363 | 0 | 0 | 0.00% | 0.00% | 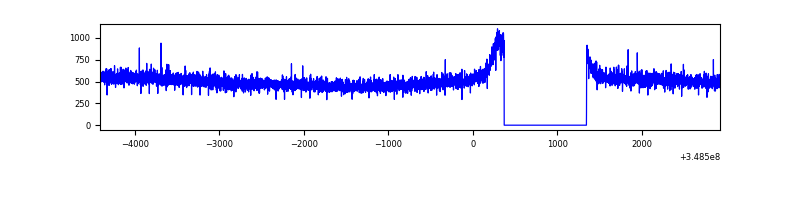 |
| B | 7338 | 6363 | 58 | 58 | 0.79% | 0.91% | 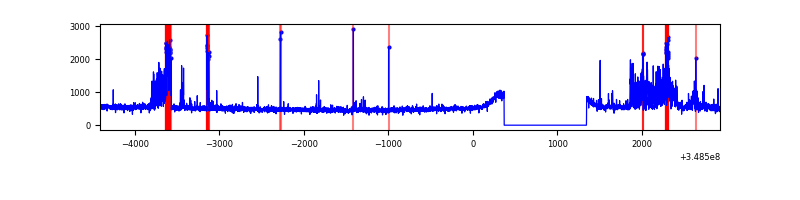 |
| C | 7338 | 6363 | 1 | 1 | 0.01% | 0.02% | 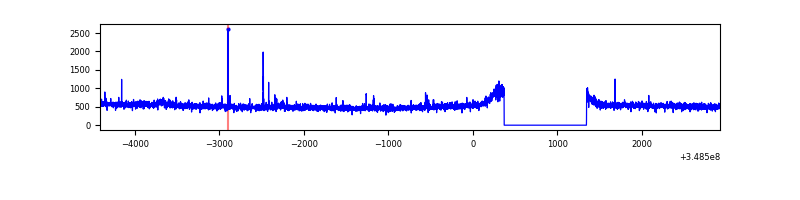 |
| D | 7338 | 6363 | 817 | 817 | 11.13% | 12.84% | 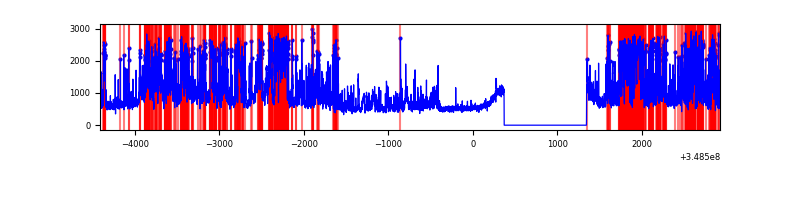 |
Top three noisy pixels from each quadrant. If the there are fewer than three noisy pixels in the level2.evt file, extra rows are filled as -1
| Pixel properties | Quadrant properties | ||||||
|---|---|---|---|---|---|---|---|
| Quadrant | DetID | PixID | Counts | Sigma | Mean | Median | Sigma |
| A | 13 | 254 | 11211 | 61.81 | 838 | 820 | 168.1 |
| A | 3 | 137 | 7830 | 41.7 | 838 | 820 | 168.1 |
| A | 0 | 226 | 7188 | 37.88 | 838 | 820 | 168.1 |
| B | 15 | 33 | 318858 | 2028.36 | 822 | 802 | 156.8 |
| B | 10 | 245 | 256022 | 1627.63 | 822 | 802 | 156.8 |
| B | 12 | 111 | 19000 | 116.06 | 822 | 802 | 156.8 |
| C | 14 | 238 | 138109 | 727.35 | 806 | 812 | 188.8 |
| C | 3 | 233 | 32454 | 167.63 | 806 | 812 | 188.8 |
| C | 2 | 16 | 16335 | 82.23 | 806 | 812 | 188.8 |
| D | 1 | 52 | 3202667 | 17209.1 | 778 | 757 | 186.1 |
| D | 8 | 195 | 396776 | 2128.46 | 778 | 757 | 186.1 |
| D | 2 | 250 | 212252 | 1136.71 | 778 | 757 | 186.1 |
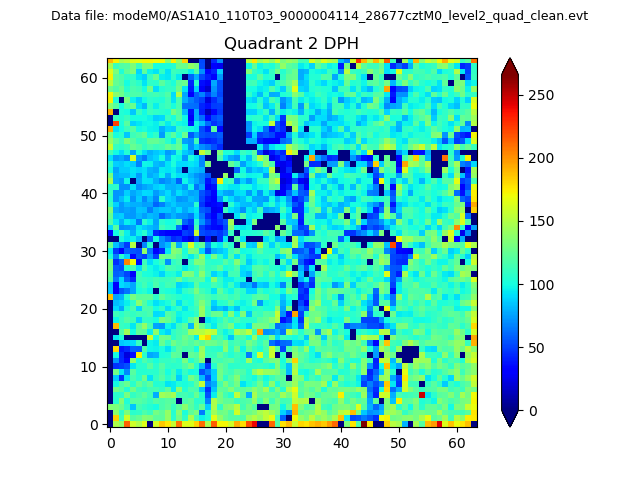
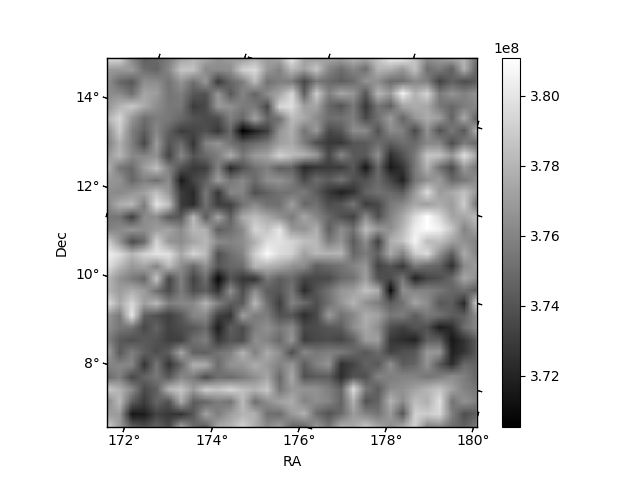
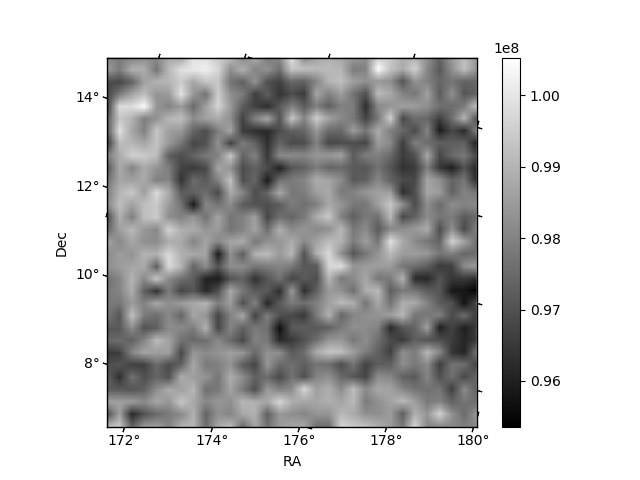
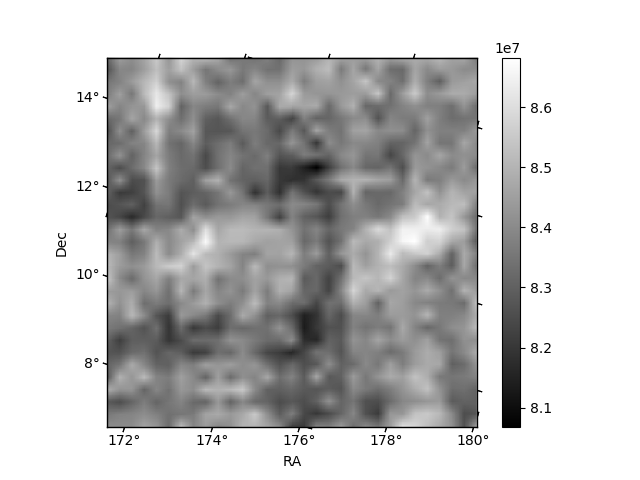
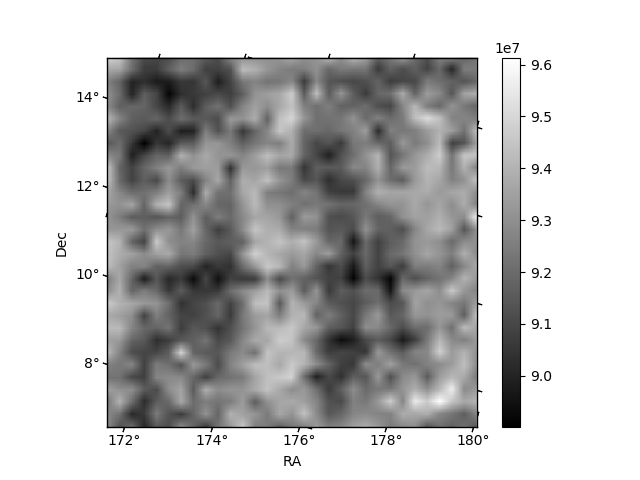
Histogram calculated using DETX and DETY for each event in the final _common_clean file
| Quadrant A | 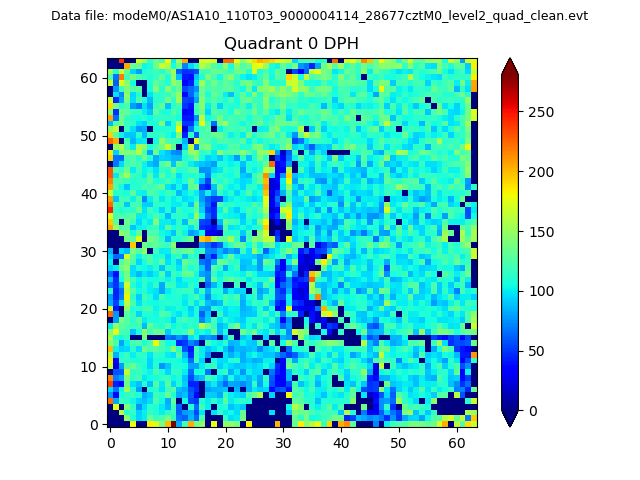 |
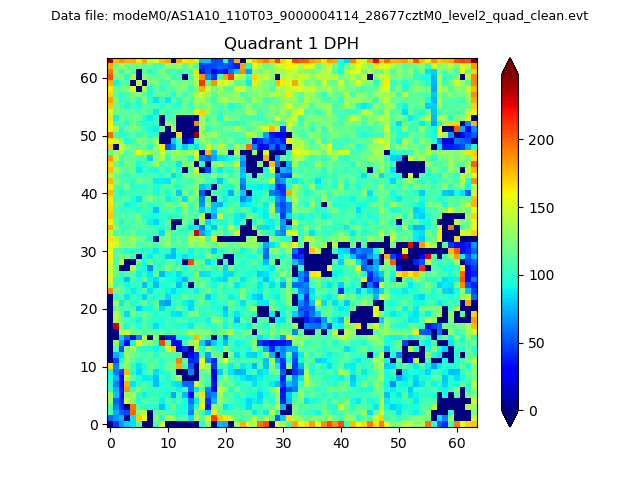 |
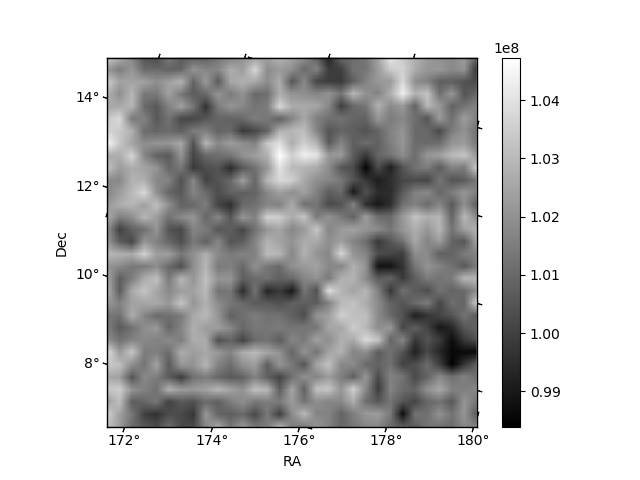
Quadrant B |
|---|---|---|---|
| Quadrant D | 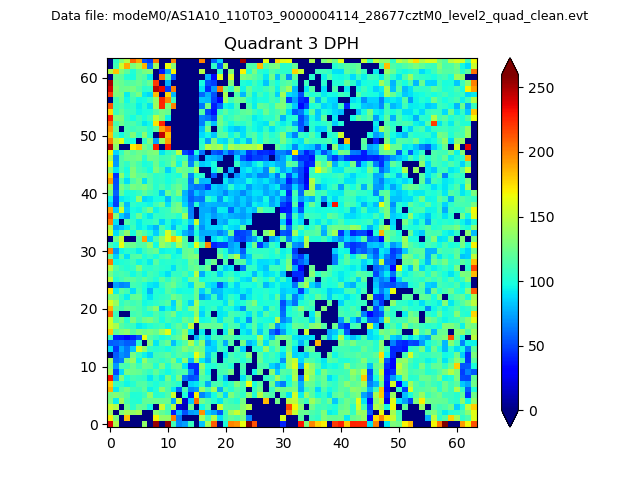 |
 |
Quadrant C |
| Plot type | Count rate plots | Images |
|---|---|---|
| Comparison with Poisson distribution Blue bars denote a histogram of data divided into 1 sec bins. Red curve is a Poisson curve with rate = median count rate of data. |
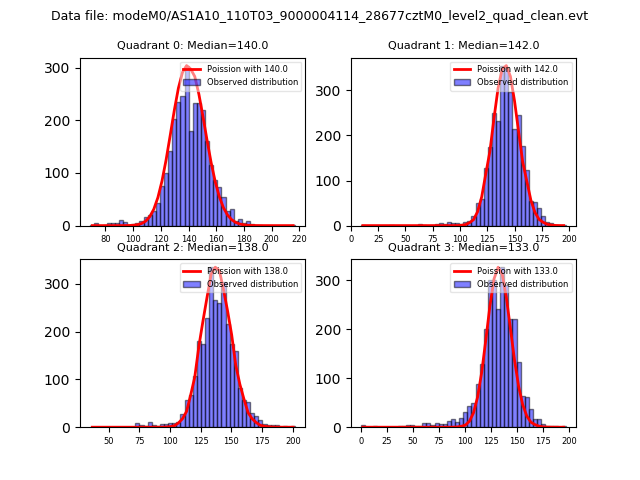 |
 |
| Quadrant-wise count rates Data is divided into 100 sec bins |
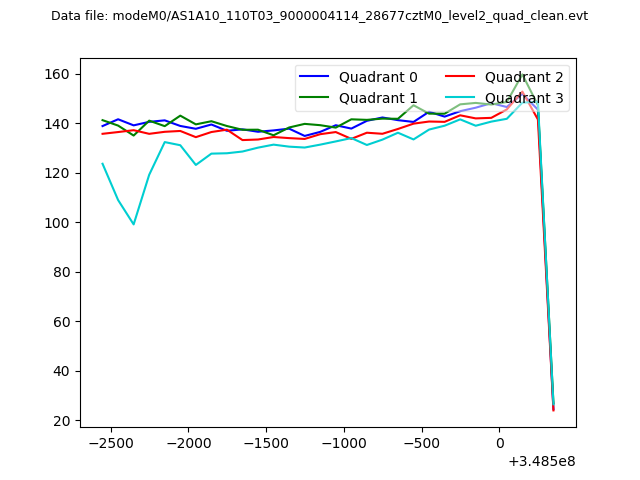 |
|
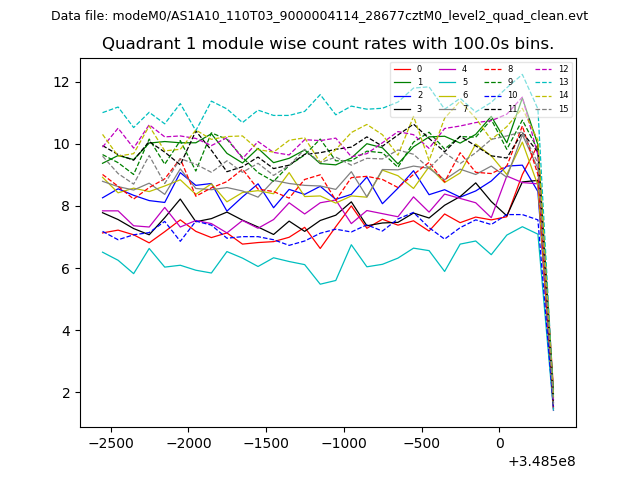
| Module-wise count rates for Quadrant A Data is divided into 100 sec bins |
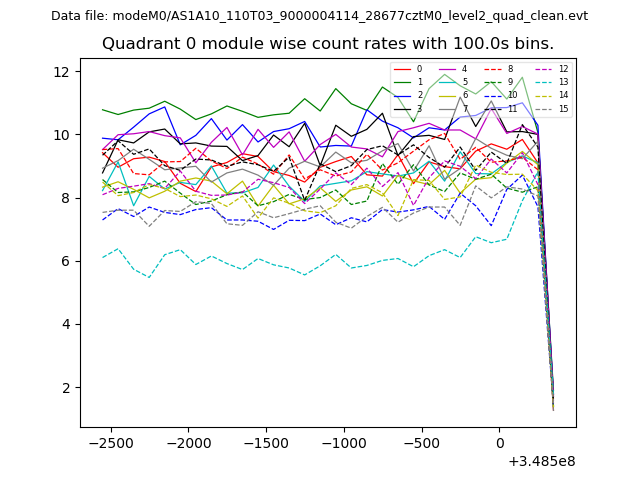 |
 |
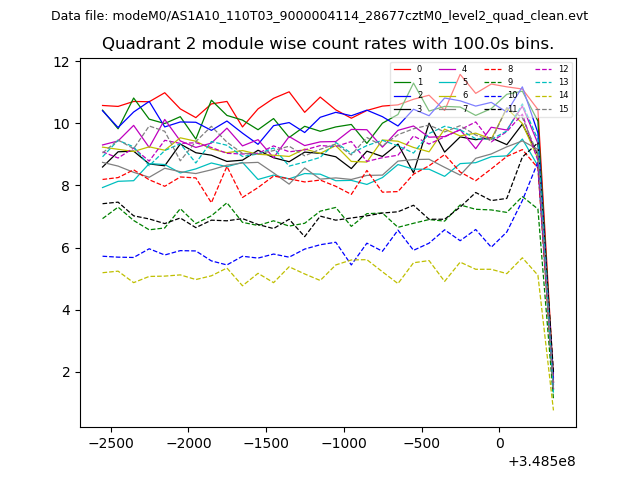
| Module-wise count rates for Quadrant B Data is divided into 100 sec bins |
 |
 |
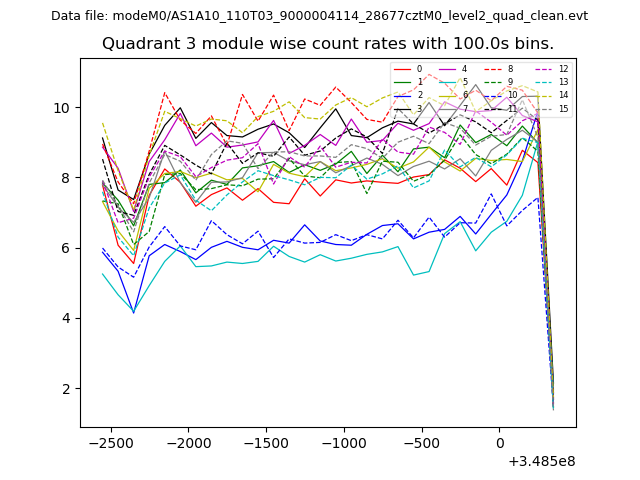
| Module-wise count rates for Quadrant C Data is divided into 100 sec bins |
 |
 |
| Module-wise count rates for Quadrant D Data is divided into 100 sec bins |
 |
 |
| Parameter | Plot |
|---|---|
| CZT HV Monitor | 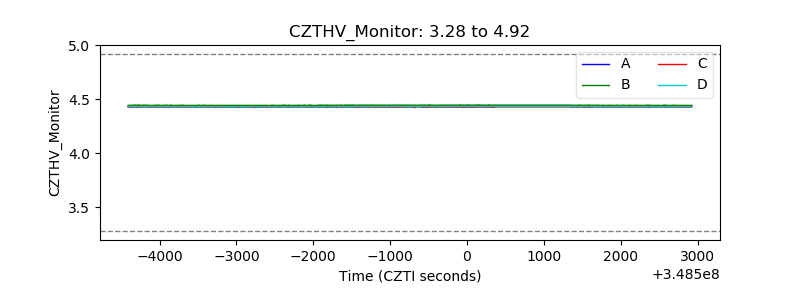 |
| D_VDD | 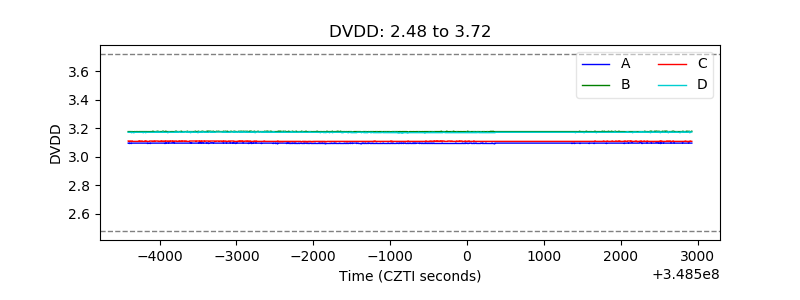 |
| Temperature 1 | 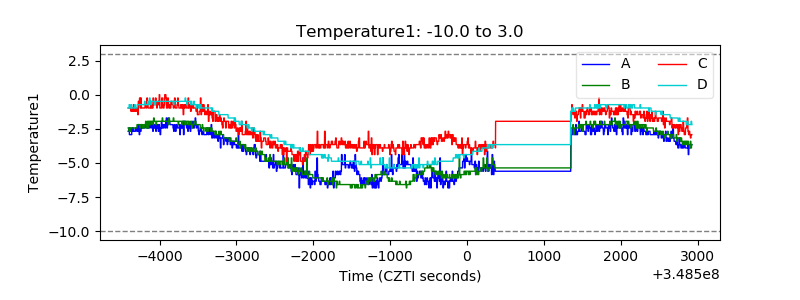 |
| Veto HV Monitor | 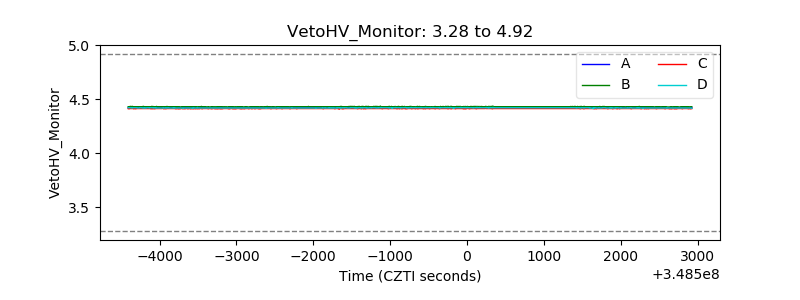 |
| Veto LLD | 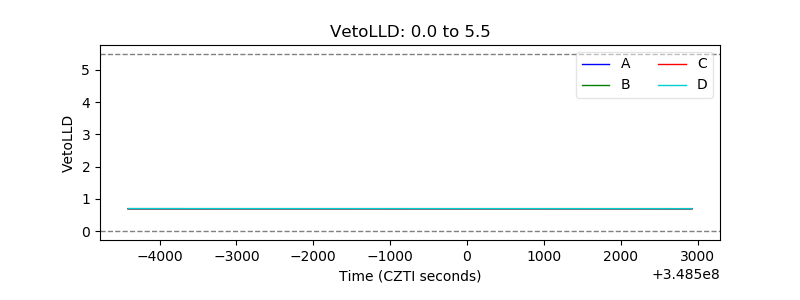 |
| Alpha Counter | 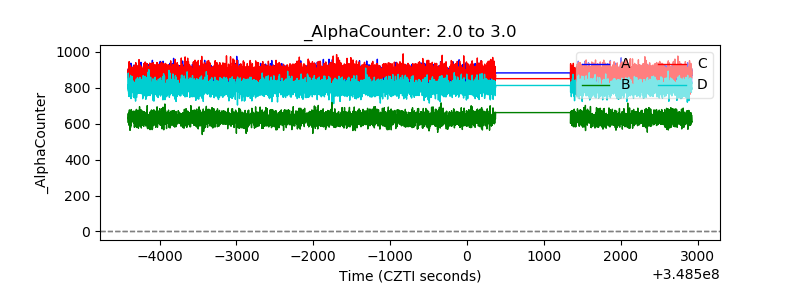 |
| _CPM_Rate | 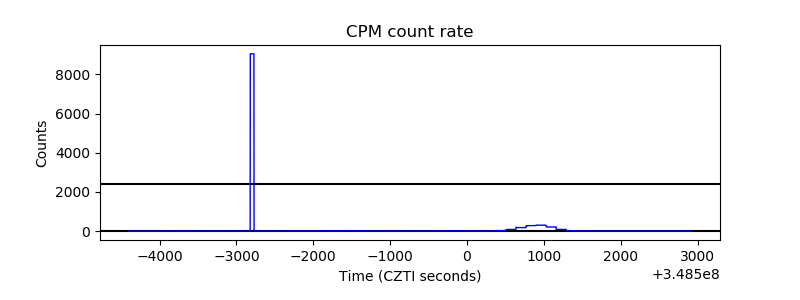 |
| CZT Counter | 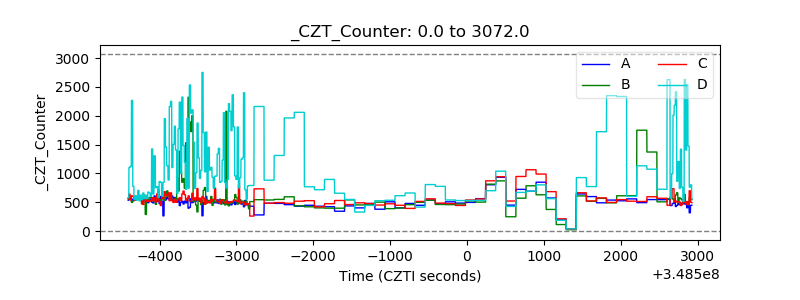 |
| +2.5 Volts monitor |  |
| +5 Volts monitor |  |
| _ROLL_ROT | 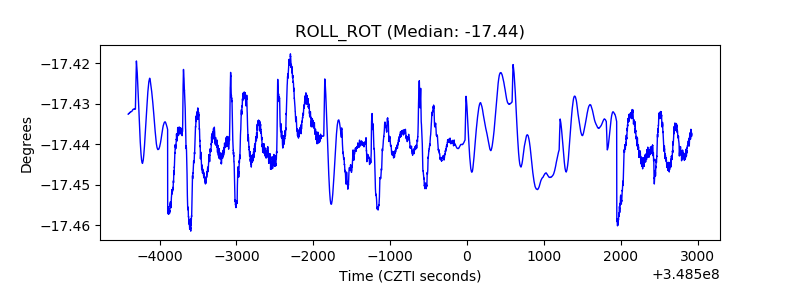 |
| _Roll_DEC | 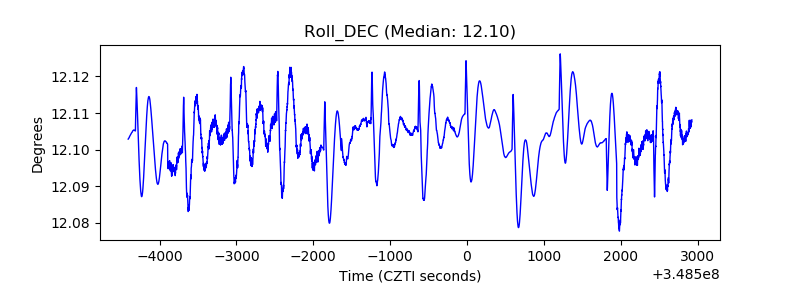 |
| _Roll_RA | 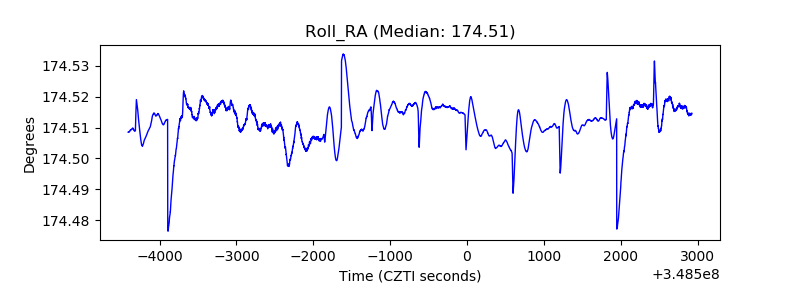 |
| Veto Counter | 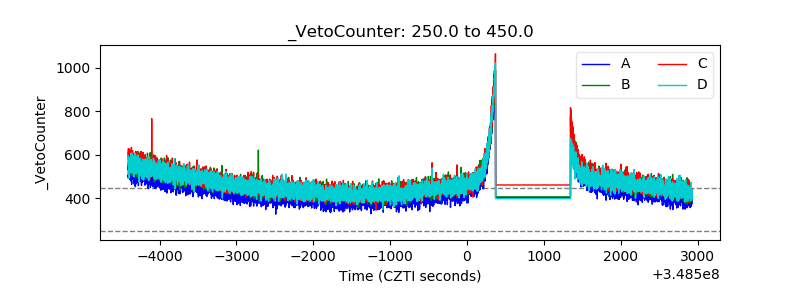 |