| Param | Original file | Final file |
|---|---|---|
| Filename | modeM0/AS1A10_110T03_9000004114_28679cztM0_level2.evt | modeM0/AS1A10_110T03_9000004114_28679cztM0_level2_quad_clean.evt |
| Size (bytes) | 652,345,920 | 82,362,240 |
| Size | 622.1 MB | 78.5 MB |
| Events in quadrant A | 3,604,606 | 504,904 |
| Events in quadrant B | 3,986,829 | 510,530 |
| Events in quadrant C | 3,906,588 | 491,126 |
| Events in quadrant D | 7,754,472 | 469,644 |
| Mode M9 | |||
|---|---|---|---|
| Quadrant | BADHDUFLAG | Total packets | Discarded packets |
| A | 0 | 2 | 0 |
| B | 0 | 2 | 0 |
| C | 0 | 2 | 0 |
| D | 0 | 2 | 0 |
| Mode M0 | |||
|---|---|---|---|
| Quadrant | BADHDUFLAG | Total packets | Discarded packets |
| A | 0 | 15397 | 1 |
| B | 0 | 16566 | 1 |
| C | 0 | 16238 | 1 |
| D | 0 | 28127 | 4 |
| Mode SS | |||
|---|---|---|---|
| Quadrant | BADHDUFLAG | Total packets | Discarded packets |
| A | 0 | 150 | 0 |
| B | 0 | 150 | 0 |
| C | 0 | 150 | 0 |
| D | 0 | 150 | 0 |
| Quadrant | Total seconds | Saturated seconds | Saturation percentage |
|---|---|---|---|
| A | 7442 | 82 | 1.101854% |
| B | 7442 | 246 | 3.305563% |
| C | 7443 | 380 | 5.105468% |
| D | 7442 | 1128 | 15.157216% |
Noise dominated data is calculated using 1-second bins in cleaned event files. If a bin has >2000 counts, and if more than 50% of those come from <1% of pixels, then it is considered to be noise-dominated and hence unusable.
| Quadrant | # 1 sec bins | Bins with >0 counts | Bins with >2000 counts | High rate bins dominated by noise | Noise dominated (total time) | Noise dominated (detector-on time) | Marked lightcurve |
|---|---|---|---|---|---|---|---|
| A | 7607 | 7443 | 0 | 0 | 0.00% | 0.00% | 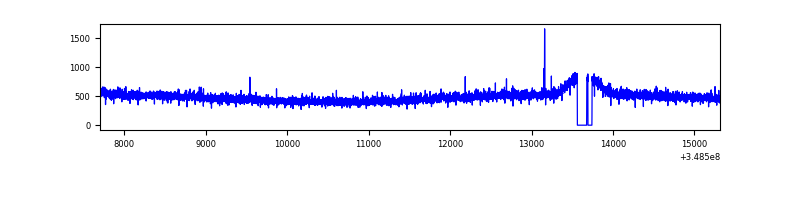 |
| B | 7607 | 7442 | 0 | 0 | 0.00% | 0.00% | 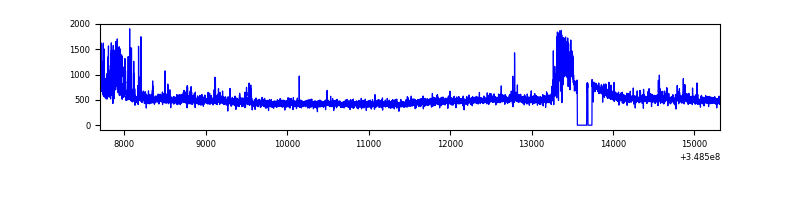 |
| C | 7608 | 7443 | 0 | 0 | 0.00% | 0.00% | 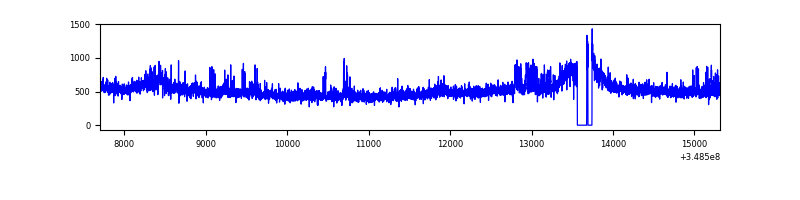 |
| D | 7607 | 7442 | 894 | 894 | 11.75% | 12.01% | 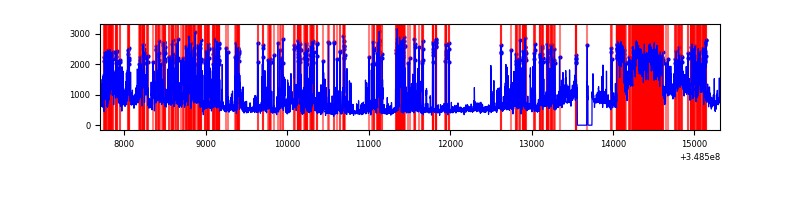 |
Top three noisy pixels from each quadrant. If the there are fewer than three noisy pixels in the level2.evt file, extra rows are filled as -1
| Pixel properties | Quadrant properties | ||||||
|---|---|---|---|---|---|---|---|
| Quadrant | DetID | PixID | Counts | Sigma | Mean | Median | Sigma |
| A | 13 | 254 | 13247 | 64.78 | 932 | 910 | 190.4 |
| A | 3 | 137 | 8999 | 42.48 | 932 | 910 | 190.4 |
| A | 0 | 226 | 7728 | 35.8 | 932 | 910 | 190.4 |
| B | 15 | 33 | 309214 | 1753.53 | 918 | 895 | 175.8 |
| B | 10 | 245 | 55868 | 312.65 | 918 | 895 | 175.8 |
| B | 12 | 111 | 22075 | 120.46 | 918 | 895 | 175.8 |
| C | 14 | 238 | 208337 | 995.11 | 887 | 893 | 208.5 |
| C | 3 | 233 | 144602 | 689.38 | 887 | 893 | 208.5 |
| C | 14 | 254 | 95086 | 451.85 | 887 | 893 | 208.5 |
| D | 1 | 52 | 2529032 | 12224.03 | 863 | 840 | 206.8 |
| D | 7 | 80 | 1323629 | 6395.8 | 863 | 840 | 206.8 |
| D | 8 | 195 | 485547 | 2343.6 | 863 | 840 | 206.8 |
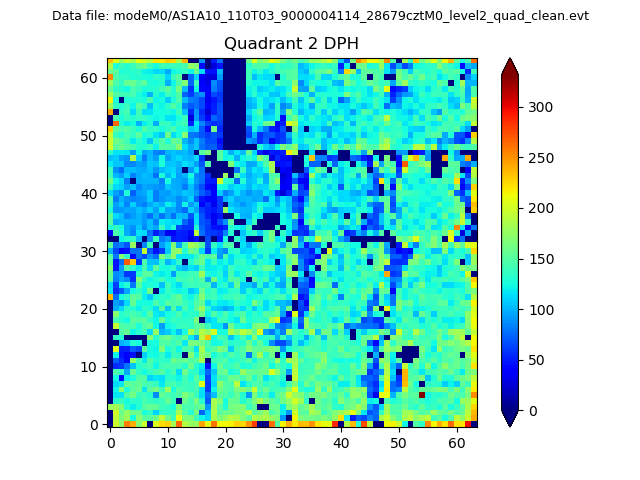
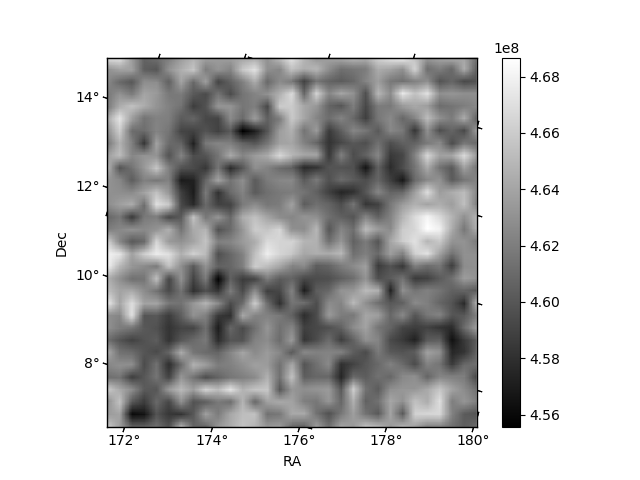
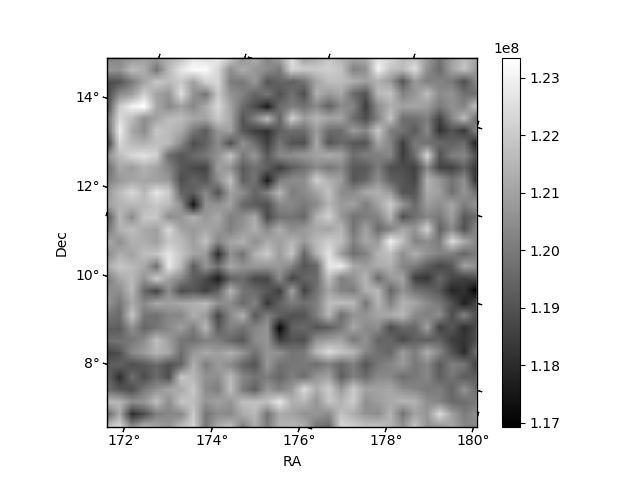
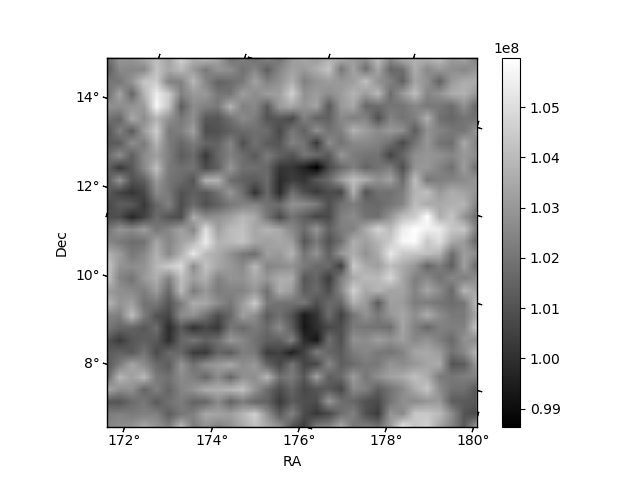
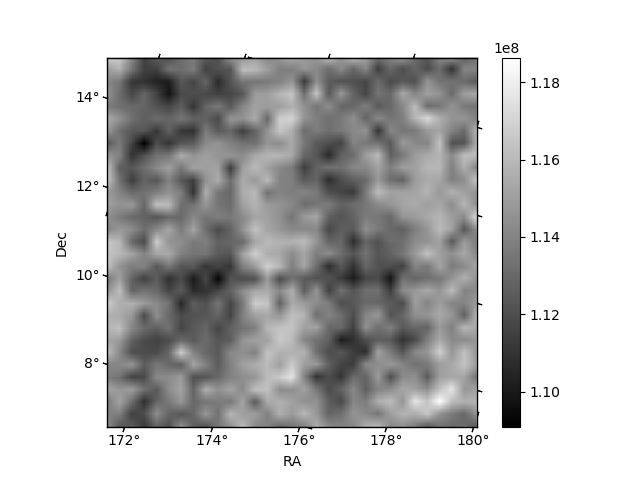
Histogram calculated using DETX and DETY for each event in the final _common_clean file
| Quadrant A | 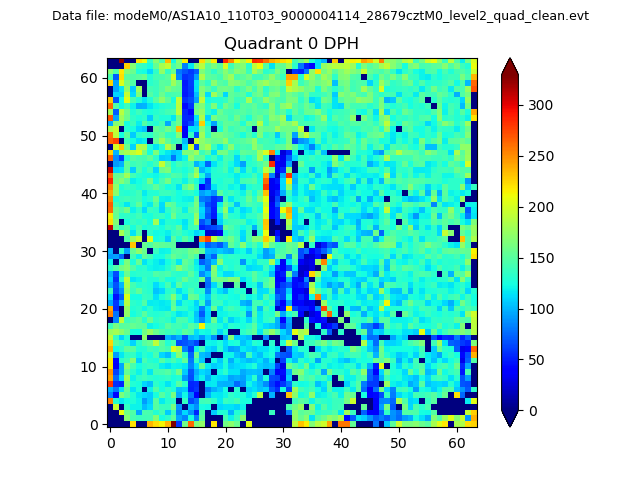 |
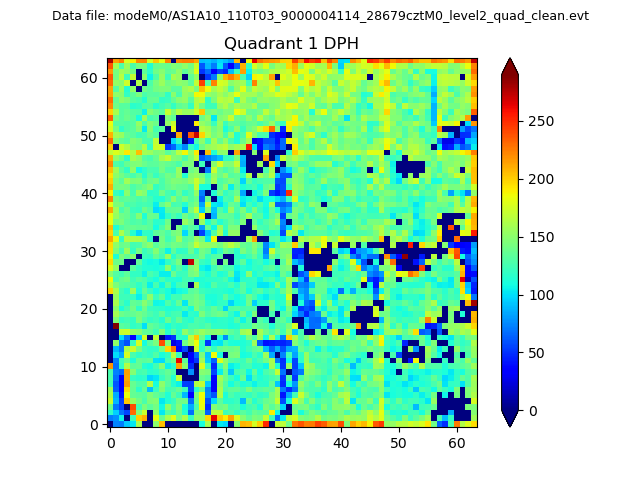 |
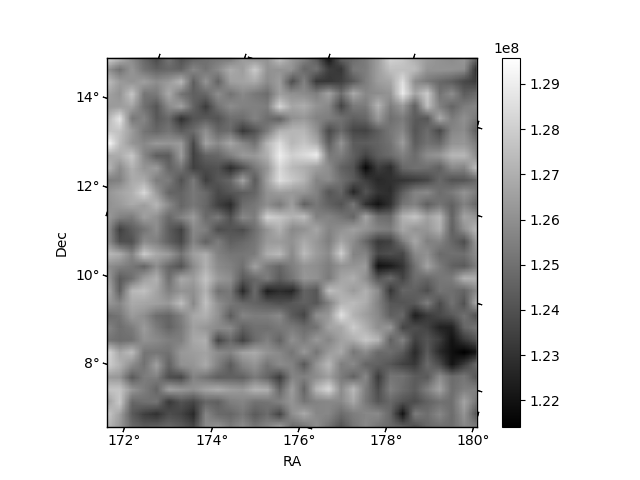
Quadrant B |
|---|---|---|---|
| Quadrant D | 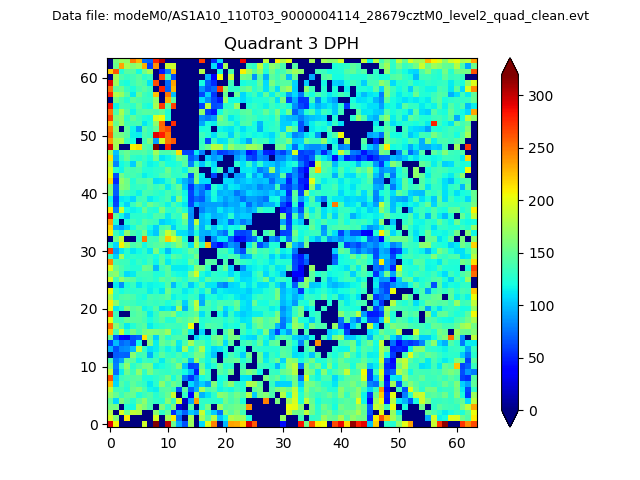 |
 |
Quadrant C |
| Plot type | Count rate plots | Images |
|---|---|---|
| Comparison with Poisson distribution Blue bars denote a histogram of data divided into 1 sec bins. Red curve is a Poisson curve with rate = median count rate of data. |
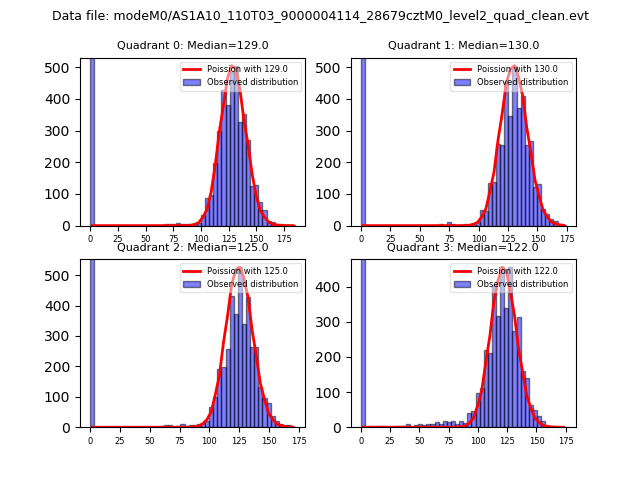 |
 |
| Quadrant-wise count rates Data is divided into 100 sec bins |
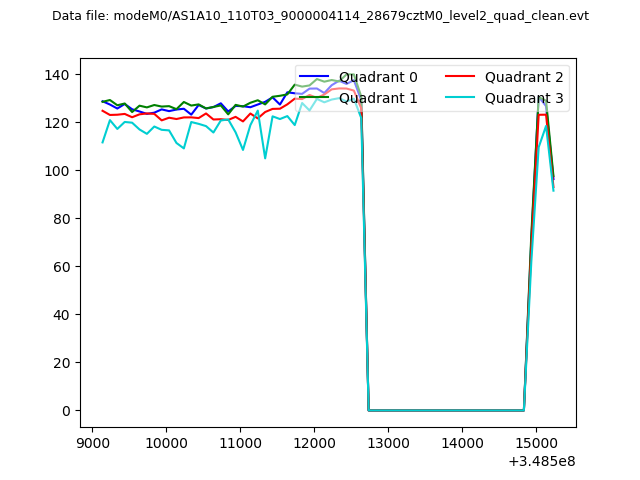 |
|
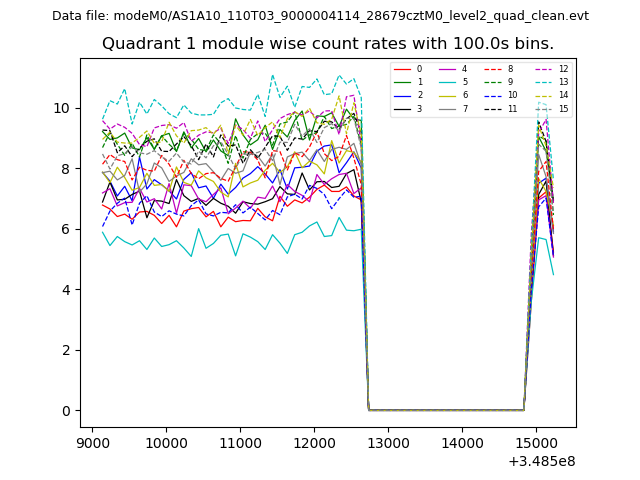
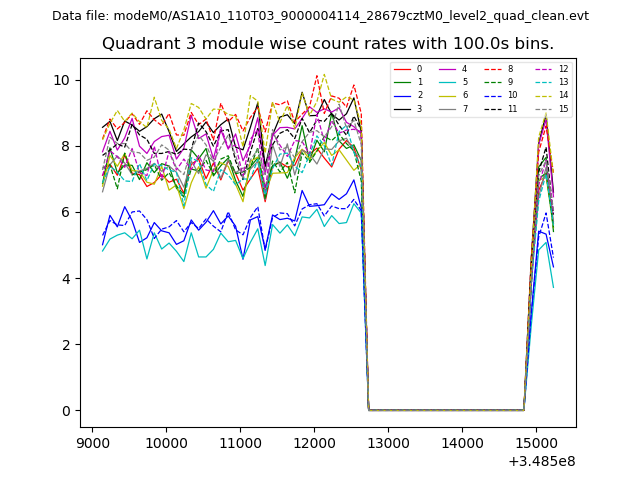
| Module-wise count rates for Quadrant A Data is divided into 100 sec bins |
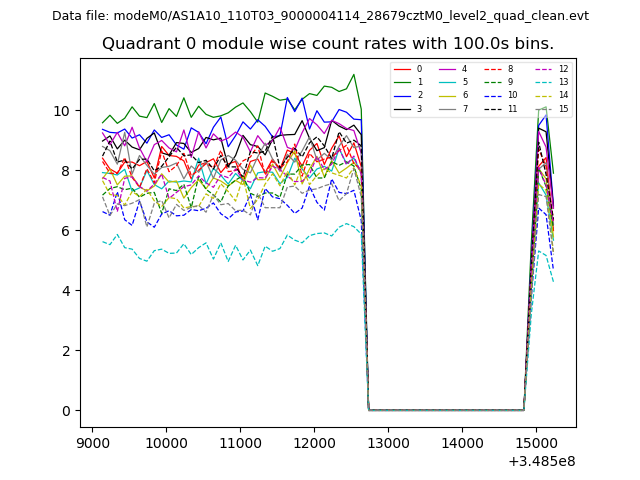 |
 |
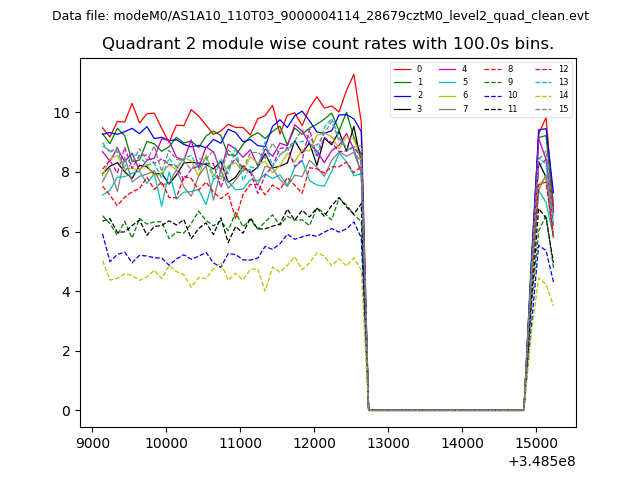
| Module-wise count rates for Quadrant B Data is divided into 100 sec bins |
 |
 |
| Module-wise count rates for Quadrant C Data is divided into 100 sec bins |
 |
 |
| Module-wise count rates for Quadrant D Data is divided into 100 sec bins |
 |
 |
| Parameter | Plot |
|---|---|
| CZT HV Monitor | 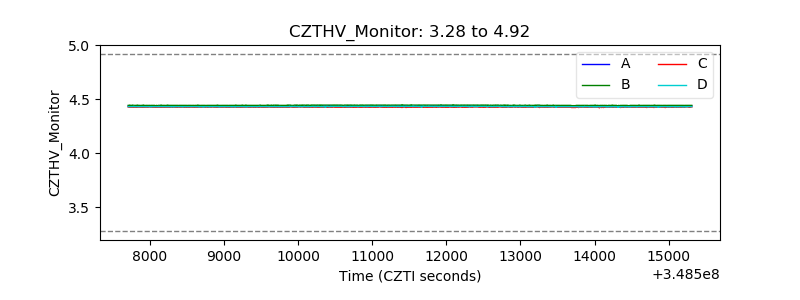 |
| D_VDD | 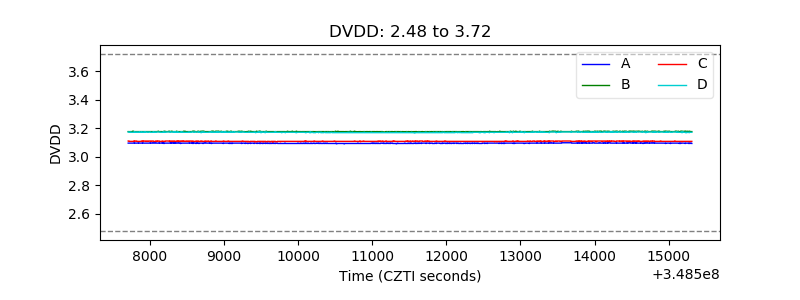 |
| Temperature 1 | 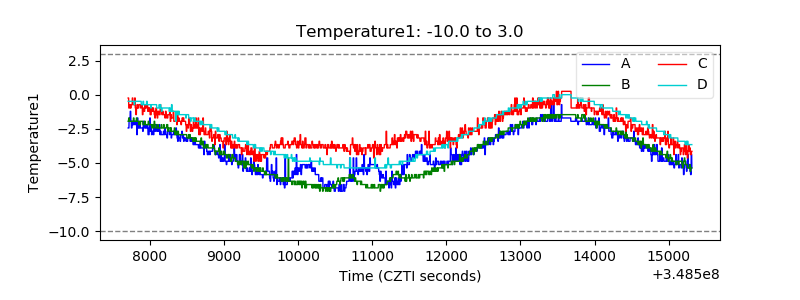 |
| Veto HV Monitor | 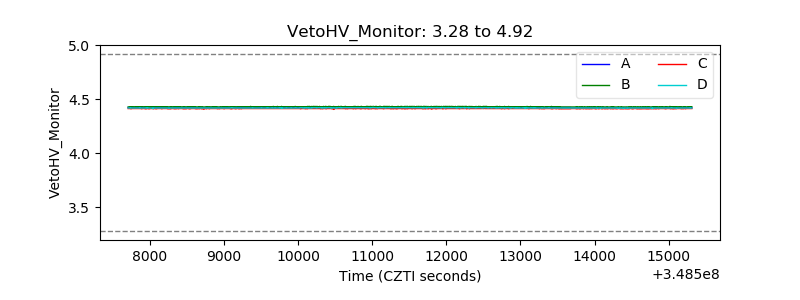 |
| Veto LLD | 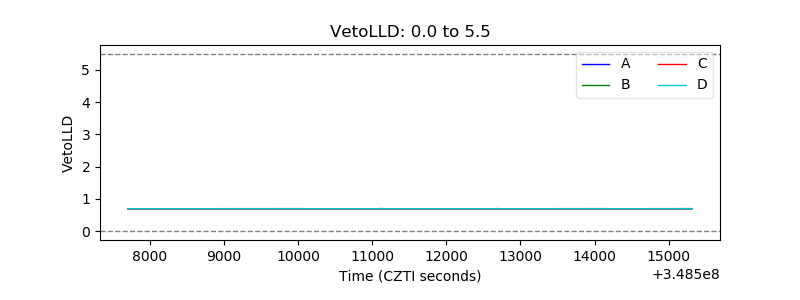 |
| Alpha Counter | 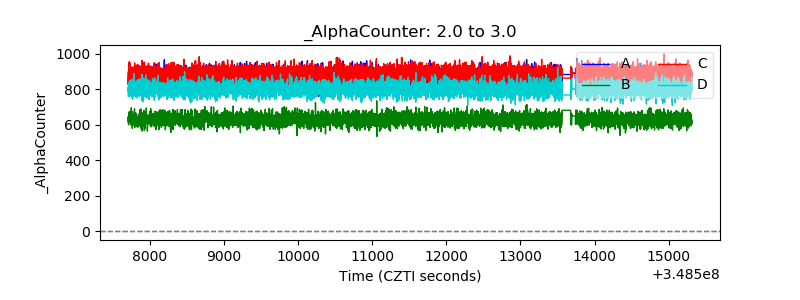 |
| _CPM_Rate | 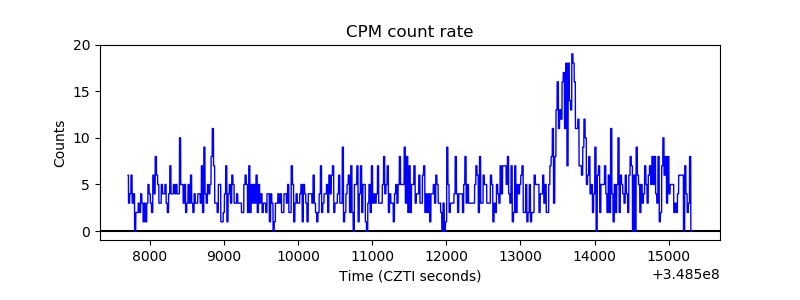 |
| CZT Counter | 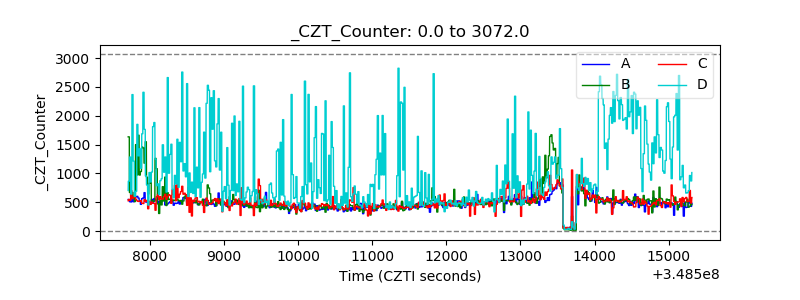 |
| +2.5 Volts monitor |  |
| +5 Volts monitor |  |
| _ROLL_ROT | 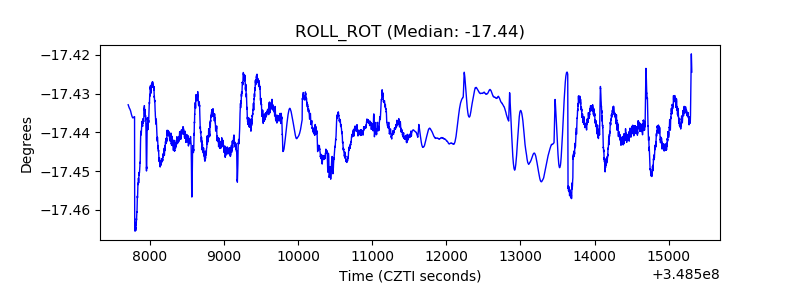 |
| _Roll_DEC | 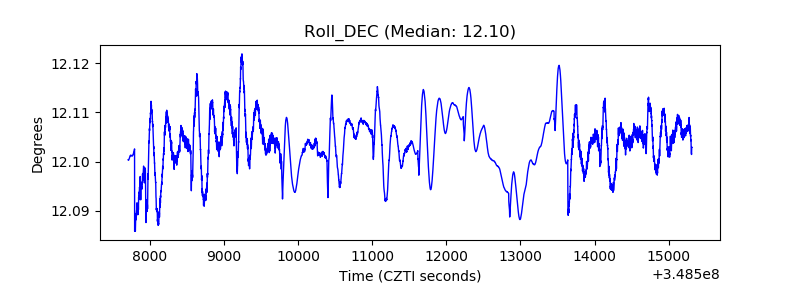 |
| _Roll_RA |  |
| Veto Counter | 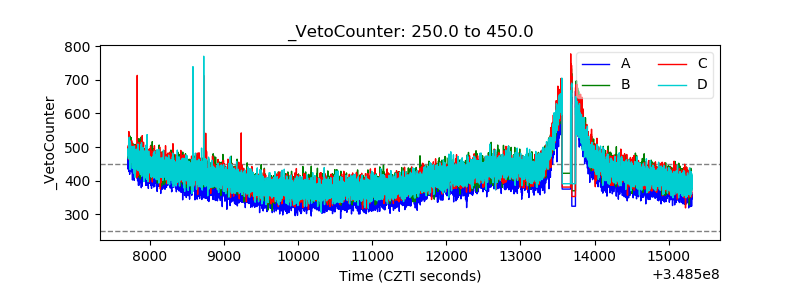 |