| Param | Original file | Final file |
|---|---|---|
| Filename | modeM0/AS1A10_110T03_9000004114_28680cztM0_level2.evt | modeM0/AS1A10_110T03_9000004114_28680cztM0_level2_quad_clean.evt |
| Size (bytes) | 767,136,960 | 91,206,720 |
| Size | 731.6 MB | 87.0 MB |
| Events in quadrant A | 4,008,600 | 562,629 |
| Events in quadrant B | 4,231,636 | 570,295 |
| Events in quadrant C | 5,028,174 | 545,418 |
| Events in quadrant D | 9,413,782 | 517,284 |
| Mode M9 | |||
|---|---|---|---|
| Quadrant | BADHDUFLAG | Total packets | Discarded packets |
| A | 0 | 5 | 0 |
| B | 0 | 5 | 0 |
| C | 0 | 5 | 0 |
| D | 0 | 5 | 0 |
| Mode M0 | |||
|---|---|---|---|
| Quadrant | BADHDUFLAG | Total packets | Discarded packets |
| A | 0 | 17159 | 2 |
| B | 0 | 17782 | 2 |
| C | 0 | 20281 | 2 |
| D | 0 | 33798 | 2 |
| Mode SS | |||
|---|---|---|---|
| Quadrant | BADHDUFLAG | Total packets | Discarded packets |
| A | 0 | 166 | 0 |
| B | 0 | 166 | 0 |
| C | 0 | 166 | 0 |
| D | 0 | 166 | 0 |
| Quadrant | Total seconds | Saturated seconds | Saturation percentage |
|---|---|---|---|
| A | 8150 | 103 | 1.263804% |
| B | 8151 | 284 | 3.484235% |
| C | 8151 | 495 | 6.072874% |
| D | 8151 | 918 | 11.262422% |
Noise dominated data is calculated using 1-second bins in cleaned event files. If a bin has >2000 counts, and if more than 50% of those come from <1% of pixels, then it is considered to be noise-dominated and hence unusable.
| Quadrant | # 1 sec bins | Bins with >0 counts | Bins with >2000 counts | High rate bins dominated by noise | Noise dominated (total time) | Noise dominated (detector-on time) | Marked lightcurve |
|---|---|---|---|---|---|---|---|
| A | 8575 | 8152 | 0 | 0 | 0.00% | 0.00% | 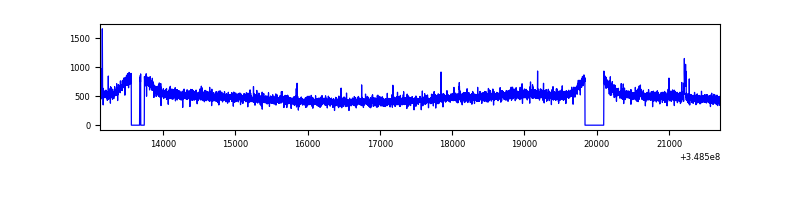 |
| B | 8576 | 8151 | 0 | 0 | 0.00% | 0.00% | 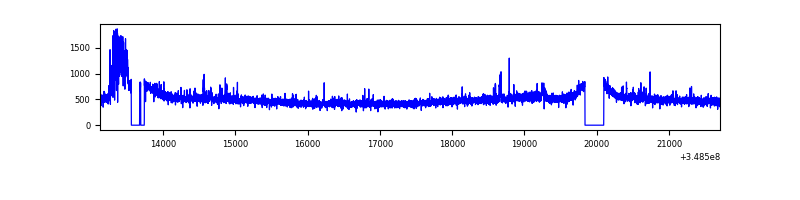 |
| C | 8576 | 8151 | 1 | 1 | 0.01% | 0.01% | 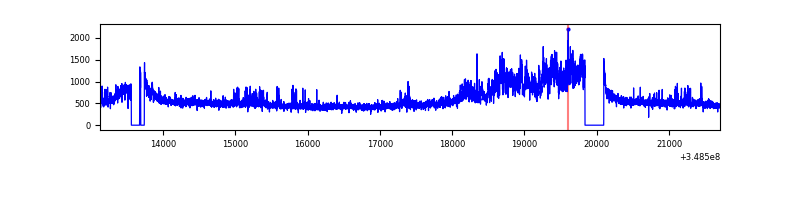 |
| D | 8576 | 8152 | 825 | 825 | 9.62% | 10.12% | 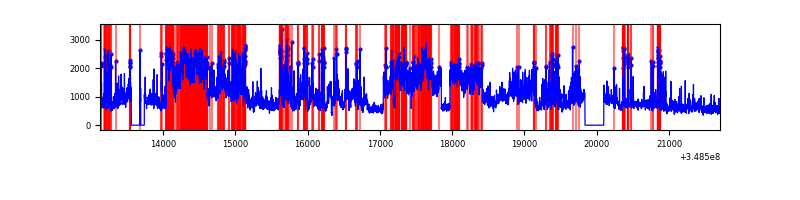 |
Top three noisy pixels from each quadrant. If the there are fewer than three noisy pixels in the level2.evt file, extra rows are filled as -1
| Pixel properties | Quadrant properties | ||||||
|---|---|---|---|---|---|---|---|
| Quadrant | DetID | PixID | Counts | Sigma | Mean | Median | Sigma |
| A | 15 | 174 | 29180 | 134.21 | 1031 | 1007 | 209.9 |
| A | 13 | 254 | 14814 | 65.77 | 1031 | 1007 | 209.9 |
| A | 3 | 137 | 10161 | 43.61 | 1031 | 1007 | 209.9 |
| B | 15 | 33 | 175959 | 888.95 | 1018 | 991 | 196.8 |
| B | 10 | 245 | 25889 | 126.5 | 1018 | 991 | 196.8 |
| B | 12 | 111 | 24386 | 118.86 | 1018 | 991 | 196.8 |
| C | 3 | 233 | 955016 | 4154.1 | 978 | 983 | 229.7 |
| C | 14 | 238 | 197066 | 853.79 | 978 | 983 | 229.7 |
| C | 14 | 254 | 64505 | 276.59 | 978 | 983 | 229.7 |
| D | 7 | 80 | 2578624 | 11044.37 | 970 | 941 | 233.4 |
| D | 8 | 195 | 1996257 | 8549.15 | 970 | 941 | 233.4 |
| D | 1 | 52 | 937728 | 4013.77 | 970 | 941 | 233.4 |
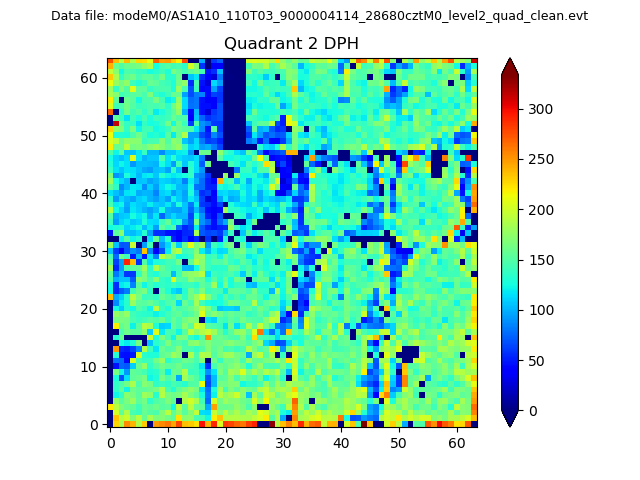
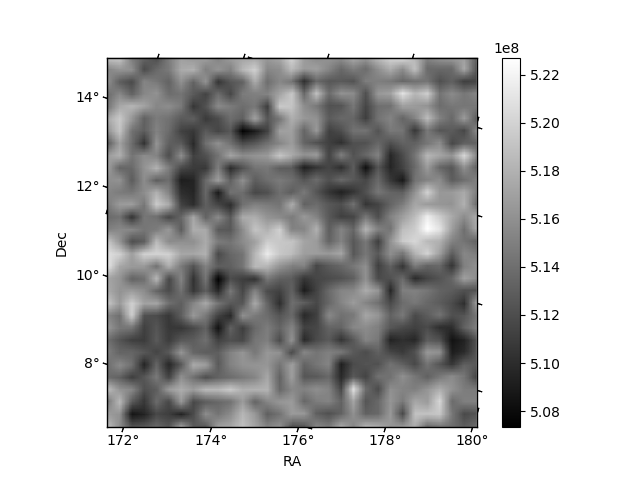
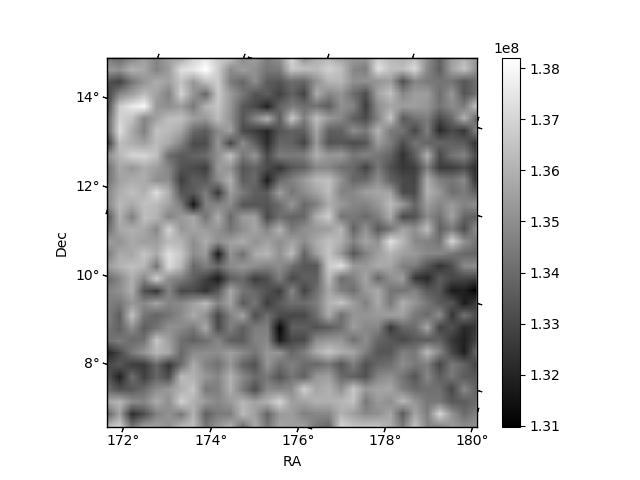
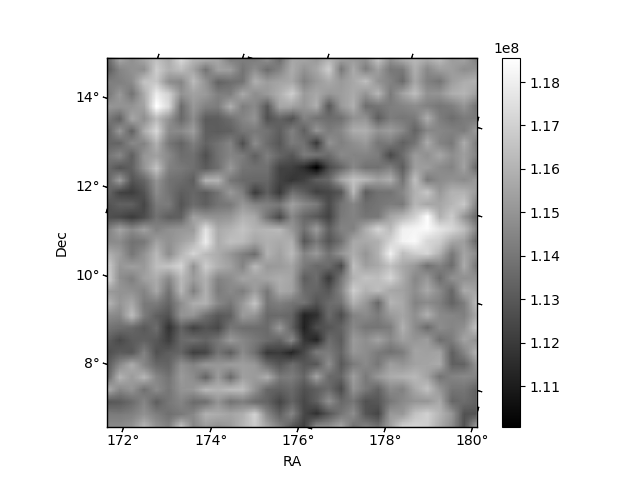
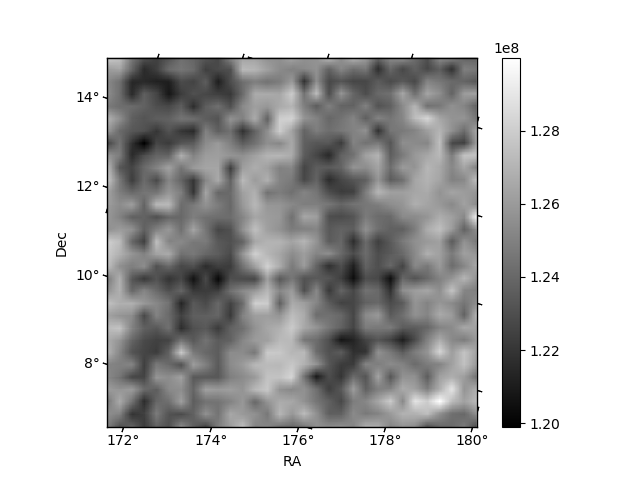
Histogram calculated using DETX and DETY for each event in the final _common_clean file
| Quadrant A | 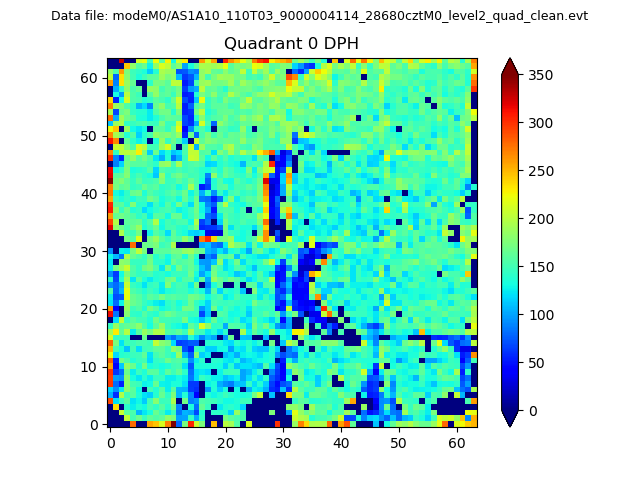 |
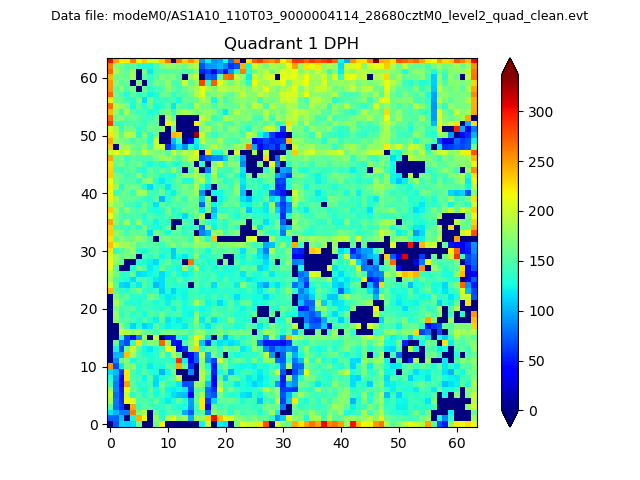 |
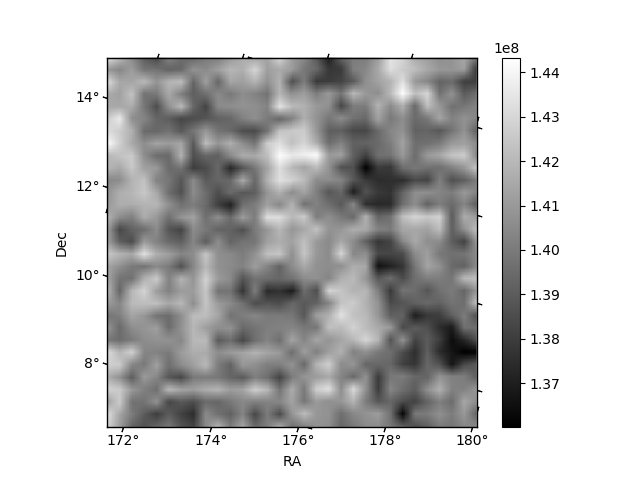
Quadrant B |
|---|---|---|---|
| Quadrant D | 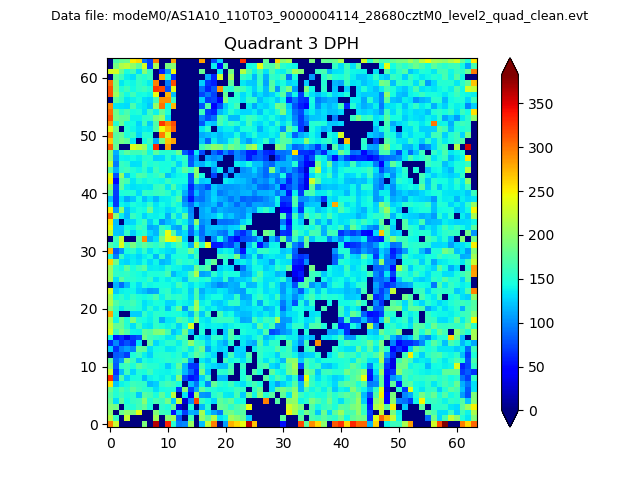 |
 |
Quadrant C |
| Plot type | Count rate plots | Images |
|---|---|---|
| Comparison with Poisson distribution Blue bars denote a histogram of data divided into 1 sec bins. Red curve is a Poisson curve with rate = median count rate of data. |
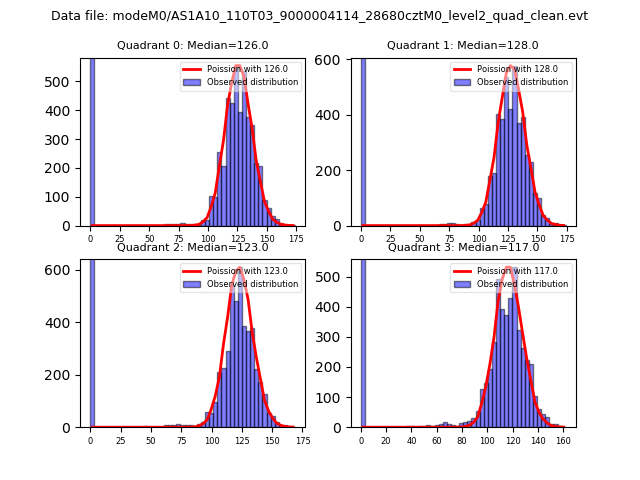 |
 |
| Quadrant-wise count rates Data is divided into 100 sec bins |
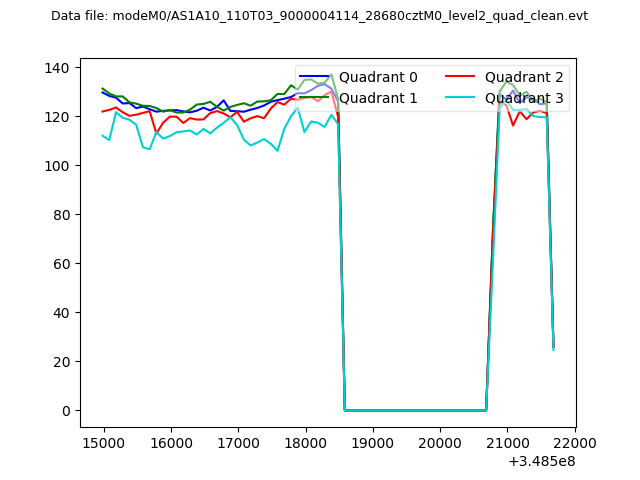 |
|
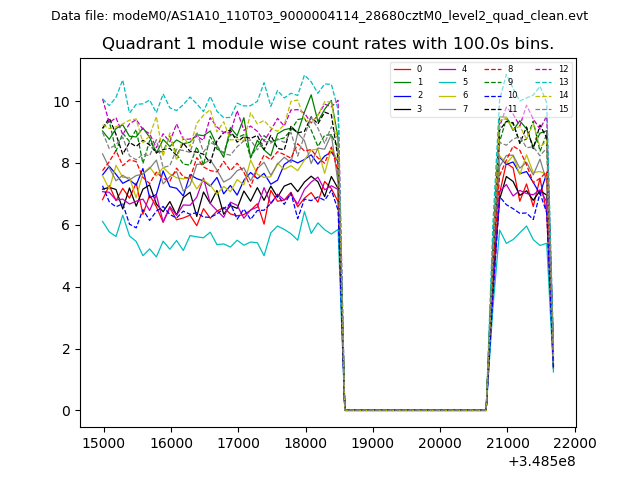
| Module-wise count rates for Quadrant A Data is divided into 100 sec bins |
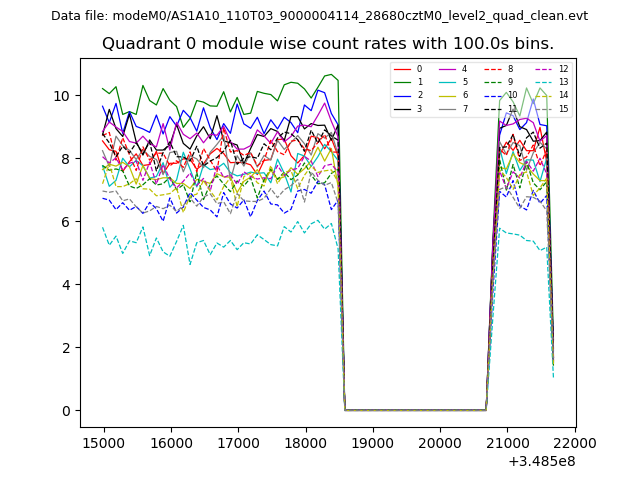 |
 |
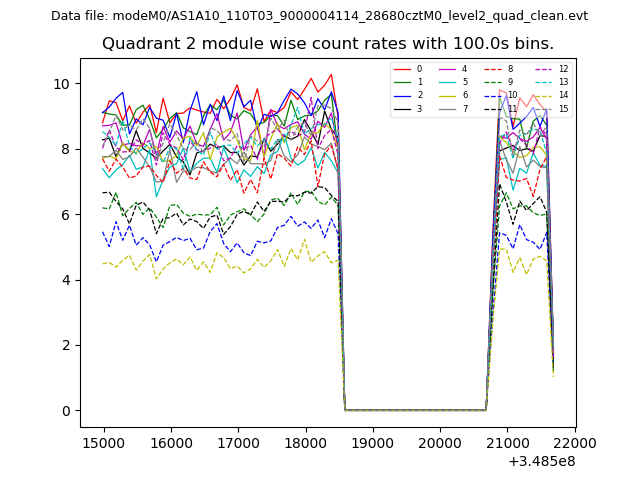
| Module-wise count rates for Quadrant B Data is divided into 100 sec bins |
 |
 |
| Module-wise count rates for Quadrant C Data is divided into 100 sec bins |
 |
 |
| Module-wise count rates for Quadrant D Data is divided into 100 sec bins |
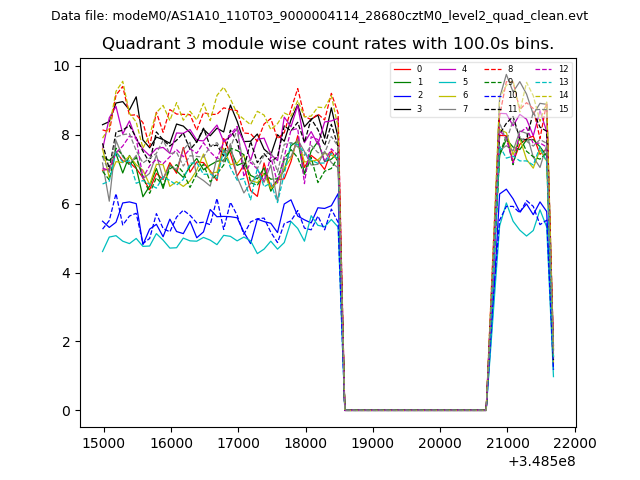 |
 |
| Parameter | Plot |
|---|---|
| CZT HV Monitor | 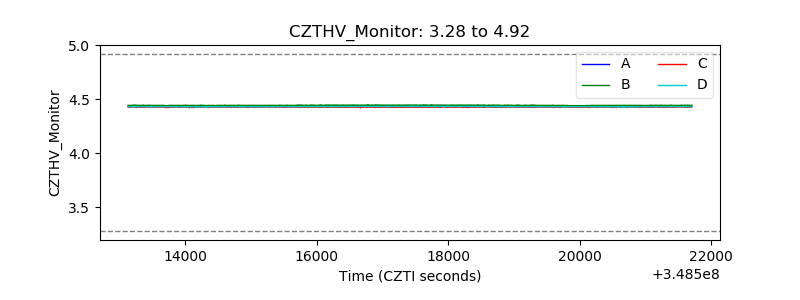 |
| D_VDD | 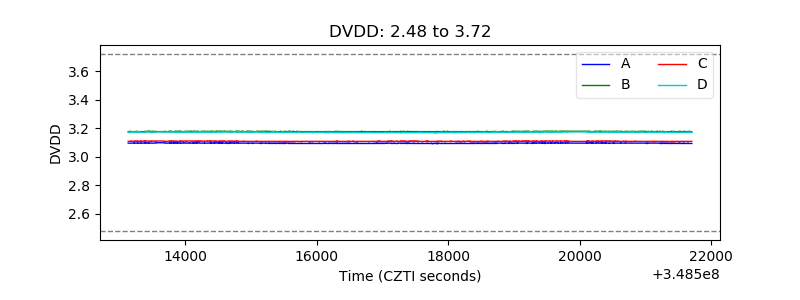 |
| Temperature 1 |  |
| Veto HV Monitor |  |
| Veto LLD | 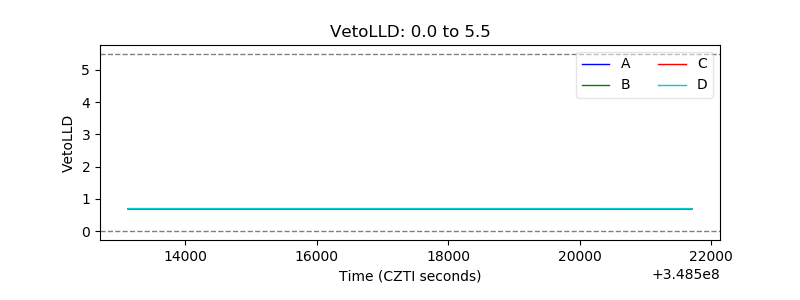 |
| Alpha Counter | 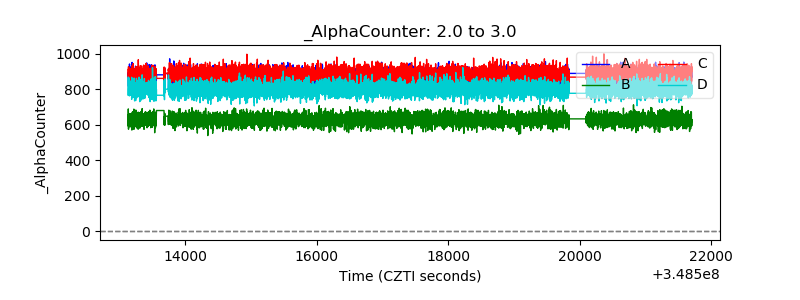 |
| _CPM_Rate | 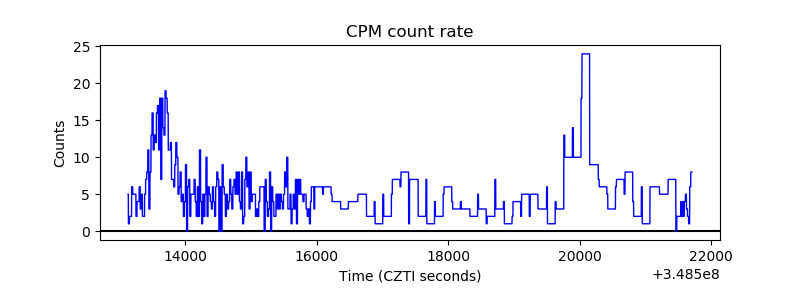 |
| CZT Counter | 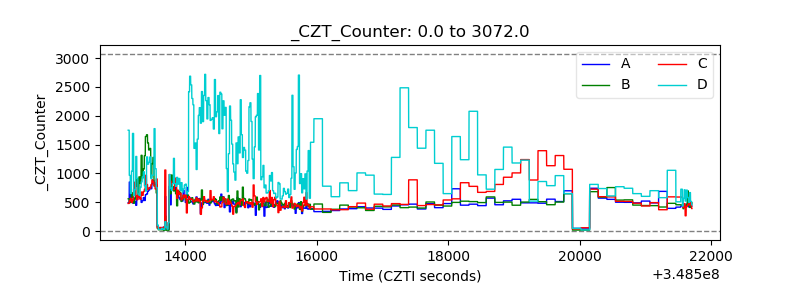 |
| +2.5 Volts monitor |  |
| +5 Volts monitor |  |
| _ROLL_ROT | 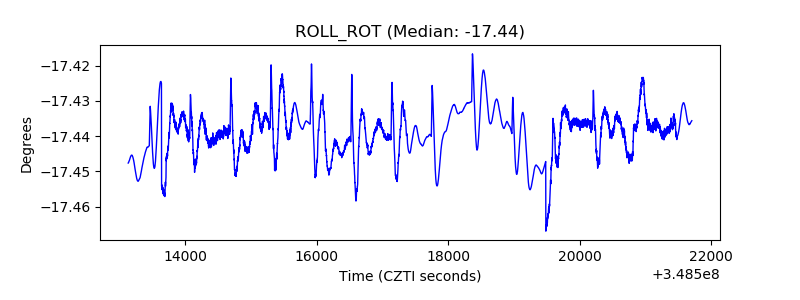 |
| _Roll_DEC | 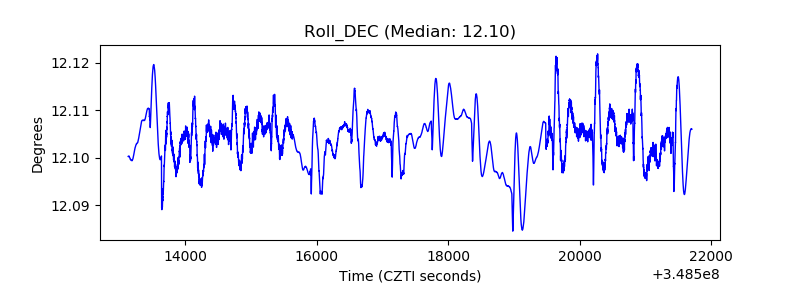 |
| _Roll_RA | 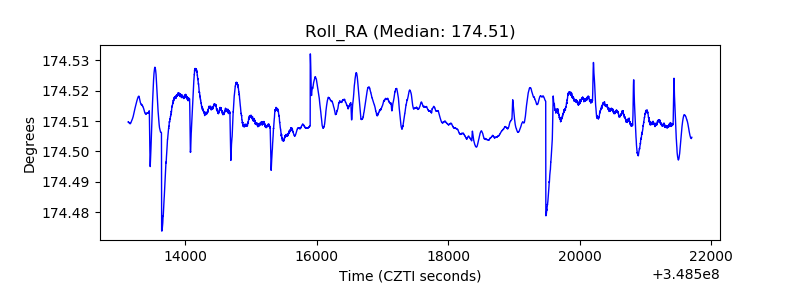 |
| Veto Counter | 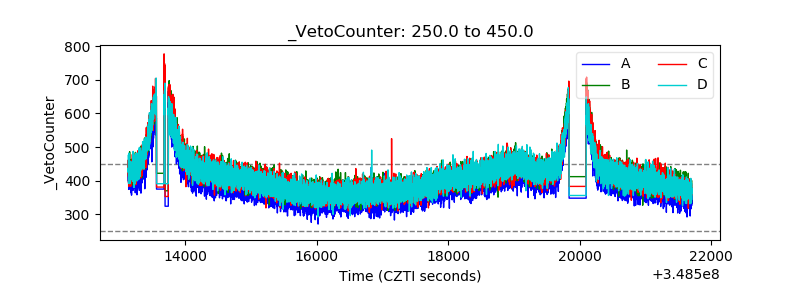 |