| Param | Original file | Final file |
|---|---|---|
| Filename | modeM0/AS1A10_110T03_9000004114_28684cztM0_level2.evt | modeM0/AS1A10_110T03_9000004114_28684cztM0_level2_quad_clean.evt |
| Size (bytes) | 620,233,920 | 92,816,640 |
| Size | 591.5 MB | 88.5 MB |
| Events in quadrant A | 3,508,147 | 591,178 |
| Events in quadrant B | 3,680,291 | 597,884 |
| Events in quadrant C | 3,921,248 | 572,315 |
| Events in quadrant D | 7,178,473 | 540,228 |
| Mode M9 | |||
|---|---|---|---|
| Quadrant | BADHDUFLAG | Total packets | Discarded packets |
| A | 0 | 4 | 0 |
| B | 0 | 5 | 0 |
| C | 0 | 5 | 0 |
| D | 0 | 5 | 0 |
| Mode M0 | |||
|---|---|---|---|
| Quadrant | BADHDUFLAG | Total packets | Discarded packets |
| A | 0 | 15188 | 2 |
| B | 0 | 15672 | 2 |
| C | 0 | 16440 | 2 |
| D | 0 | 26503 | 2 |
| Mode SS | |||
|---|---|---|---|
| Quadrant | BADHDUFLAG | Total packets | Discarded packets |
| A | 0 | 148 | 0 |
| B | 0 | 148 | 0 |
| C | 0 | 148 | 0 |
| D | 0 | 148 | 0 |
| Quadrant | Total seconds | Saturated seconds | Saturation percentage |
|---|---|---|---|
| A | 7312 | 58 | 0.793217% |
| B | 7312 | 143 | 1.955689% |
| C | 7312 | 331 | 4.526805% |
| D | 7312 | 1108 | 15.153173% |
Noise dominated data is calculated using 1-second bins in cleaned event files. If a bin has >2000 counts, and if more than 50% of those come from <1% of pixels, then it is considered to be noise-dominated and hence unusable.
| Quadrant | # 1 sec bins | Bins with >0 counts | Bins with >2000 counts | High rate bins dominated by noise | Noise dominated (total time) | Noise dominated (detector-on time) | Marked lightcurve |
|---|---|---|---|---|---|---|---|
| A | 7722 | 7312 | 0 | 0 | 0.00% | 0.00% | 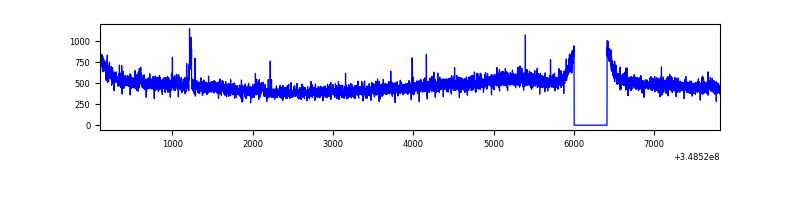 |
| B | 7722 | 7312 | 29 | 29 | 0.38% | 0.40% | 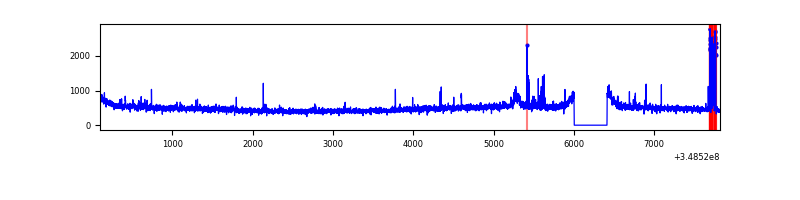 |
| C | 7722 | 7312 | 15 | 15 | 0.19% | 0.21% | 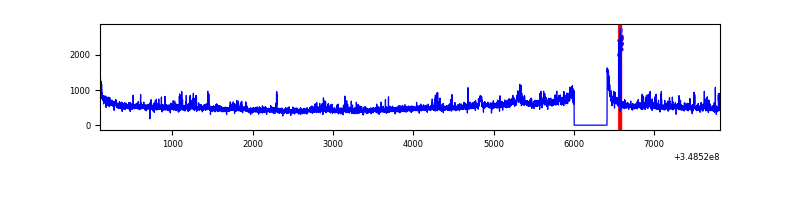 |
| D | 7722 | 7312 | 961 | 961 | 12.44% | 13.14% | 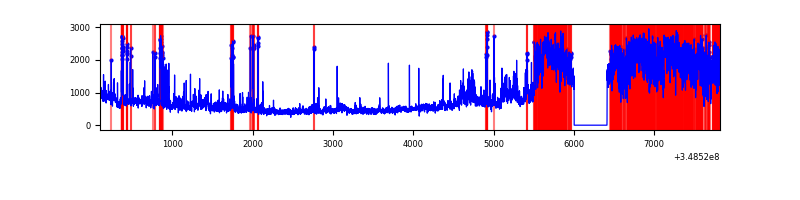 |
Top three noisy pixels from each quadrant. If the there are fewer than three noisy pixels in the level2.evt file, extra rows are filled as -1
| Pixel properties | Quadrant properties | ||||||
|---|---|---|---|---|---|---|---|
| Quadrant | DetID | PixID | Counts | Sigma | Mean | Median | Sigma |
| A | 15 | 174 | 30581 | 162.47 | 899 | 877 | 182.8 |
| A | 13 | 254 | 13336 | 68.14 | 899 | 877 | 182.8 |
| A | 3 | 137 | 8928 | 44.03 | 899 | 877 | 182.8 |
| B | 15 | 222 | 93433 | 536.34 | 894 | 872 | 172.6 |
| B | 15 | 33 | 24793 | 138.61 | 894 | 872 | 172.6 |
| B | 12 | 111 | 21580 | 119.99 | 894 | 872 | 172.6 |
| C | 3 | 233 | 298442 | 1466.06 | 855 | 862 | 203.0 |
| C | 14 | 238 | 184861 | 906.49 | 855 | 862 | 203.0 |
| C | 14 | 254 | 70749 | 344.31 | 855 | 862 | 203.0 |
| D | 7 | 80 | 2092952 | 10436.05 | 832 | 807 | 200.5 |
| D | 1 | 52 | 1165342 | 5808.94 | 832 | 807 | 200.5 |
| D | 8 | 195 | 502946 | 2504.77 | 832 | 807 | 200.5 |
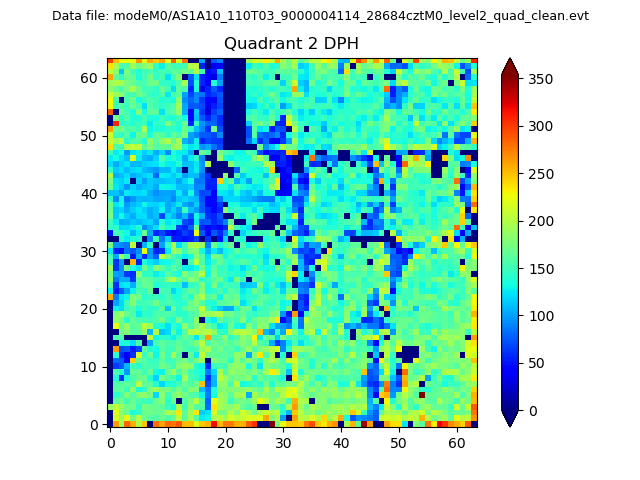
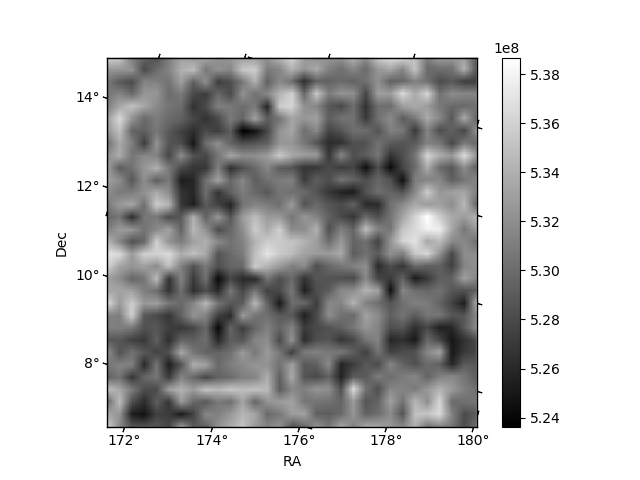
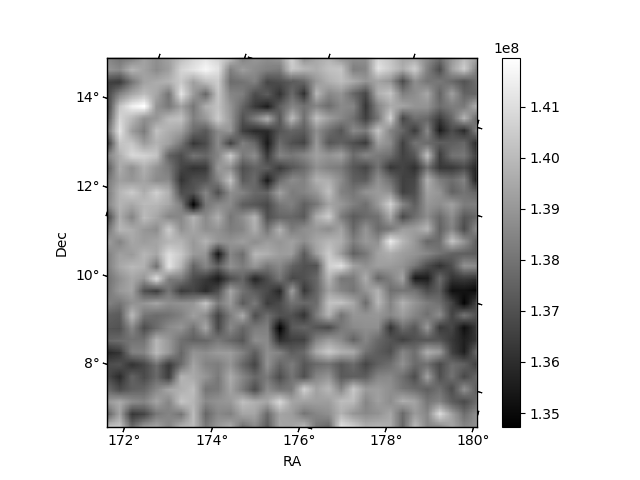
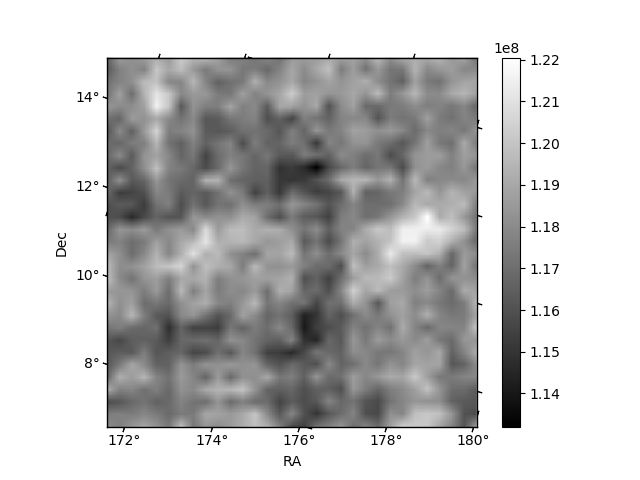
Histogram calculated using DETX and DETY for each event in the final _common_clean file
| Quadrant A | 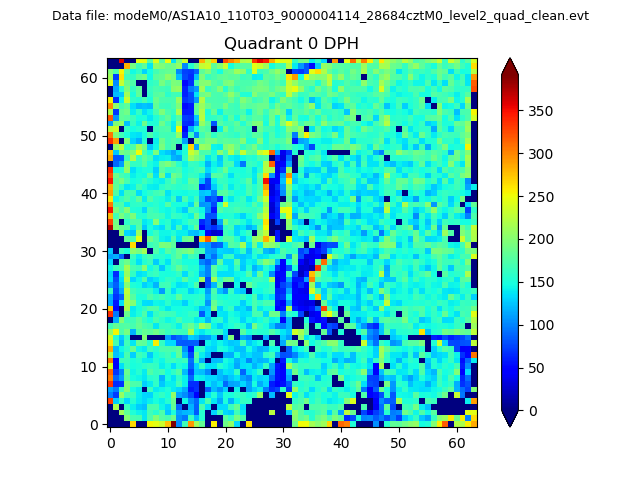 |
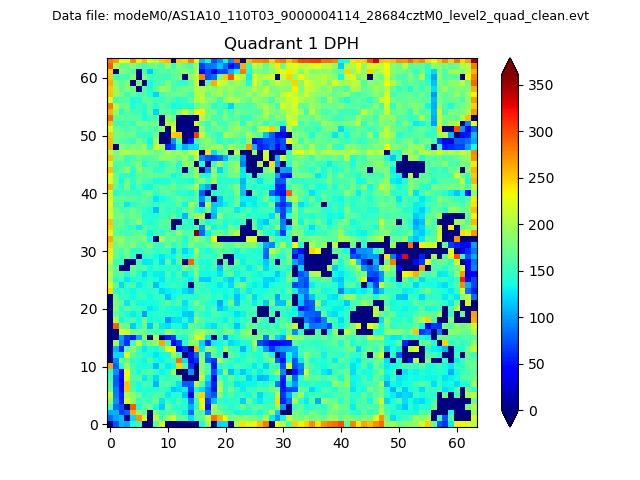 |
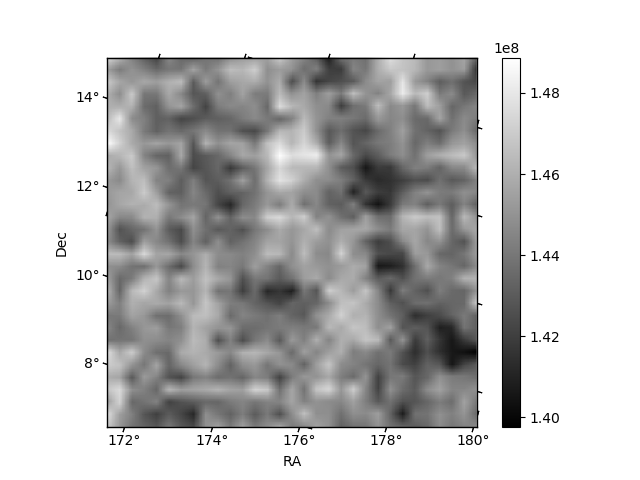
Quadrant B |
|---|---|---|---|
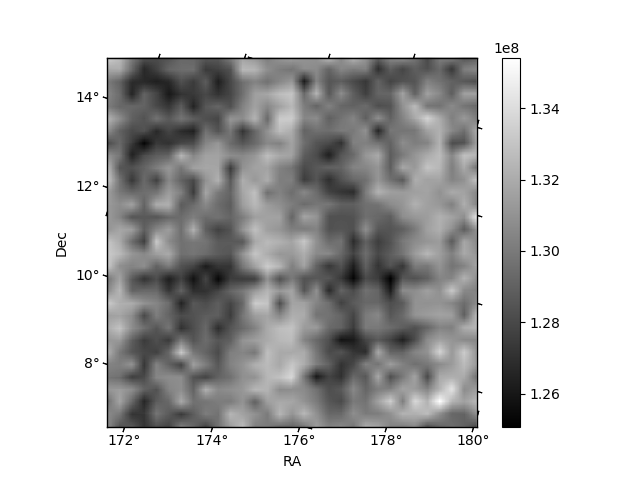
| Quadrant D | 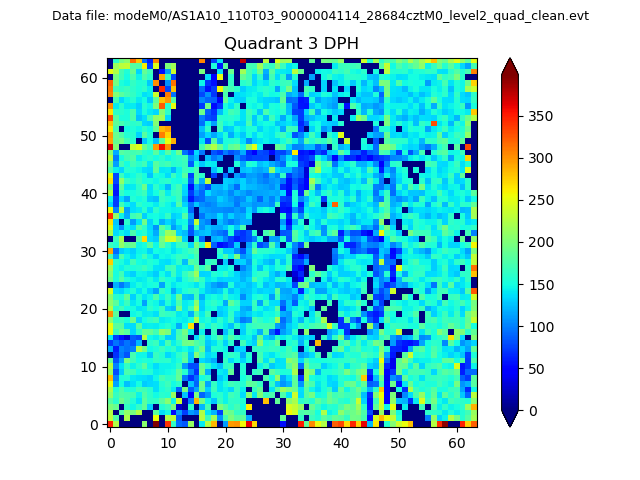 |
 |
Quadrant C |
| Plot type | Count rate plots | Images |
|---|---|---|
| Comparison with Poisson distribution Blue bars denote a histogram of data divided into 1 sec bins. Red curve is a Poisson curve with rate = median count rate of data. |
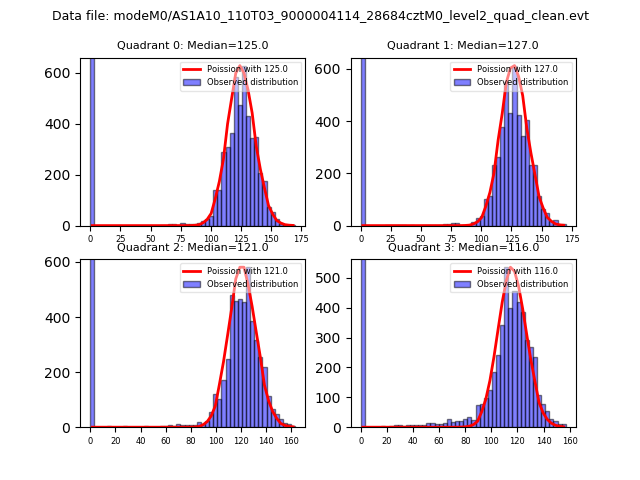 |
 |
| Quadrant-wise count rates Data is divided into 100 sec bins |
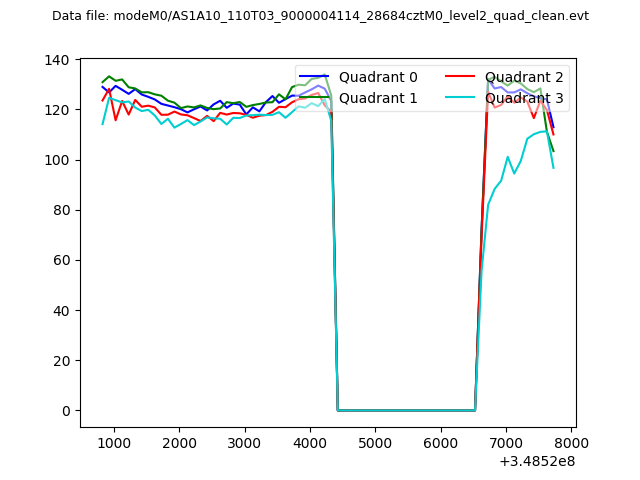 |
|
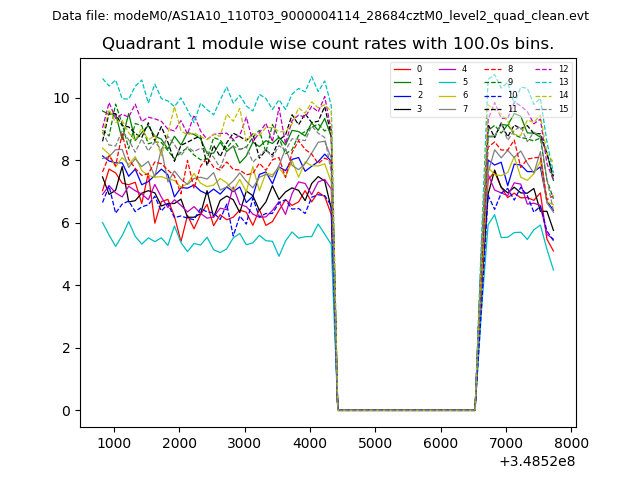
| Module-wise count rates for Quadrant A Data is divided into 100 sec bins |
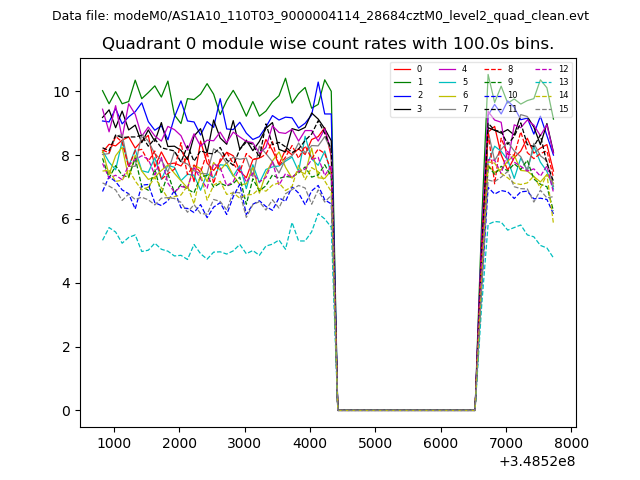 |
 |
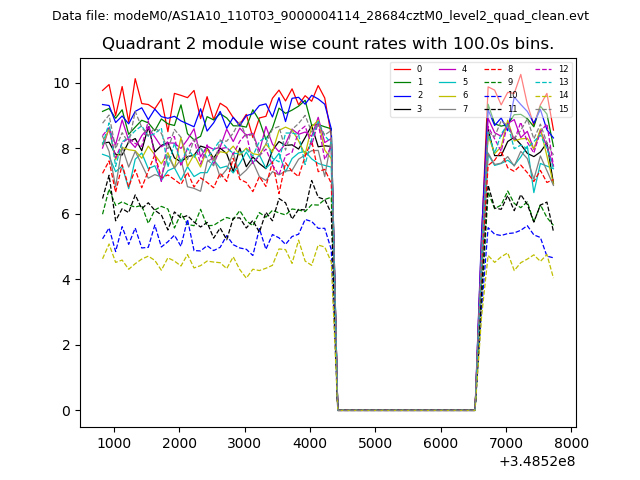
| Module-wise count rates for Quadrant B Data is divided into 100 sec bins |
 |
 |
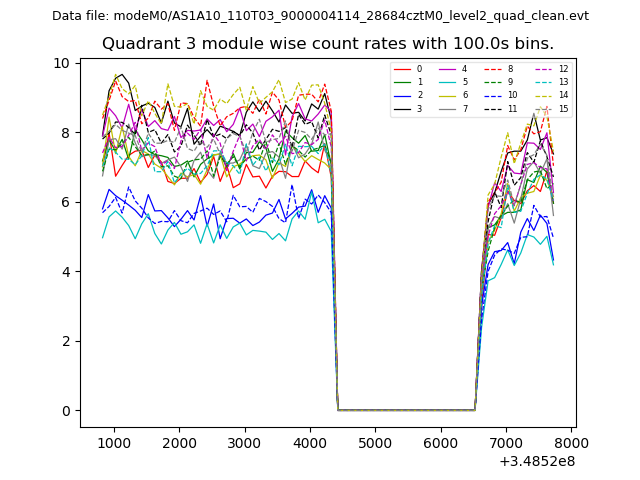
| Module-wise count rates for Quadrant C Data is divided into 100 sec bins |
 |
 |
| Module-wise count rates for Quadrant D Data is divided into 100 sec bins |
 |
 |
| Parameter | Plot |
|---|---|
| CZT HV Monitor | 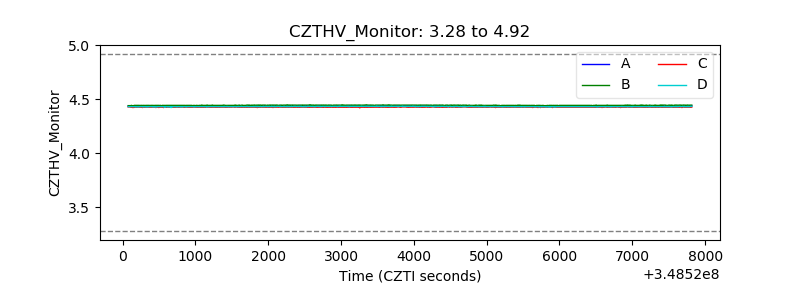 |
| D_VDD | 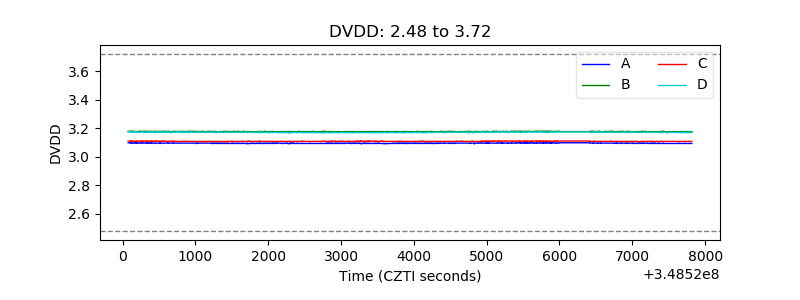 |
| Temperature 1 | 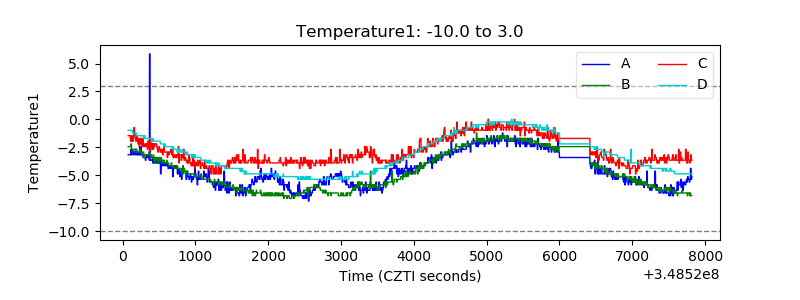 |
| Veto HV Monitor | 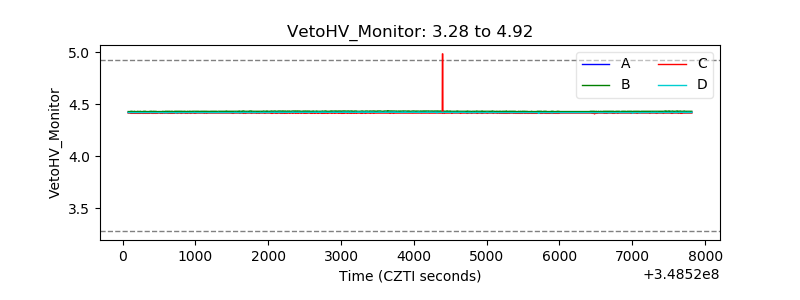 |
| Veto LLD | 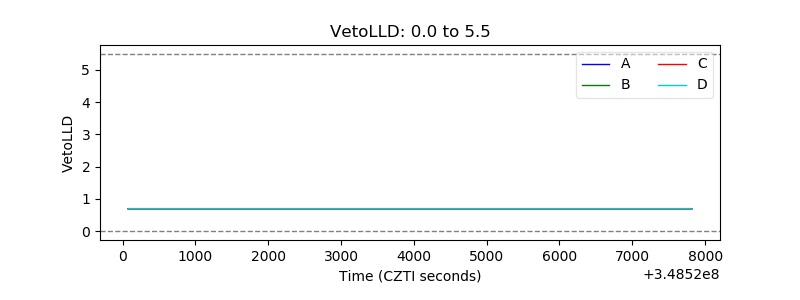 |
| Alpha Counter | 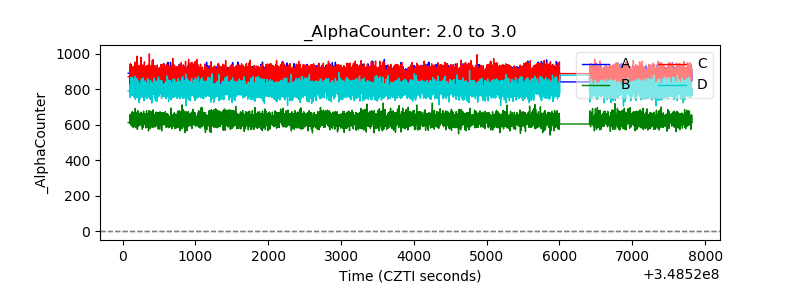 |
| _CPM_Rate | 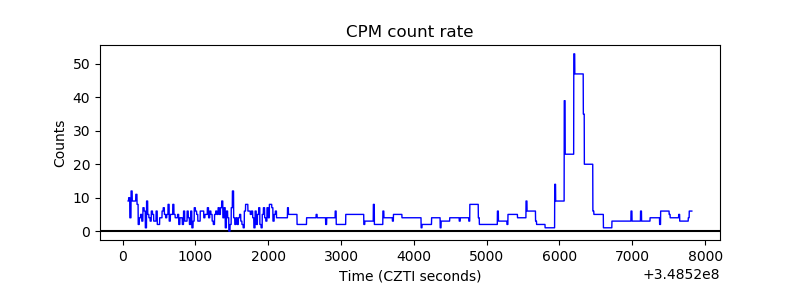 |
| CZT Counter | 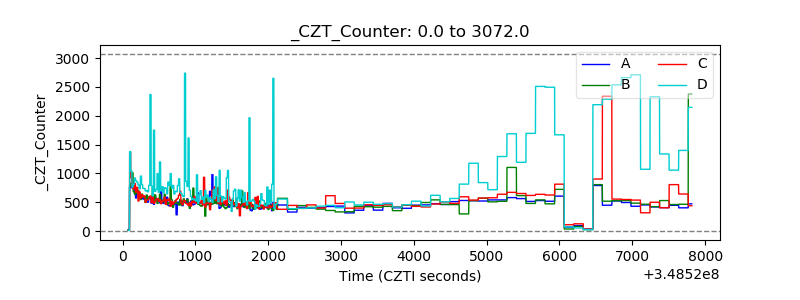 |
| +2.5 Volts monitor |  |
| +5 Volts monitor | 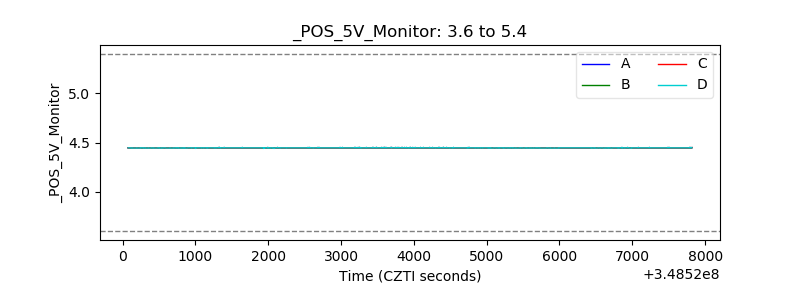 |
| _ROLL_ROT | 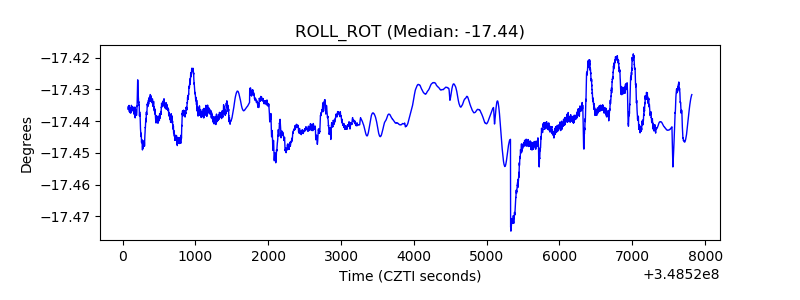 |
| _Roll_DEC | 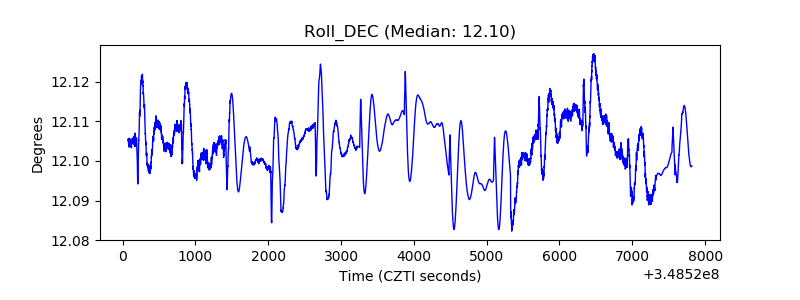 |
| _Roll_RA | 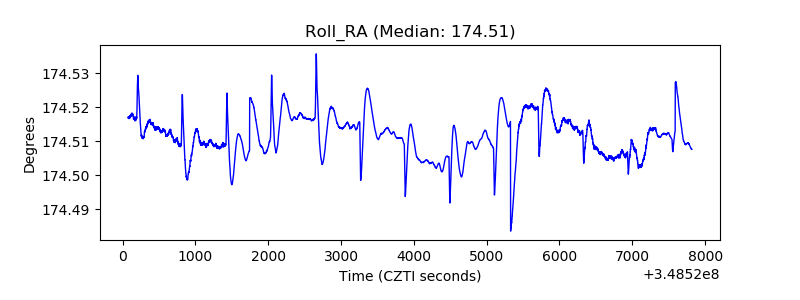 |
| Veto Counter | 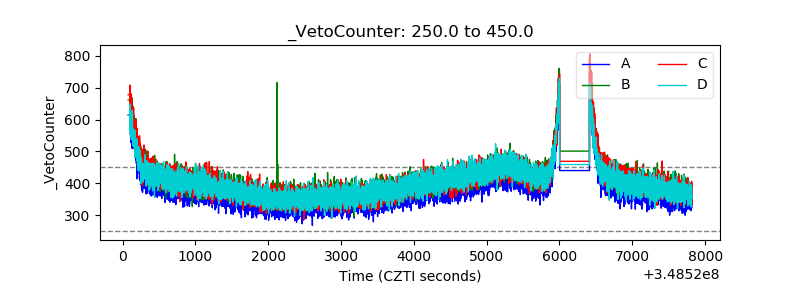 |