| Param | Original file | Final file |
|---|---|---|
| Filename | modeM0/AS1A10_021T04_9000004116_28684cztM0_level2.evt | modeM0/AS1A10_021T04_9000004116_28684cztM0_level2_quad_clean.evt |
| Size (bytes) | 1,249,070,400 | 209,275,200 |
| Size | 1.2 GB | 199.6 MB |
| Events in quadrant A | 7,656,316 | 1,316,736 |
| Events in quadrant B | 7,908,062 | 1,347,686 |
| Events in quadrant C | 8,757,089 | 1,288,884 |
| Events in quadrant D | 12,397,448 | 1,252,617 |
| Mode M0 | |||
|---|---|---|---|
| Quadrant | BADHDUFLAG | Total packets | Discarded packets |
| A | 0 | 33701 | 3 |
| B | 0 | 34470 | 3 |
| C | 0 | 36605 | 3 |
| D | 0 | 48226 | 3 |
| Mode SS | |||
|---|---|---|---|
| Quadrant | BADHDUFLAG | Total packets | Discarded packets |
| A | 0 | 336 | 0 |
| B | 0 | 336 | 0 |
| C | 0 | 336 | 0 |
| D | 0 | 336 | 0 |
| Mode M9 | |||
|---|---|---|---|
| Quadrant | BADHDUFLAG | Total packets | Discarded packets |
| A | 0 | 23 | 0 |
| B | 0 | 23 | 0 |
| C | 0 | 23 | 0 |
| D | 0 | 23 | 0 |
| Quadrant | Total seconds | Saturated seconds | Saturation percentage |
|---|---|---|---|
| A | 16416 | 101 | 0.615253% |
| B | 16416 | 156 | 0.950292% |
| C | 16416 | 454 | 2.765595% |
| D | 16416 | 816 | 4.970760% |
Noise dominated data is calculated using 1-second bins in cleaned event files. If a bin has >2000 counts, and if more than 50% of those come from <1% of pixels, then it is considered to be noise-dominated and hence unusable.
| Quadrant | # 1 sec bins | Bins with >0 counts | Bins with >2000 counts | High rate bins dominated by noise | Noise dominated (total time) | Noise dominated (detector-on time) | Marked lightcurve |
|---|---|---|---|---|---|---|---|
| A | 18771 | 16416 | 1 | 1 | 0.01% | 0.01% |  |
| B | 18771 | 16416 | 7 | 7 | 0.04% | 0.04% |  |
| C | 18771 | 16416 | 5 | 5 | 0.03% | 0.03% |  |
| D | 18771 | 16417 | 593 | 593 | 3.16% | 3.61% | 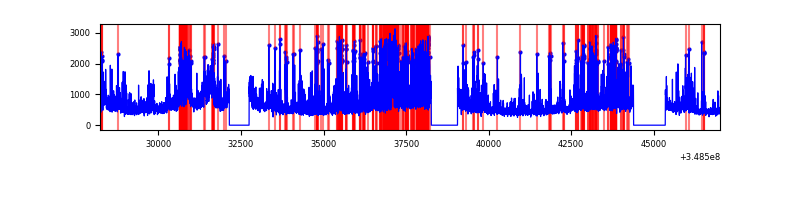 |
Top three noisy pixels from each quadrant. If the there are fewer than three noisy pixels in the level2.evt file, extra rows are filled as -1
| Pixel properties | Quadrant properties | ||||||
|---|---|---|---|---|---|---|---|
| Quadrant | DetID | PixID | Counts | Sigma | Mean | Median | Sigma |
| A | 13 | 254 | 26966 | 63.18 | 1974 | 1932 | 396.2 |
| A | 12 | 96 | 22829 | 52.74 | 1974 | 1932 | 396.2 |
| A | 3 | 137 | 19377 | 44.03 | 1974 | 1932 | 396.2 |
| B | 15 | 33 | 130329 | 344.74 | 1958 | 1907 | 372.5 |
| B | 12 | 111 | 47556 | 122.54 | 1958 | 1907 | 372.5 |
| B | 11 | 111 | 42945 | 110.16 | 1958 | 1907 | 372.5 |
| C | 3 | 233 | 872376 | 1979.42 | 1880 | 1889 | 439.8 |
| C | 14 | 238 | 373572 | 845.18 | 1880 | 1889 | 439.8 |
| C | 14 | 254 | 104697 | 233.78 | 1880 | 1889 | 439.8 |
| D | 1 | 52 | 3383275 | 7575.69 | 1872 | 1822 | 446.4 |
| D | 7 | 80 | 761599 | 1702.18 | 1872 | 1822 | 446.4 |
| D | 8 | 195 | 727867 | 1626.6 | 1872 | 1822 | 446.4 |
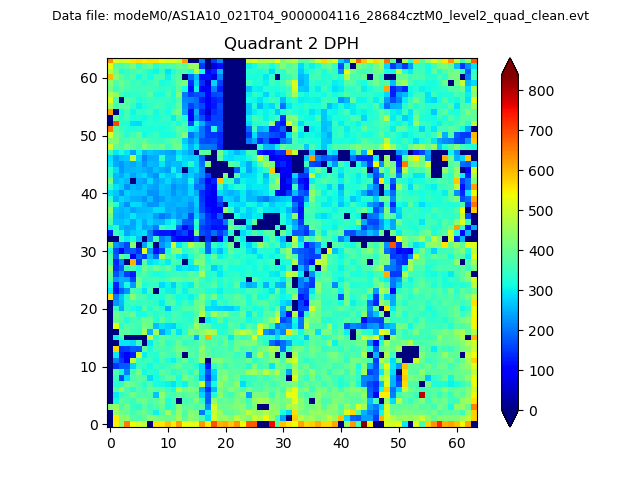
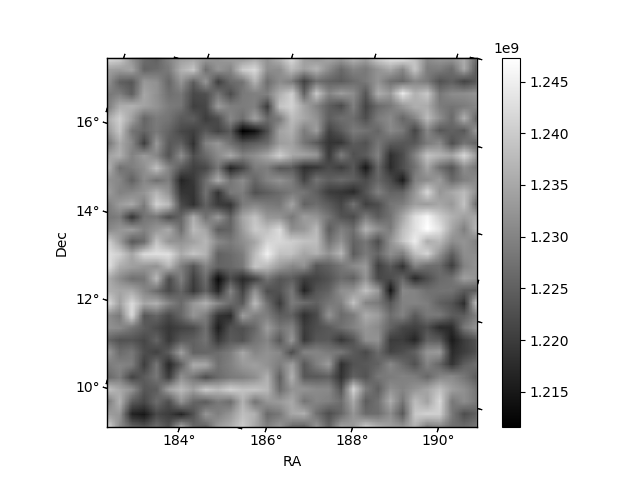
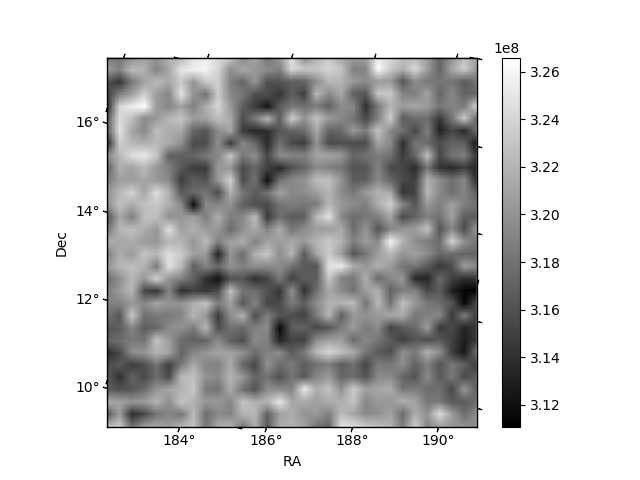
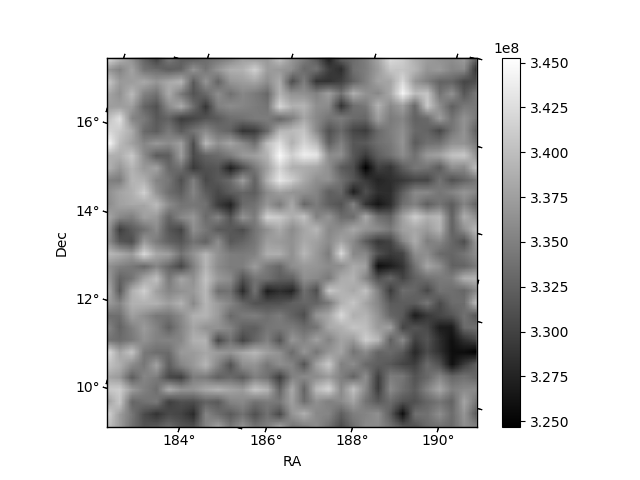
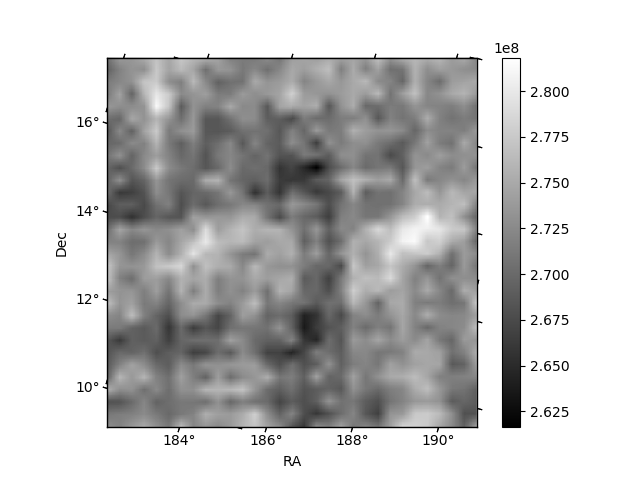
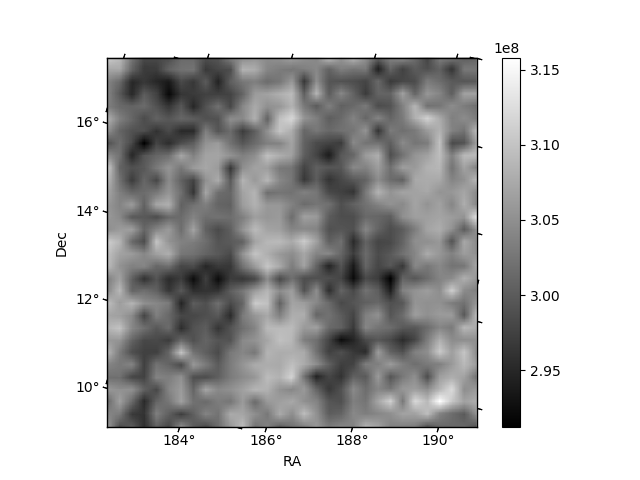
Histogram calculated using DETX and DETY for each event in the final _common_clean file
| Quadrant A | 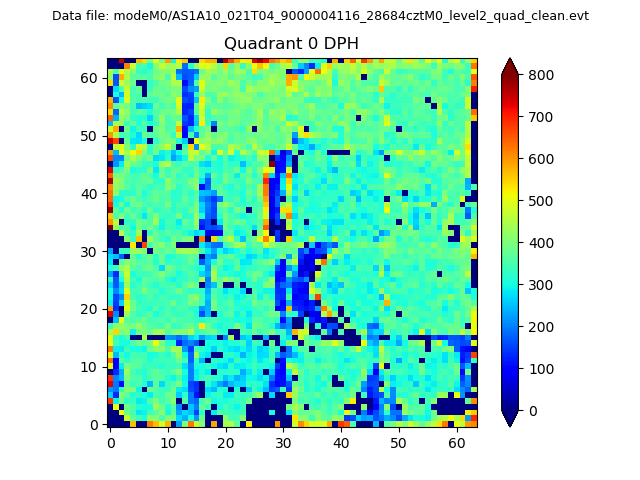 |
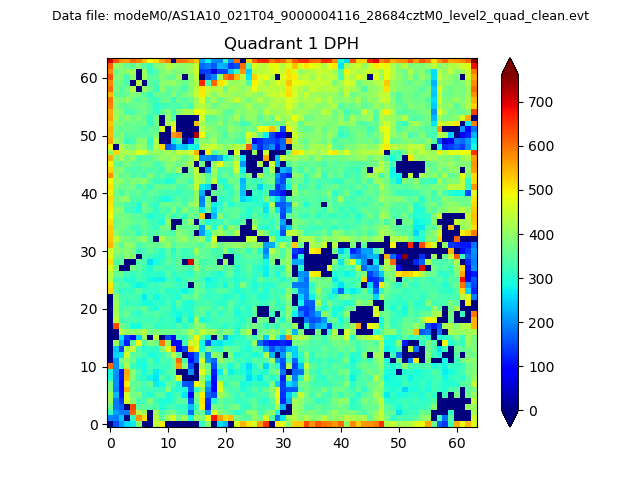 |
Quadrant B |
|---|---|---|---|
| Quadrant D | 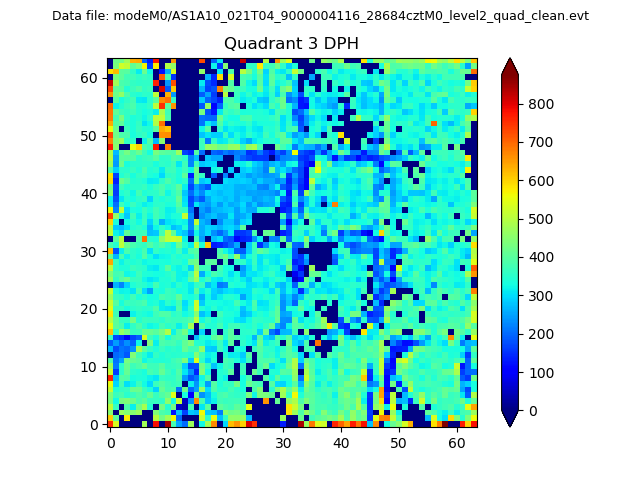 |
 |
Quadrant C |
| Plot type | Count rate plots | Images |
|---|---|---|
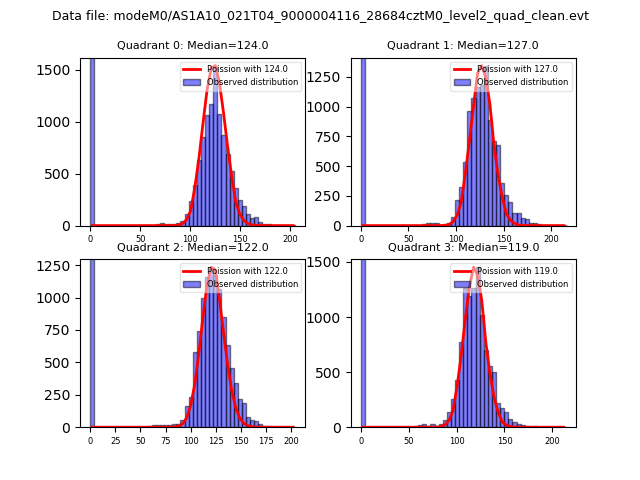
| Comparison with Poisson distribution Blue bars denote a histogram of data divided into 1 sec bins. Red curve is a Poisson curve with rate = median count rate of data. |
 |
 |
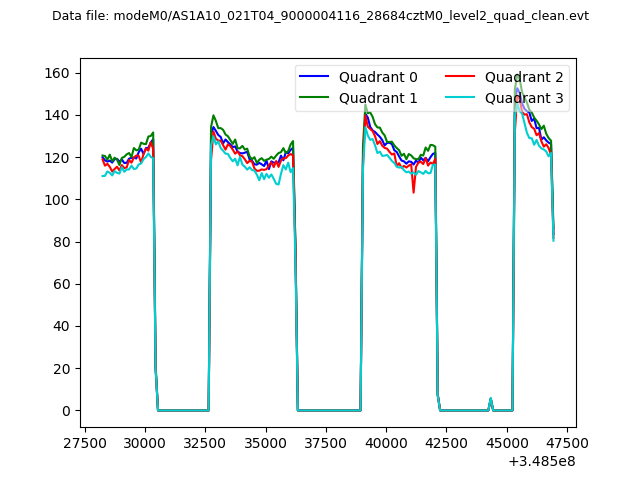
| Quadrant-wise count rates Data is divided into 100 sec bins |
 |
|
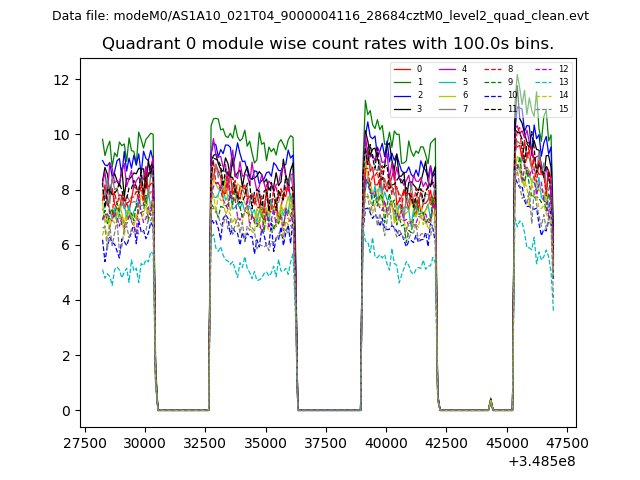
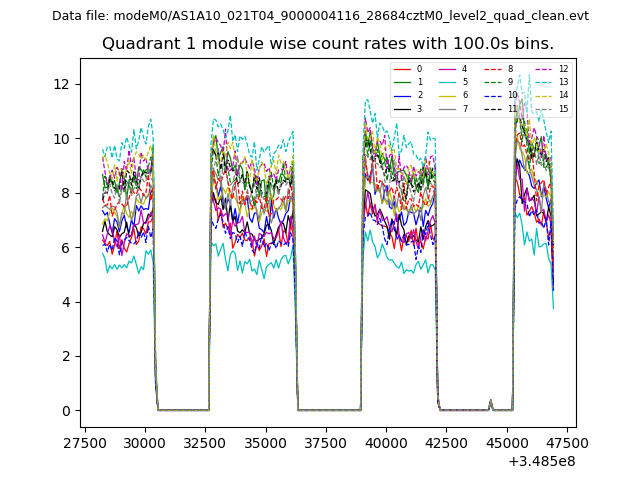
| Module-wise count rates for Quadrant A Data is divided into 100 sec bins |
 |
 |
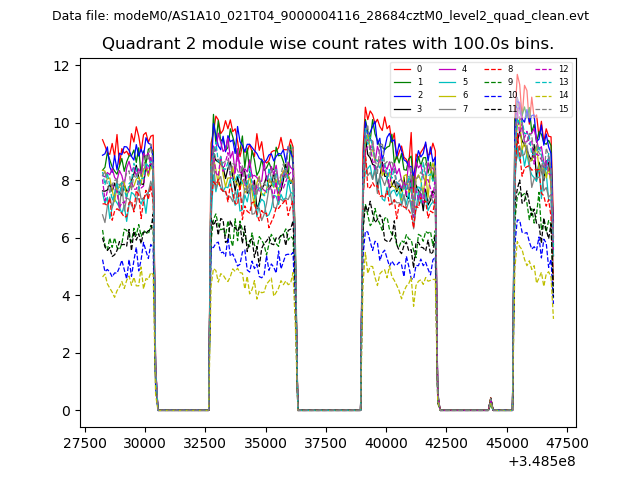
| Module-wise count rates for Quadrant B Data is divided into 100 sec bins |
 |
 |
| Module-wise count rates for Quadrant C Data is divided into 100 sec bins |
 |
 |
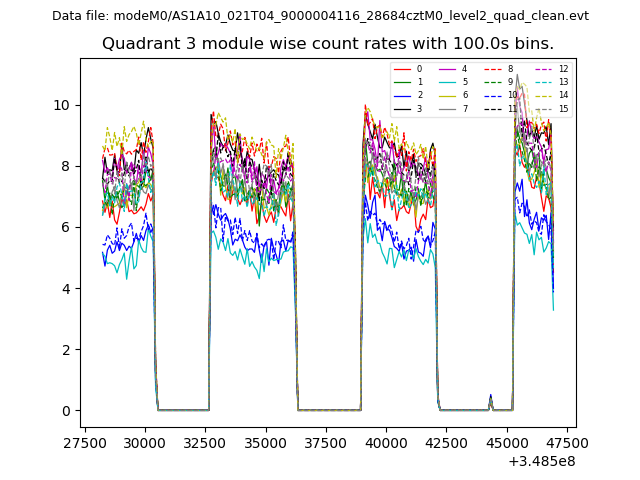
| Module-wise count rates for Quadrant D Data is divided into 100 sec bins |
 |
 |
| Parameter | Plot |
|---|---|
| CZT HV Monitor | 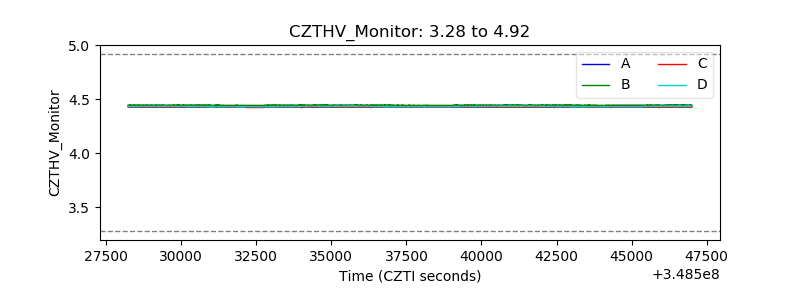 |
| D_VDD | 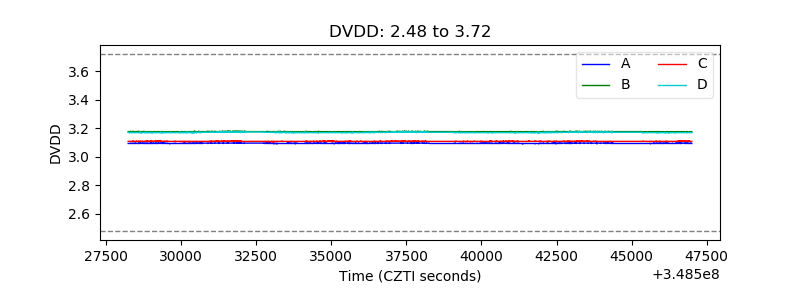 |
| Temperature 1 | 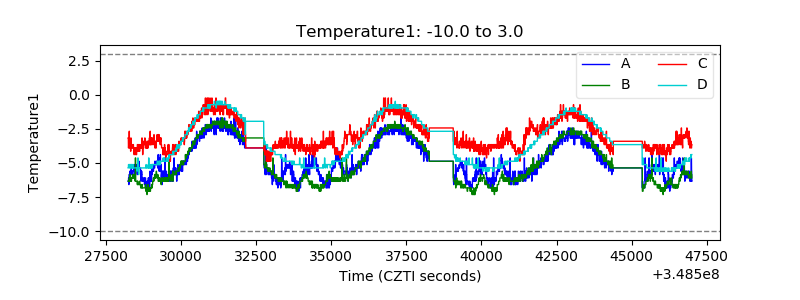 |
| Veto HV Monitor | 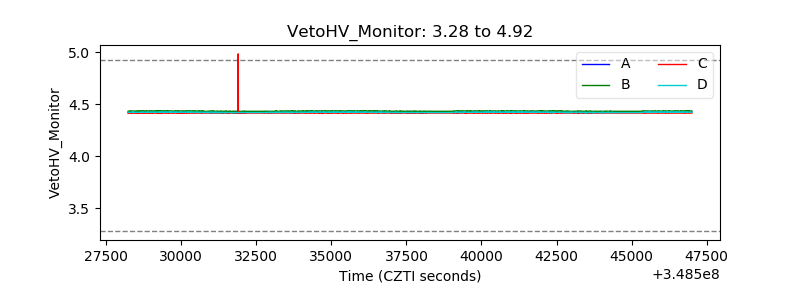 |
| Veto LLD | 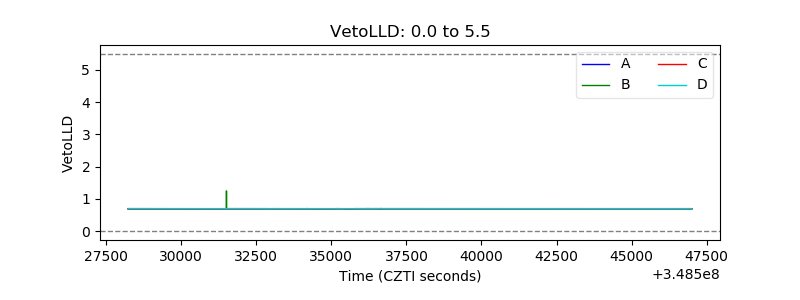 |
| Alpha Counter | 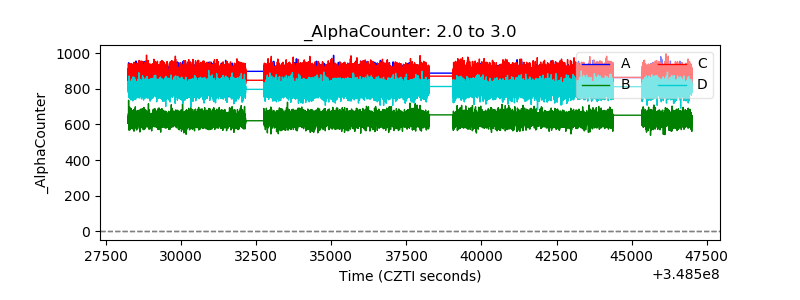 |
| _CPM_Rate | 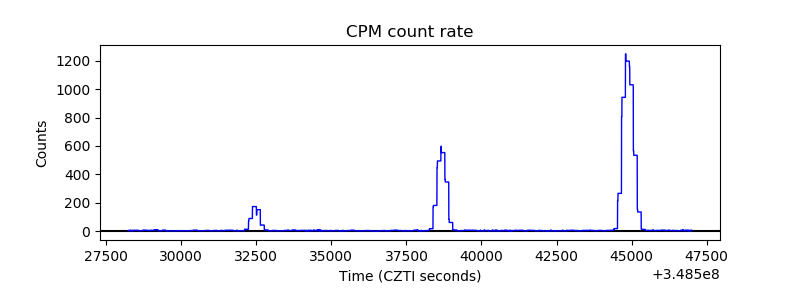 |
| CZT Counter |  |
| +2.5 Volts monitor | 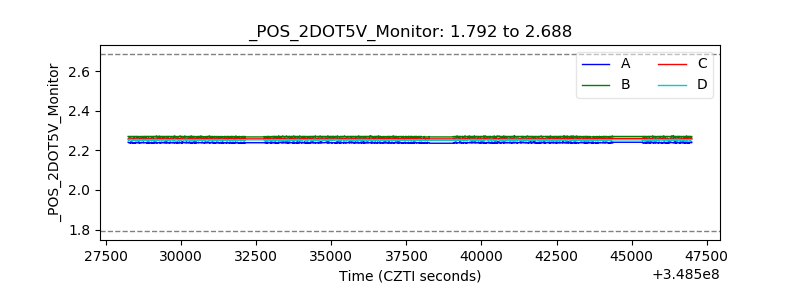 |
| +5 Volts monitor |  |
| _ROLL_ROT | 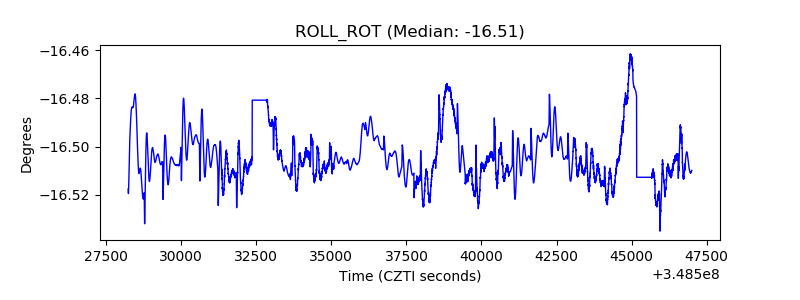 |
| _Roll_DEC | 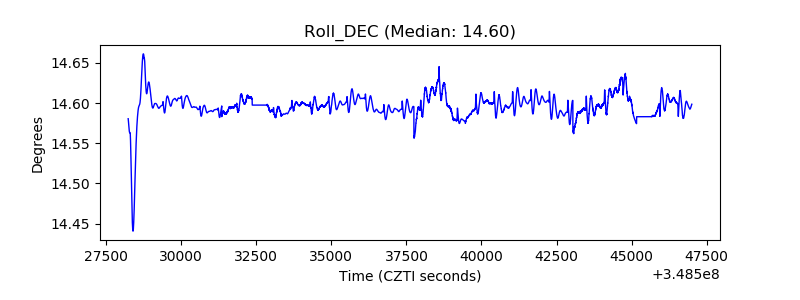 |
| _Roll_RA | 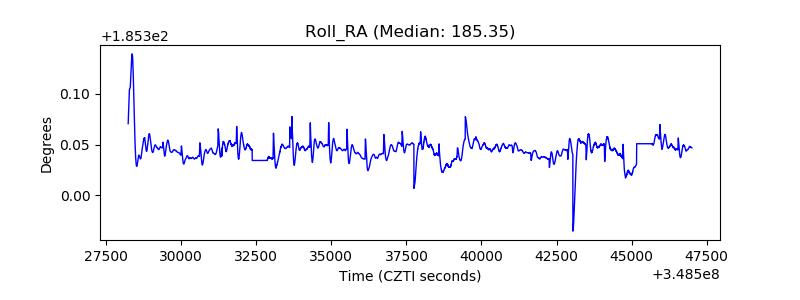 |
| Veto Counter | 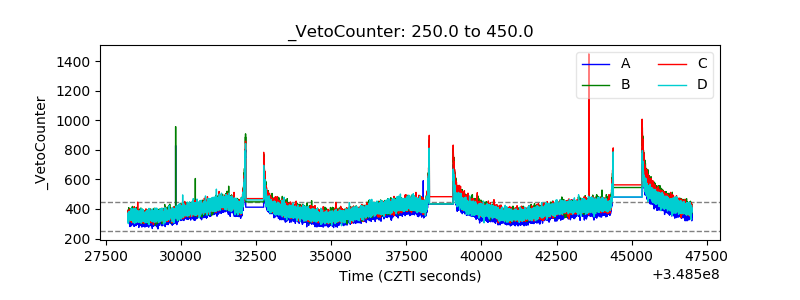 |