| Param | Original file | Final file |
|---|---|---|
| Filename | modeM0/AS1A10_021T04_9000004116_28686cztM0_level2.evt | modeM0/AS1A10_021T04_9000004116_28686cztM0_level2_quad_clean.evt |
| Size (bytes) | 598,898,880 | 97,021,440 |
| Size | 571.2 MB | 92.5 MB |
| Events in quadrant A | 3,268,211 | 632,010 |
| Events in quadrant B | 3,331,783 | 650,406 |
| Events in quadrant C | 3,982,144 | 613,675 |
| Events in quadrant D | 7,098,333 | 571,916 |
| Mode M0 | |||
|---|---|---|---|
| Quadrant | BADHDUFLAG | Total packets | Discarded packets |
| A | 0 | 13921 | 2 |
| B | 0 | 14099 | 2 |
| C | 0 | 16247 | 2 |
| D | 0 | 25663 | 2 |
| Mode SS | |||
|---|---|---|---|
| Quadrant | BADHDUFLAG | Total packets | Discarded packets |
| A | 0 | 138 | 0 |
| B | 0 | 138 | 0 |
| C | 0 | 138 | 0 |
| D | 0 | 138 | 0 |
| Mode M9 | |||
|---|---|---|---|
| Quadrant | BADHDUFLAG | Total packets | Discarded packets |
| A | 0 | 15 | 0 |
| B | 0 | 16 | 0 |
| C | 0 | 16 | 0 |
| D | 0 | 16 | 0 |
| Quadrant | Total seconds | Saturated seconds | Saturation percentage |
|---|---|---|---|
| A | 6740 | 27 | 0.400593% |
| B | 6740 | 46 | 0.682493% |
| C | 6740 | 155 | 2.299703% |
| D | 6740 | 1470 | 21.810089% |
Noise dominated data is calculated using 1-second bins in cleaned event files. If a bin has >2000 counts, and if more than 50% of those come from <1% of pixels, then it is considered to be noise-dominated and hence unusable.
| Quadrant | # 1 sec bins | Bins with >0 counts | Bins with >2000 counts | High rate bins dominated by noise | Noise dominated (total time) | Noise dominated (detector-on time) | Marked lightcurve |
|---|---|---|---|---|---|---|---|
| A | 7850 | 6742 | 1 | 1 | 0.01% | 0.01% | 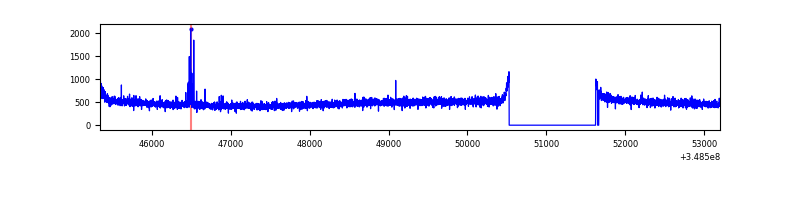 |
| B | 7850 | 6741 | 3 | 3 | 0.04% | 0.04% |  |
| C | 7850 | 6741 | 5 | 5 | 0.06% | 0.07% | 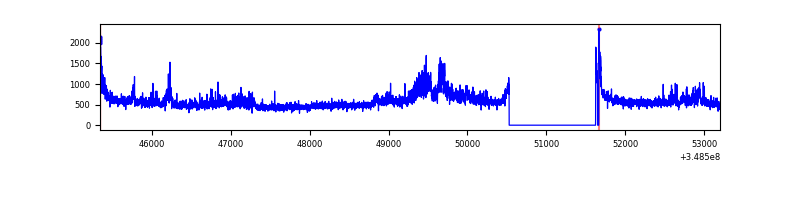 |
| D | 7850 | 6741 | 1417 | 1417 | 18.05% | 21.02% | 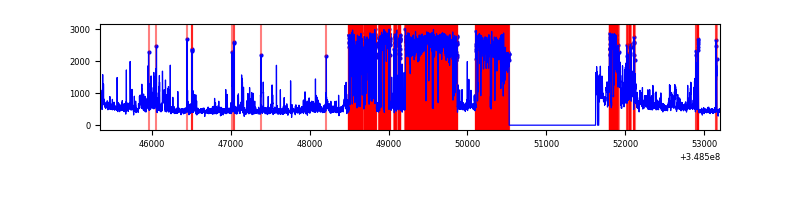 |
Top three noisy pixels from each quadrant. If the there are fewer than three noisy pixels in the level2.evt file, extra rows are filled as -1
| Pixel properties | Quadrant properties | ||||||
|---|---|---|---|---|---|---|---|
| Quadrant | DetID | PixID | Counts | Sigma | Mean | Median | Sigma |
| A | 12 | 96 | 21212 | 121.47 | 841 | 824 | 167.8 |
| A | 13 | 254 | 10339 | 56.69 | 841 | 824 | 167.8 |
| A | 3 | 137 | 7987 | 42.68 | 841 | 824 | 167.8 |
| B | 10 | 245 | 52790 | 328.56 | 833 | 813 | 158.2 |
| B | 12 | 111 | 19449 | 117.8 | 833 | 813 | 158.2 |
| B | 11 | 111 | 17804 | 107.4 | 833 | 813 | 158.2 |
| C | 3 | 233 | 668824 | 3564.05 | 800 | 804 | 187.4 |
| C | 14 | 238 | 154597 | 820.52 | 800 | 804 | 187.4 |
| C | 14 | 254 | 40093 | 209.62 | 800 | 804 | 187.4 |
| D | 1 | 52 | 3666833 | 21802.4 | 711 | 692 | 168.2 |
| D | 13 | 104 | 372925 | 2213.66 | 711 | 692 | 168.2 |
| D | 8 | 195 | 212795 | 1261.37 | 711 | 692 | 168.2 |
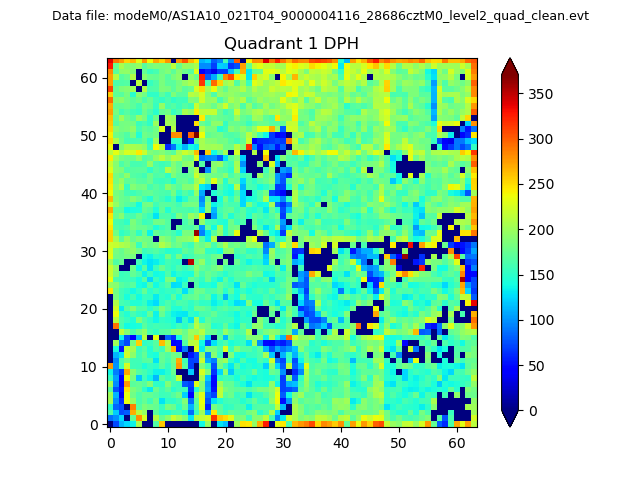
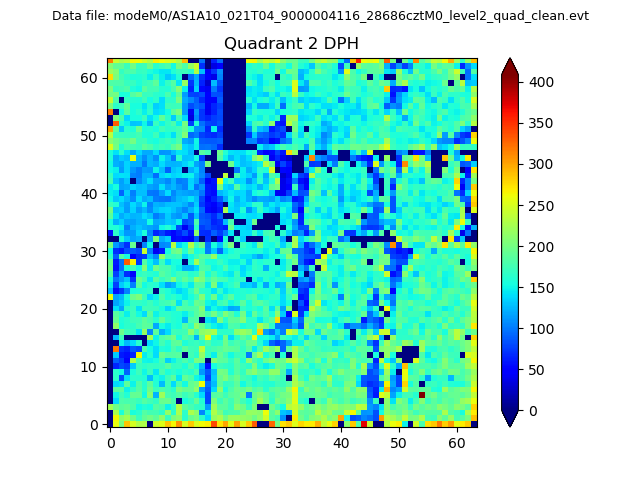
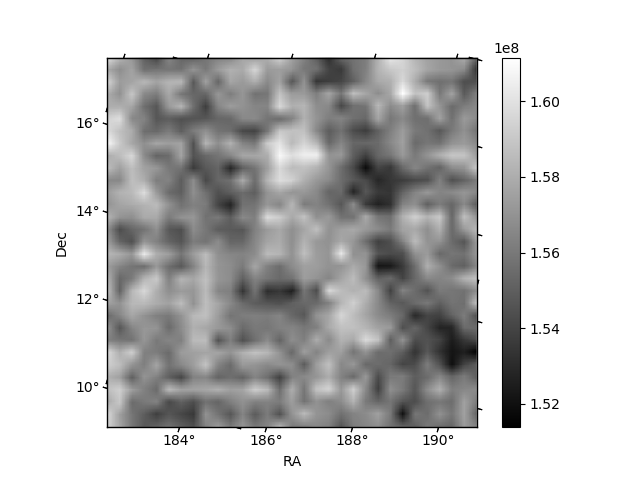
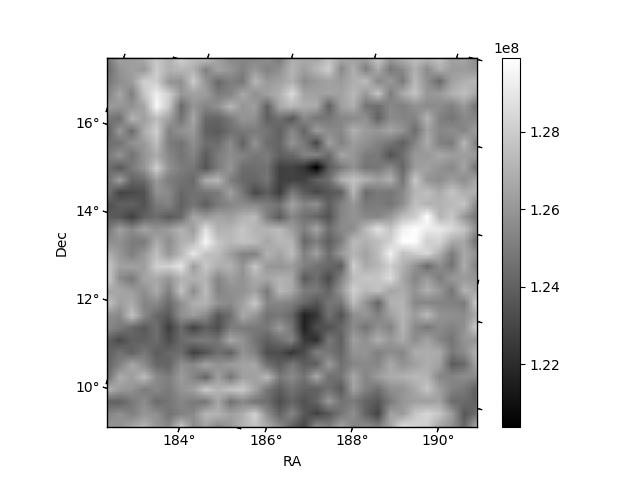
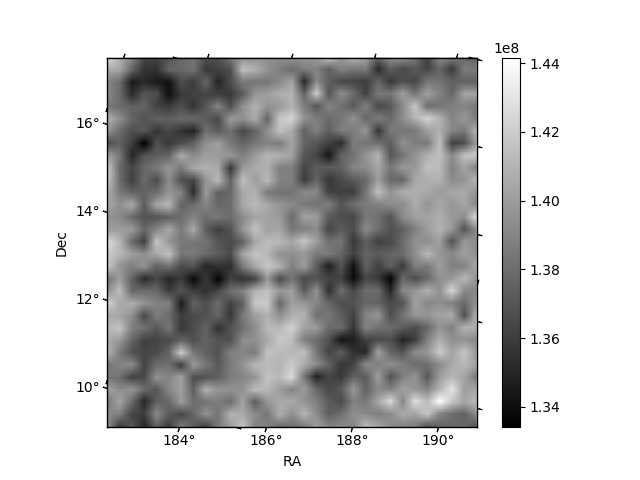
Histogram calculated using DETX and DETY for each event in the final _common_clean file
| Quadrant A | 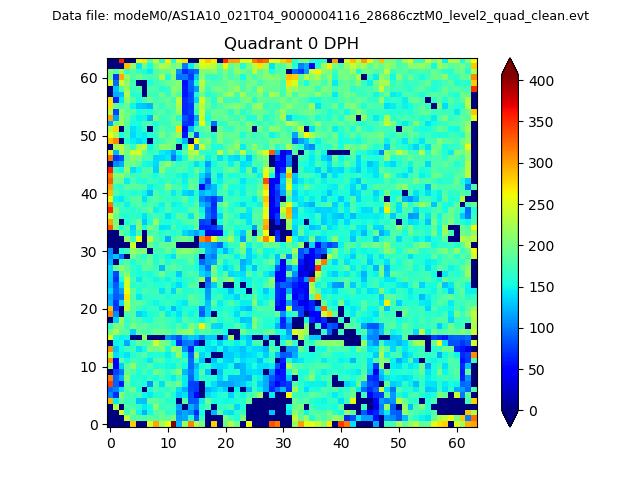 |
 |
Quadrant B |
|---|---|---|---|
| Quadrant D | 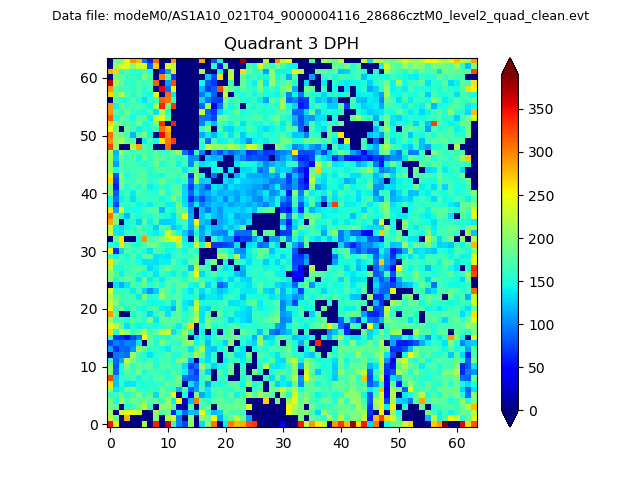 |
 |
Quadrant C |
| Plot type | Count rate plots | Images |
|---|---|---|
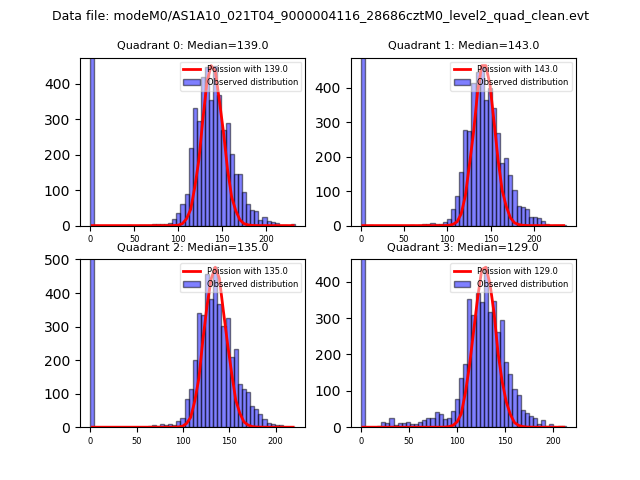
| Comparison with Poisson distribution Blue bars denote a histogram of data divided into 1 sec bins. Red curve is a Poisson curve with rate = median count rate of data. |
 |
 |
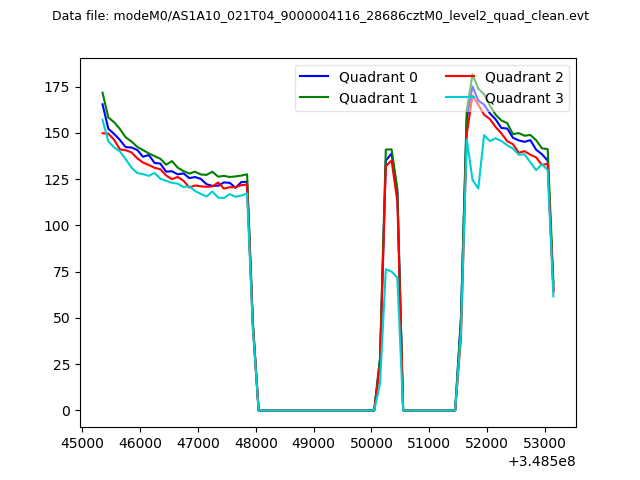
| Quadrant-wise count rates Data is divided into 100 sec bins |
 |
|
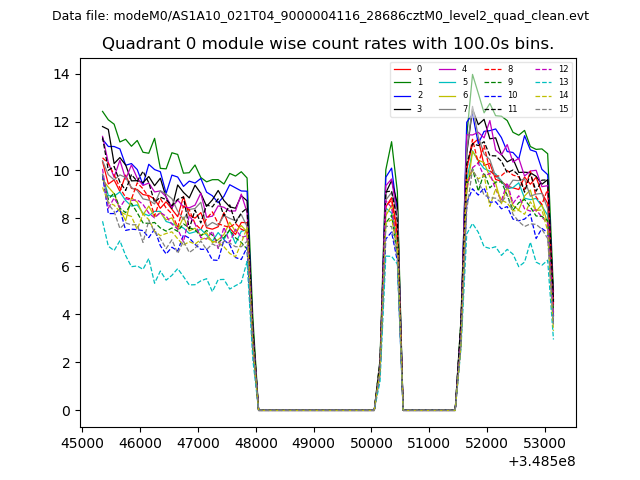
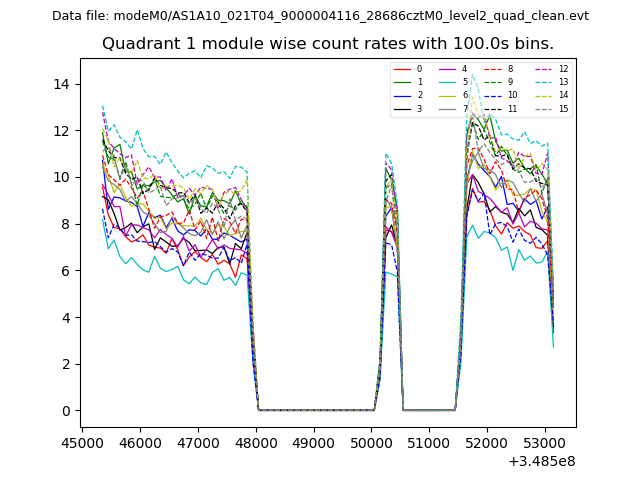
| Module-wise count rates for Quadrant A Data is divided into 100 sec bins |
 |
 |
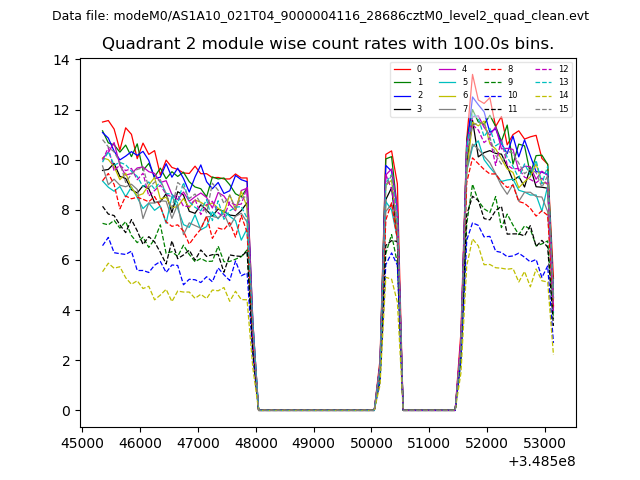
| Module-wise count rates for Quadrant B Data is divided into 100 sec bins |
 |
 |
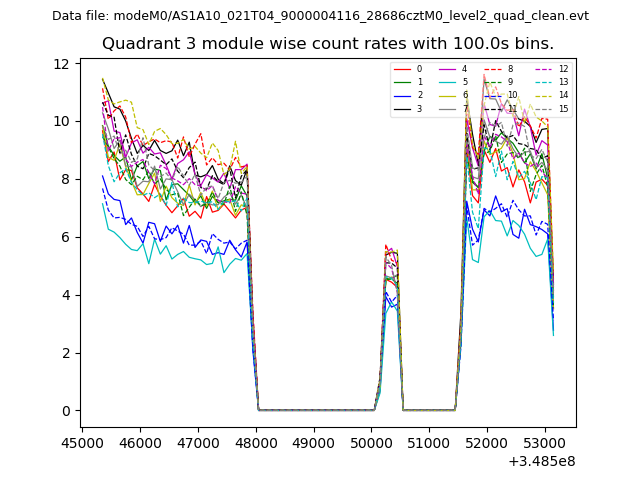
| Module-wise count rates for Quadrant C Data is divided into 100 sec bins |
 |
 |
| Module-wise count rates for Quadrant D Data is divided into 100 sec bins |
 |
 |
| Parameter | Plot |
|---|---|
| CZT HV Monitor | 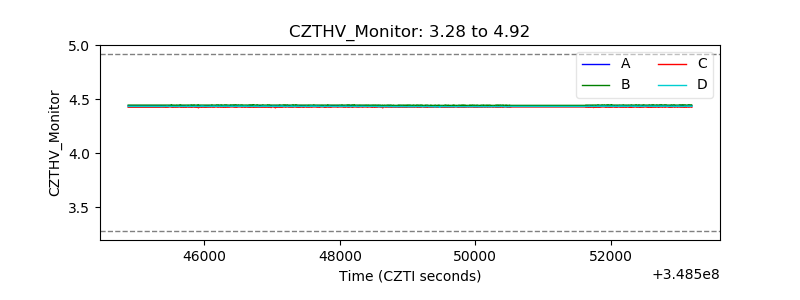 |
| D_VDD | 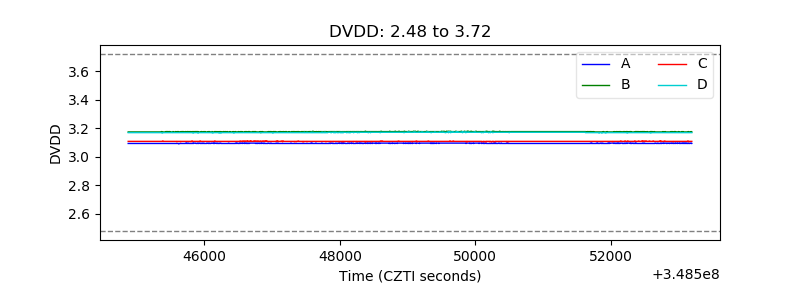 |
| Temperature 1 | 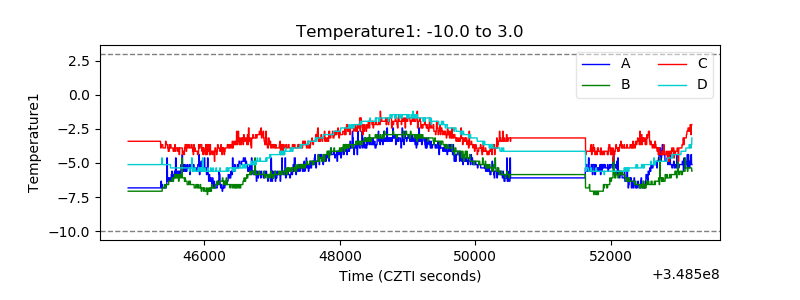 |
| Veto HV Monitor | 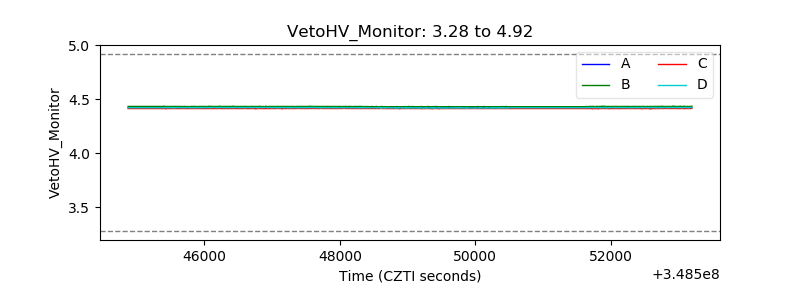 |
| Veto LLD | 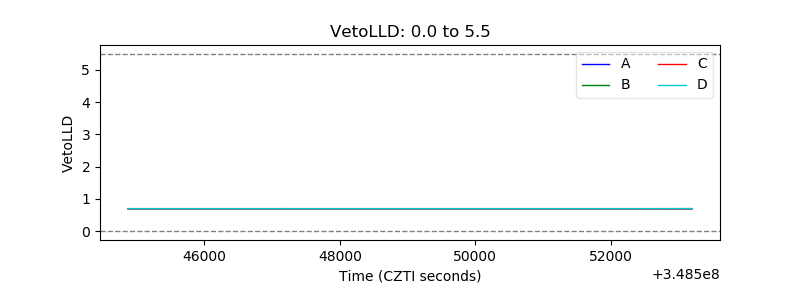 |
| Alpha Counter | 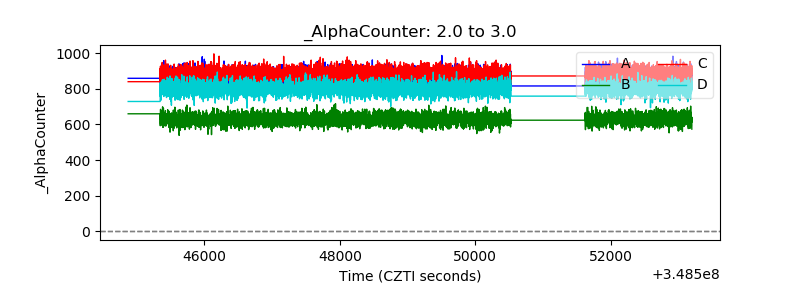 |
| _CPM_Rate | 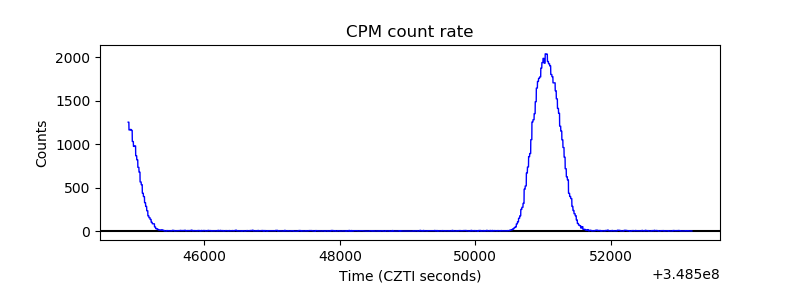 |
| CZT Counter | 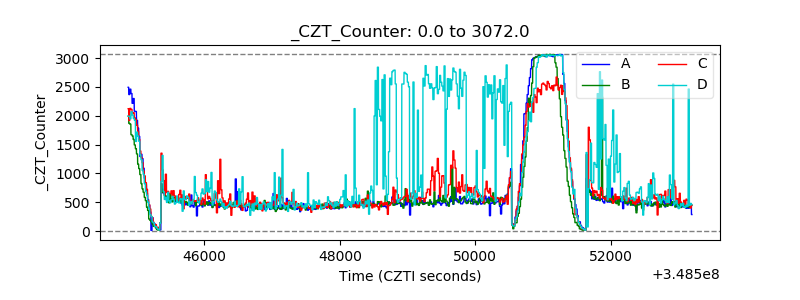 |
| +2.5 Volts monitor |  |
| +5 Volts monitor | 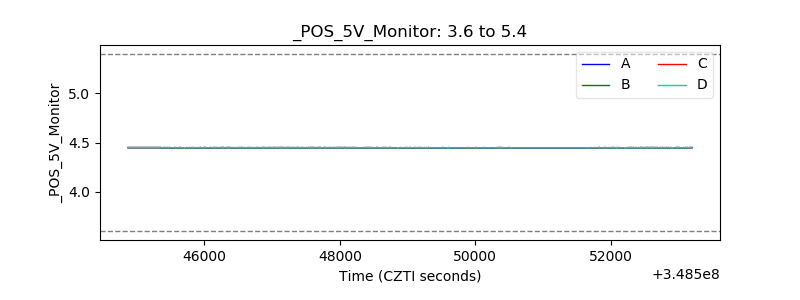 |
| _ROLL_ROT | 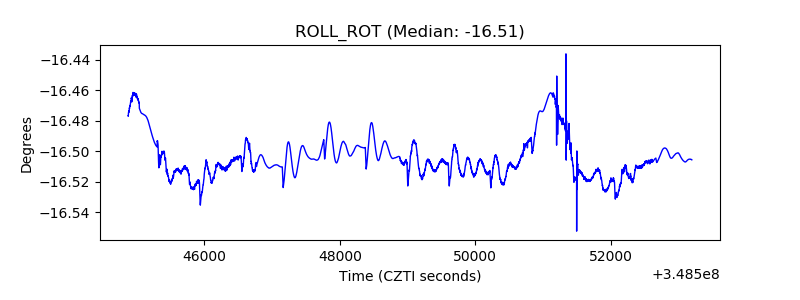 |
| _Roll_DEC | 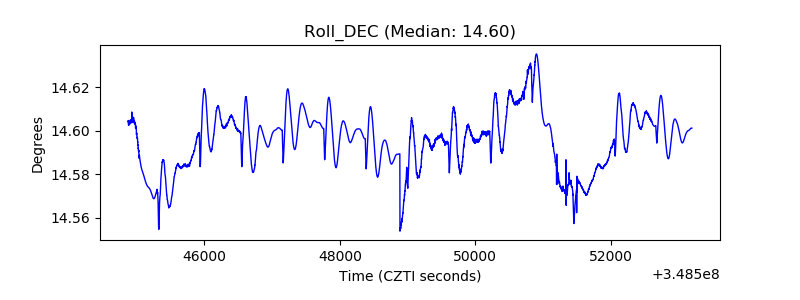 |
| _Roll_RA | 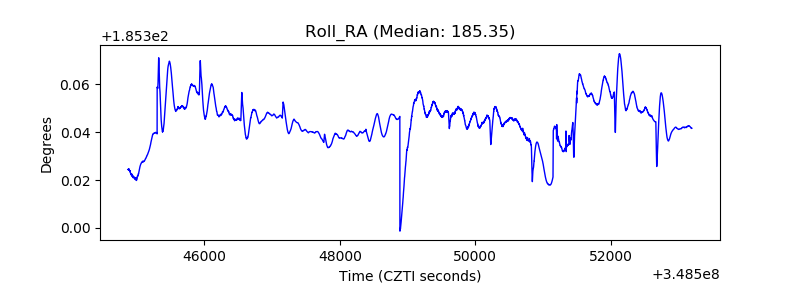 |
| Veto Counter | 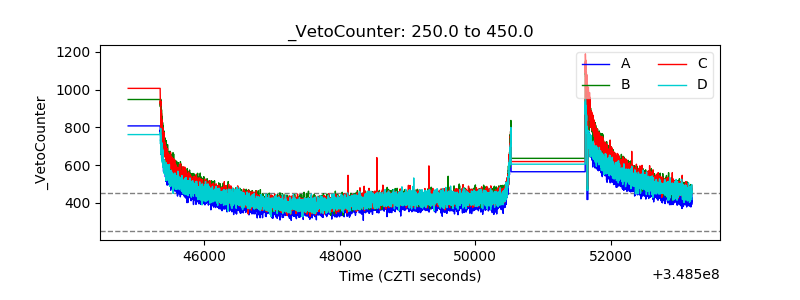 |