| Param | Original file | Final file |
|---|---|---|
| Filename | modeM0/AS1A10_021T04_9000004116_28688cztM0_level2.evt | modeM0/AS1A10_021T04_9000004116_28688cztM0_level2_quad_clean.evt |
| Size (bytes) | 499,383,360 | 86,535,360 |
| Size | 476.2 MB | 82.5 MB |
| Events in quadrant A | 3,036,915 | 571,275 |
| Events in quadrant B | 3,598,232 | 576,481 |
| Events in quadrant C | 3,713,024 | 549,504 |
| Events in quadrant D | 4,390,502 | 525,756 |
| Mode M0 | |||
|---|---|---|---|
| Quadrant | BADHDUFLAG | Total packets | Discarded packets |
| A | 0 | 12203 | 1 |
| B | 0 | 14206 | 1 |
| C | 0 | 14898 | 1 |
| D | 0 | 16899 | 1 |
| Mode SS | |||
|---|---|---|---|
| Quadrant | BADHDUFLAG | Total packets | Discarded packets |
| A | 0 | 116 | 0 |
| B | 0 | 116 | 0 |
| C | 0 | 116 | 0 |
| D | 0 | 116 | 0 |
| Mode M9 | |||
|---|---|---|---|
| Quadrant | BADHDUFLAG | Total packets | Discarded packets |
| A | 0 | 13 | 0 |
| B | 0 | 13 | 0 |
| C | 0 | 13 | 0 |
| D | 0 | 13 | 0 |
| Quadrant | Total seconds | Saturated seconds | Saturation percentage |
|---|---|---|---|
| A | 5683 | 54 | 0.950202% |
| B | 5683 | 126 | 2.217139% |
| C | 5683 | 149 | 2.621855% |
| D | 5683 | 294 | 5.173324% |
Noise dominated data is calculated using 1-second bins in cleaned event files. If a bin has >2000 counts, and if more than 50% of those come from <1% of pixels, then it is considered to be noise-dominated and hence unusable.
| Quadrant | # 1 sec bins | Bins with >0 counts | Bins with >2000 counts | High rate bins dominated by noise | Noise dominated (total time) | Noise dominated (detector-on time) | Marked lightcurve |
|---|---|---|---|---|---|---|---|
| A | 6968 | 5683 | 0 | 0 | 0.00% | 0.00% | 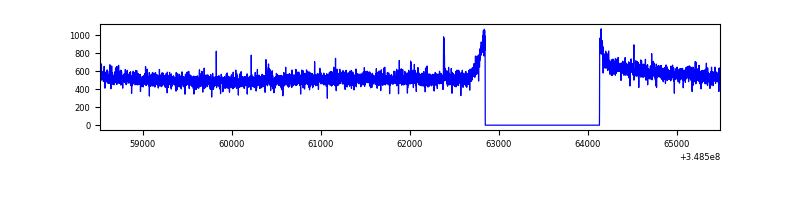 |
| B | 6968 | 5683 | 42 | 42 | 0.60% | 0.74% | 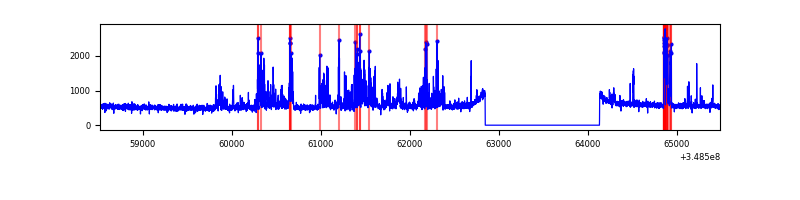 |
| C | 6968 | 5683 | 10 | 10 | 0.14% | 0.18% | 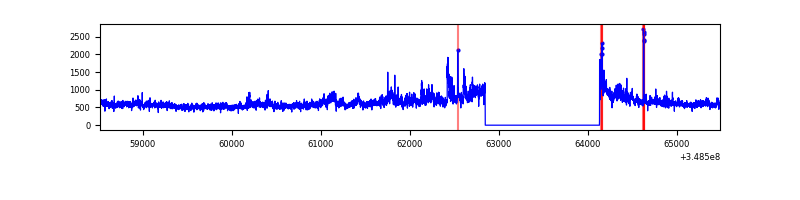 |
| D | 6968 | 5683 | 241 | 241 | 3.46% | 4.24% | 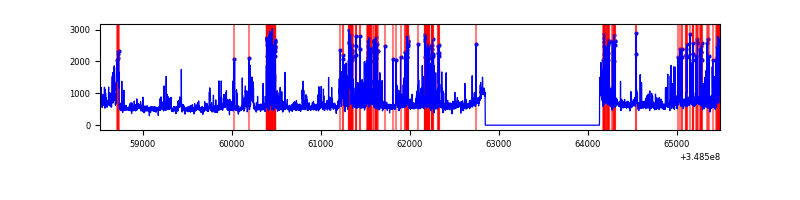 |
Top three noisy pixels from each quadrant. If the there are fewer than three noisy pixels in the level2.evt file, extra rows are filled as -1
| Pixel properties | Quadrant properties | ||||||
|---|---|---|---|---|---|---|---|
| Quadrant | DetID | PixID | Counts | Sigma | Mean | Median | Sigma |
| A | 15 | 174 | 11337 | 67.85 | 785 | 772 | 155.7 |
| A | 13 | 254 | 8294 | 48.31 | 785 | 772 | 155.7 |
| A | 3 | 137 | 6976 | 39.85 | 785 | 772 | 155.7 |
| B | 10 | 245 | 542674 | 3764.26 | 765 | 748 | 144.0 |
| B | 10 | 247 | 39185 | 266.99 | 765 | 748 | 144.0 |
| B | 12 | 111 | 17031 | 113.1 | 765 | 748 | 144.0 |
| C | 3 | 233 | 597515 | 3485.25 | 743 | 750 | 171.2 |
| C | 14 | 238 | 127451 | 739.96 | 743 | 750 | 171.2 |
| C | 2 | 16 | 84481 | 489.01 | 743 | 750 | 171.2 |
| D | 1 | 52 | 1104356 | 6323.34 | 743 | 724 | 174.5 |
| D | 8 | 195 | 241963 | 1382.2 | 743 | 724 | 174.5 |
| D | 12 | 233 | 93560 | 531.91 | 743 | 724 | 174.5 |
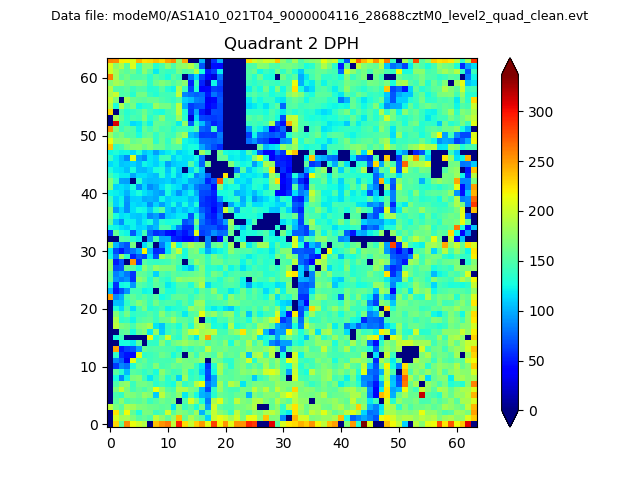
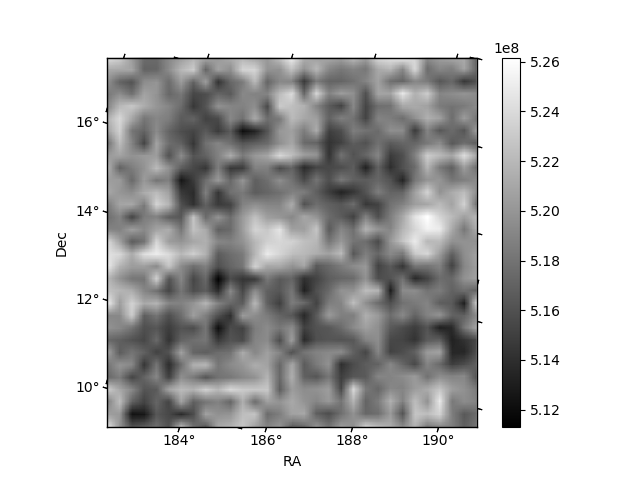
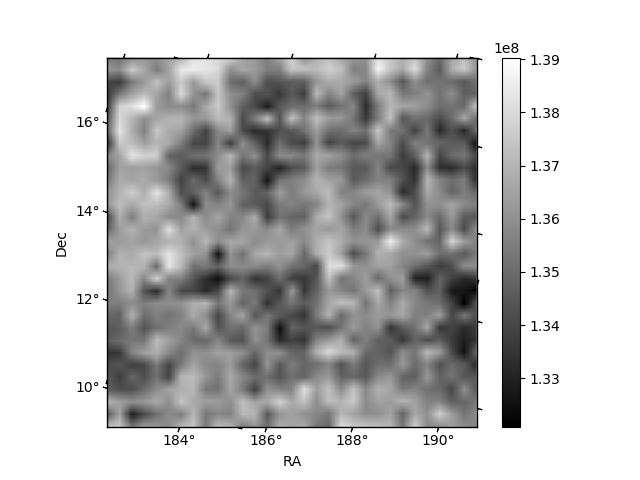
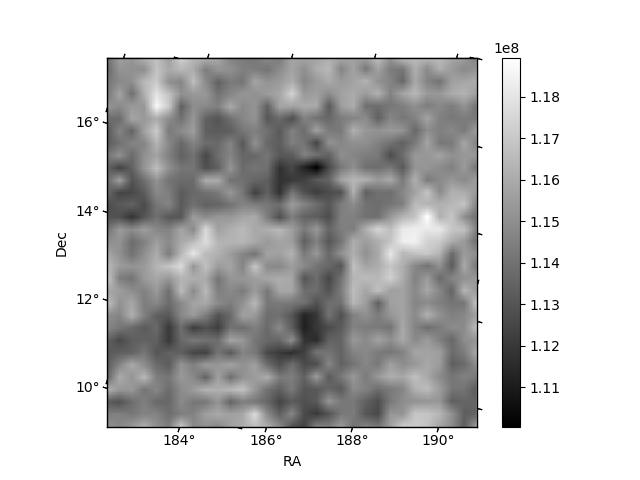
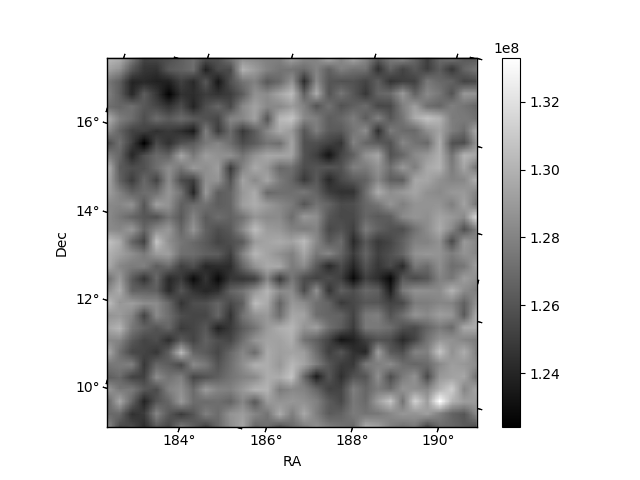
Histogram calculated using DETX and DETY for each event in the final _common_clean file
| Quadrant A | 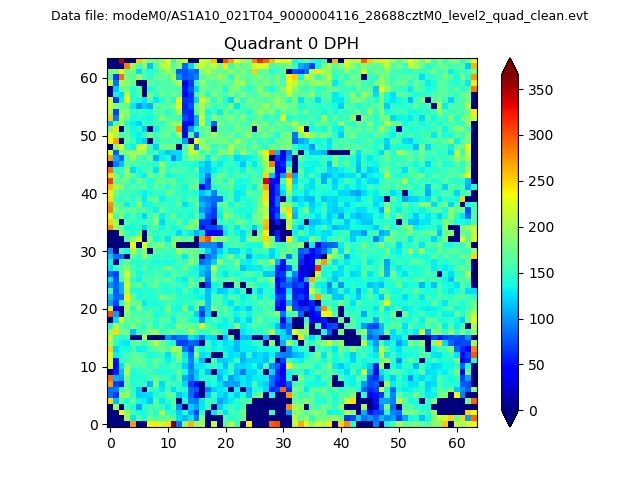 |
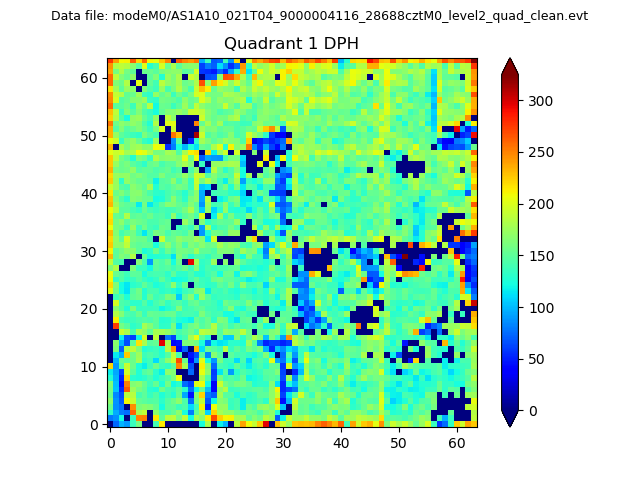 |
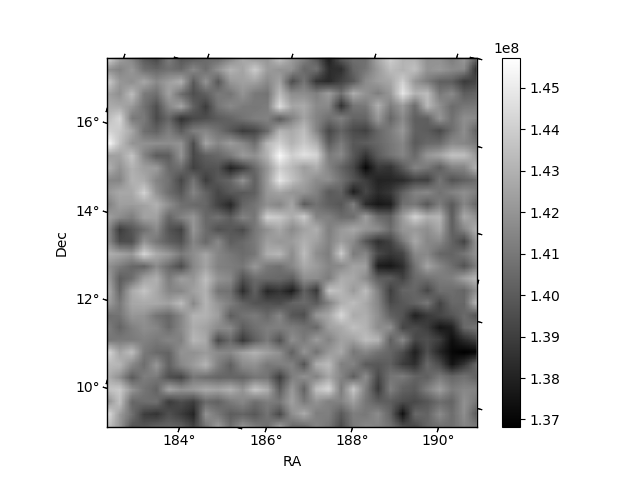
Quadrant B |
|---|---|---|---|
| Quadrant D | 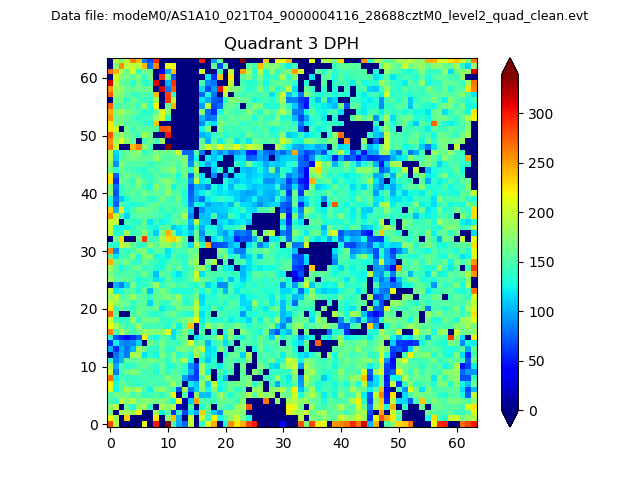 |
 |
Quadrant C |
| Plot type | Count rate plots | Images |
|---|---|---|
| Comparison with Poisson distribution Blue bars denote a histogram of data divided into 1 sec bins. Red curve is a Poisson curve with rate = median count rate of data. |
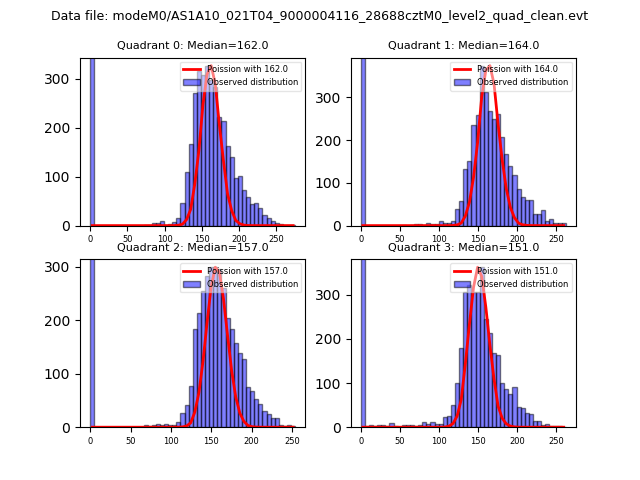 |
 |
| Quadrant-wise count rates Data is divided into 100 sec bins |
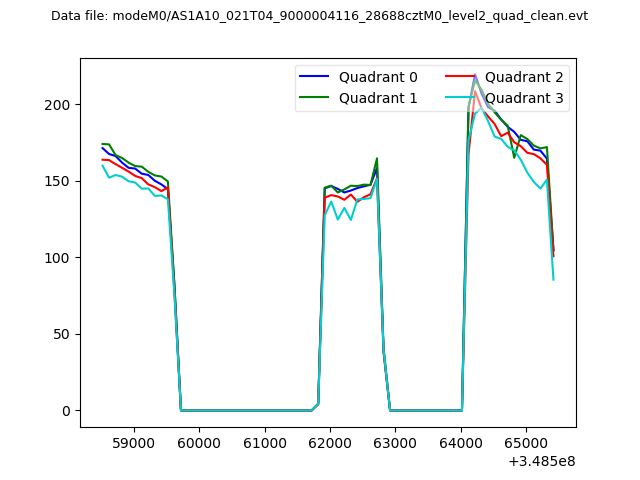 |
|
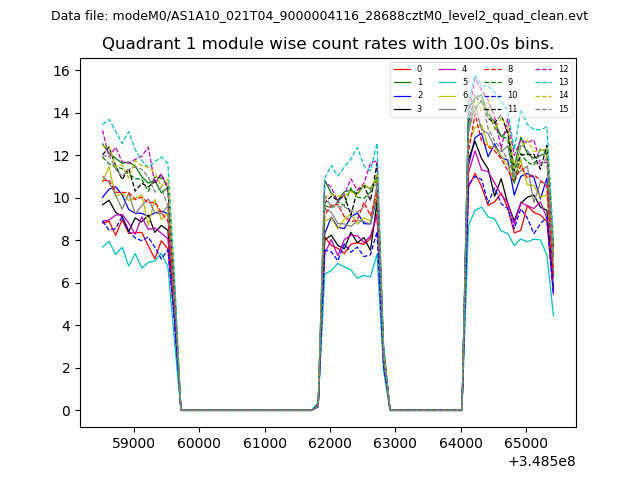
| Module-wise count rates for Quadrant A Data is divided into 100 sec bins |
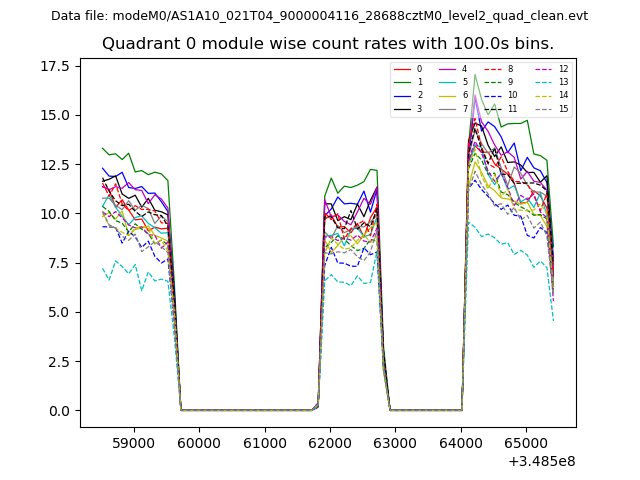 |
 |
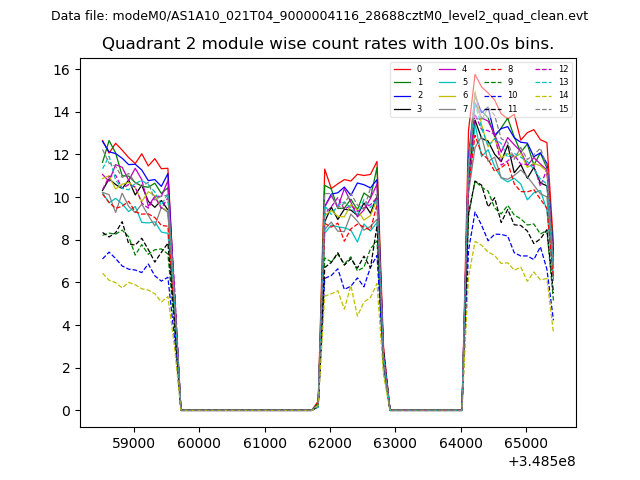
| Module-wise count rates for Quadrant B Data is divided into 100 sec bins |
 |
 |
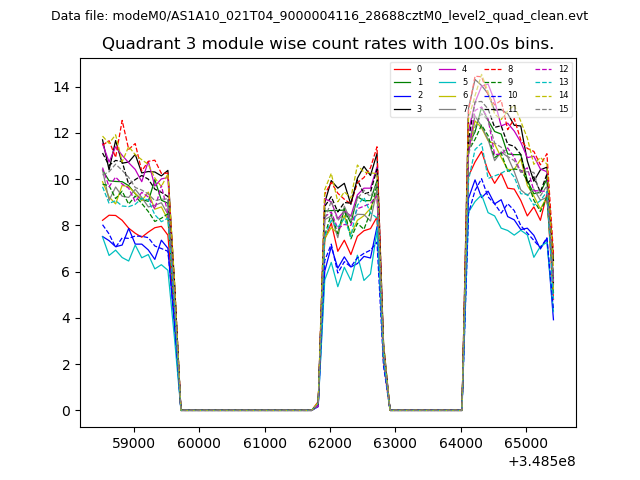
| Module-wise count rates for Quadrant C Data is divided into 100 sec bins |
 |
 |
| Module-wise count rates for Quadrant D Data is divided into 100 sec bins |
 |
 |
| Parameter | Plot |
|---|---|
| CZT HV Monitor | 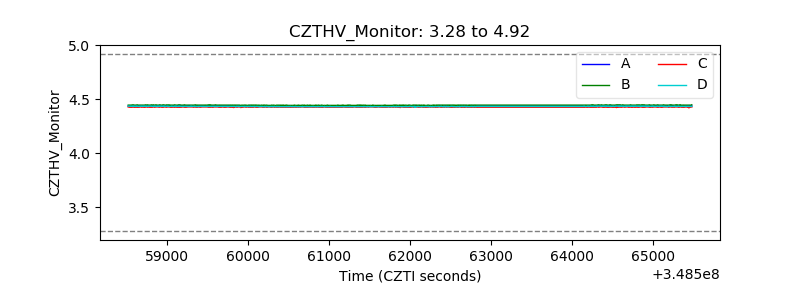 |
| D_VDD | 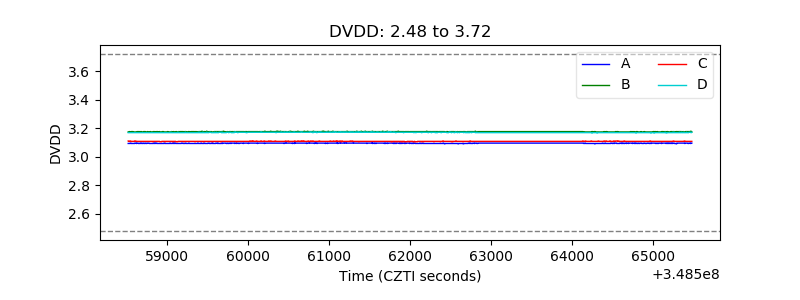 |
| Temperature 1 | 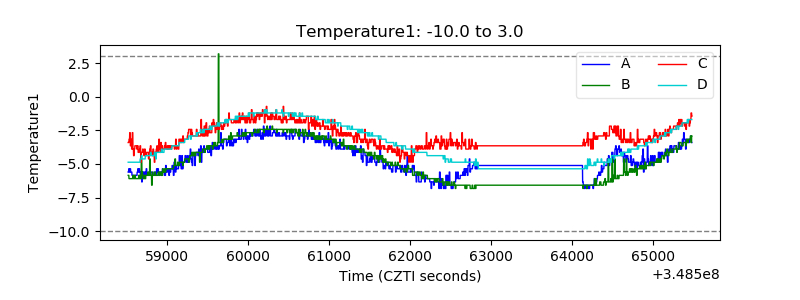 |
| Veto HV Monitor | 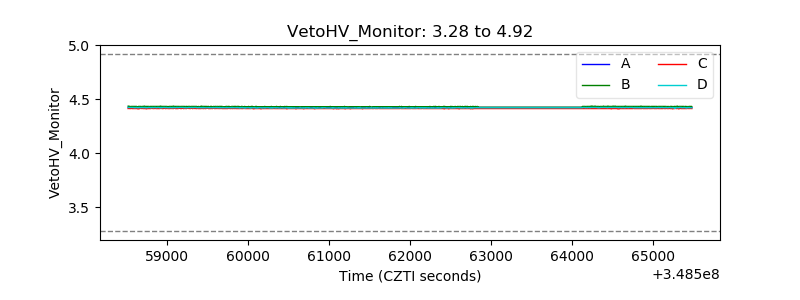 |
| Veto LLD | 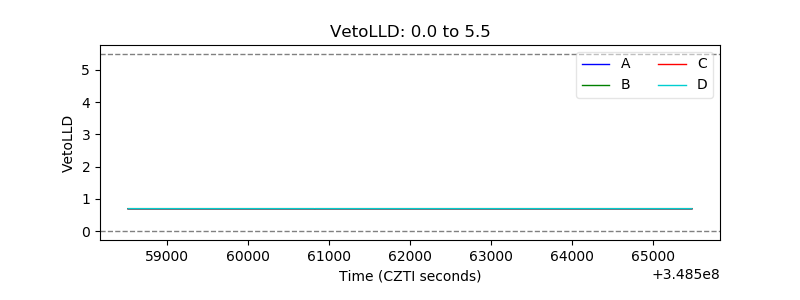 |
| Alpha Counter | 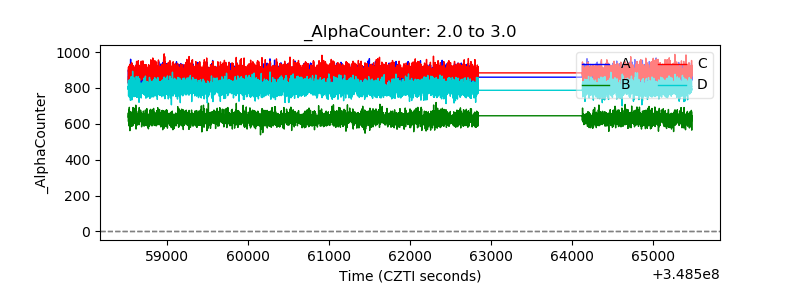 |
| _CPM_Rate | 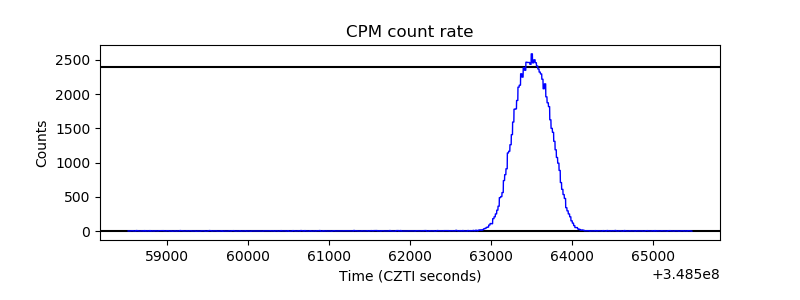 |
| CZT Counter | 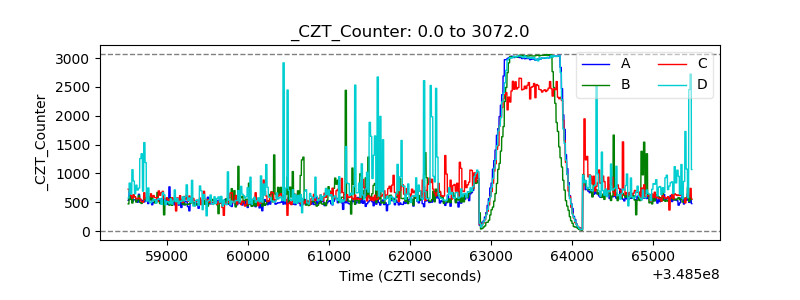 |
| +2.5 Volts monitor |  |
| +5 Volts monitor |  |
| _ROLL_ROT | 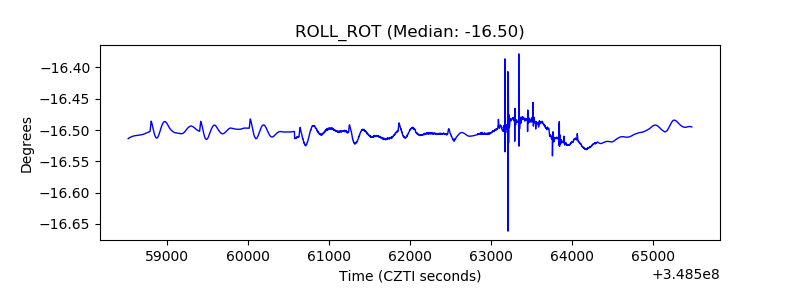 |
| _Roll_DEC | 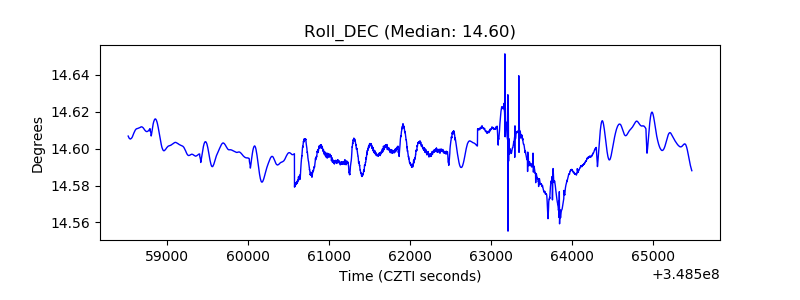 |
| _Roll_RA | 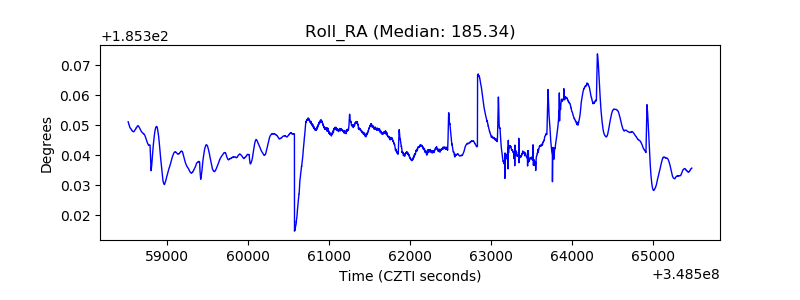 |
| Veto Counter | 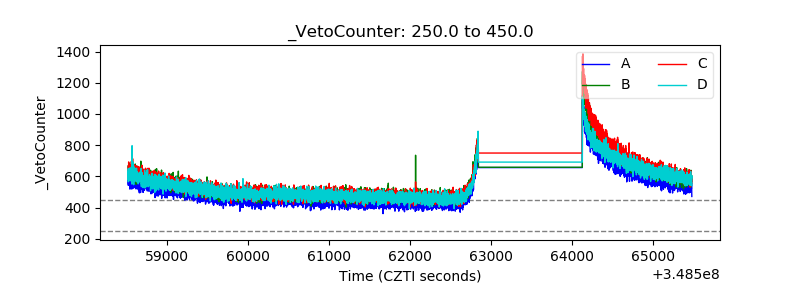 |