| Param | Original file | Final file |
|---|---|---|
| Filename | modeM0/AS1A10_021T04_9000004116_28689cztM0_level2.evt | modeM0/AS1A10_021T04_9000004116_28689cztM0_level2_quad_clean.evt |
| Size (bytes) | 622,958,400 | 82,019,520 |
| Size | 594.1 MB | 78.2 MB |
| Events in quadrant A | 3,202,608 | 542,074 |
| Events in quadrant B | 4,523,631 | 546,253 |
| Events in quadrant C | 3,714,224 | 524,432 |
| Events in quadrant D | 7,034,998 | 465,968 |
| Mode M0 | |||
|---|---|---|---|
| Quadrant | BADHDUFLAG | Total packets | Discarded packets |
| A | 0 | 12789 | 1 |
| B | 0 | 17120 | 1 |
| C | 0 | 15232 | 1 |
| D | 0 | 25031 | 1 |
| Mode SS | |||
|---|---|---|---|
| Quadrant | BADHDUFLAG | Total packets | Discarded packets |
| A | 0 | 120 | 0 |
| B | 0 | 120 | 0 |
| C | 0 | 120 | 0 |
| D | 0 | 120 | 0 |
| Mode M9 | |||
|---|---|---|---|
| Quadrant | BADHDUFLAG | Total packets | Discarded packets |
| A | 0 | 12 | 0 |
| B | 0 | 12 | 0 |
| C | 0 | 12 | 0 |
| D | 0 | 12 | 0 |
| Quadrant | Total seconds | Saturated seconds | Saturation percentage |
|---|---|---|---|
| A | 5777 | 111 | 1.921412% |
| B | 5778 | 396 | 6.853583% |
| C | 5778 | 201 | 3.478712% |
| D | 5778 | 938 | 16.233991% |
Noise dominated data is calculated using 1-second bins in cleaned event files. If a bin has >2000 counts, and if more than 50% of those come from <1% of pixels, then it is considered to be noise-dominated and hence unusable.
| Quadrant | # 1 sec bins | Bins with >0 counts | Bins with >2000 counts | High rate bins dominated by noise | Noise dominated (total time) | Noise dominated (detector-on time) | Marked lightcurve |
|---|---|---|---|---|---|---|---|
| A | 7072 | 5777 | 0 | 0 | 0.00% | 0.00% | 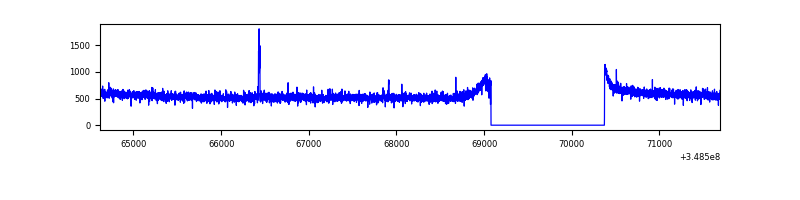 |
| B | 7073 | 5778 | 219 | 219 | 3.10% | 3.79% | 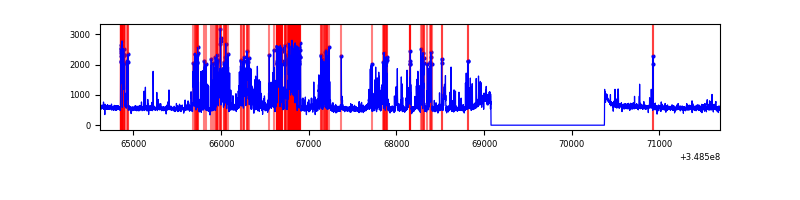 |
| C | 7073 | 5778 | 10 | 10 | 0.14% | 0.17% | 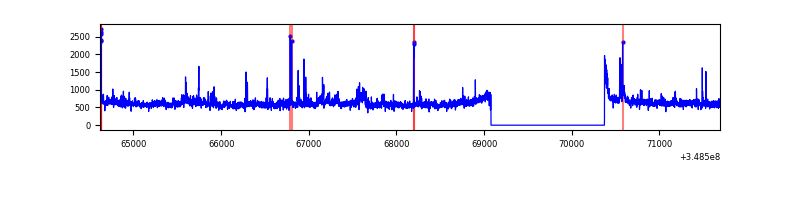 |
| D | 7073 | 5778 | 789 | 789 | 11.16% | 13.66% | 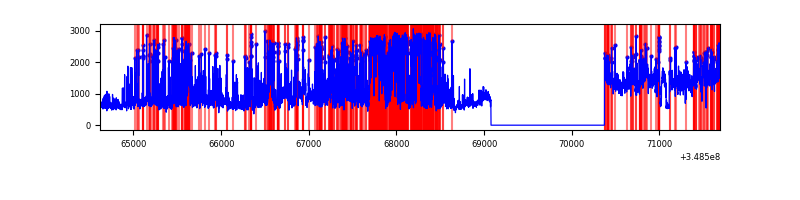 |
Top three noisy pixels from each quadrant. If the there are fewer than three noisy pixels in the level2.evt file, extra rows are filled as -1
| Pixel properties | Quadrant properties | ||||||
|---|---|---|---|---|---|---|---|
| Quadrant | DetID | PixID | Counts | Sigma | Mean | Median | Sigma |
| A | 15 | 174 | 22363 | 131.41 | 824 | 809 | 164.0 |
| A | 13 | 254 | 9784 | 54.72 | 824 | 809 | 164.0 |
| A | 3 | 137 | 7343 | 39.84 | 824 | 809 | 164.0 |
| B | 10 | 245 | 1254751 | 8442.12 | 793 | 775 | 148.5 |
| B | 15 | 33 | 118884 | 795.14 | 793 | 775 | 148.5 |
| B | 3 | 209 | 22329 | 145.11 | 793 | 775 | 148.5 |
| C | 3 | 233 | 394099 | 2167.82 | 782 | 791 | 181.4 |
| C | 14 | 238 | 142551 | 781.35 | 782 | 791 | 181.4 |
| C | 2 | 16 | 108153 | 591.75 | 782 | 791 | 181.4 |
| D | 1 | 52 | 2879125 | 16342.55 | 753 | 735 | 176.1 |
| D | 8 | 195 | 1161830 | 6592.31 | 753 | 735 | 176.1 |
| D | 2 | 120 | 37594 | 209.27 | 753 | 735 | 176.1 |
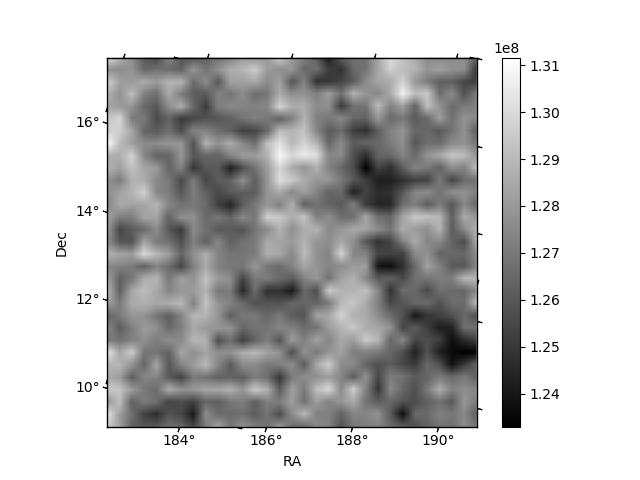
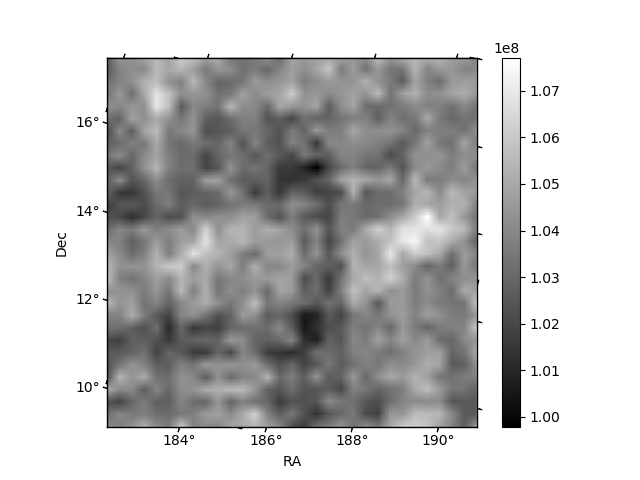
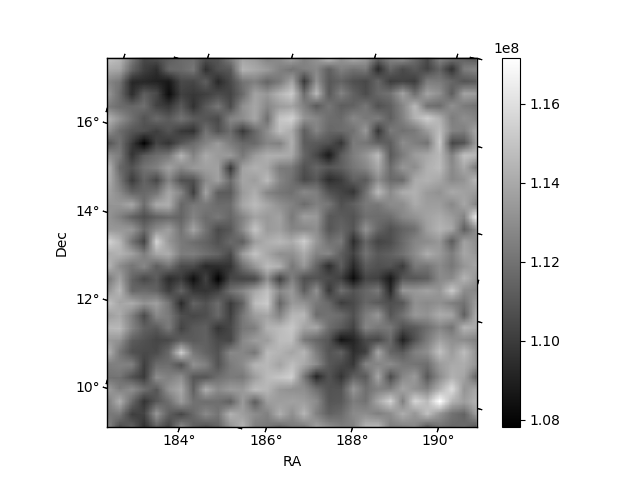
Histogram calculated using DETX and DETY for each event in the final _common_clean file
| Quadrant A | 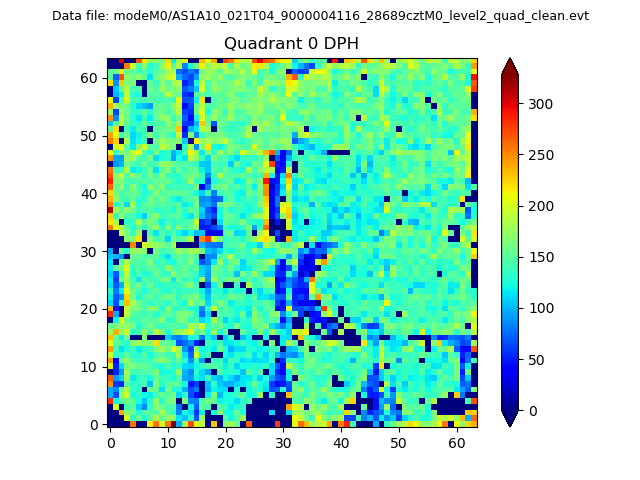 |
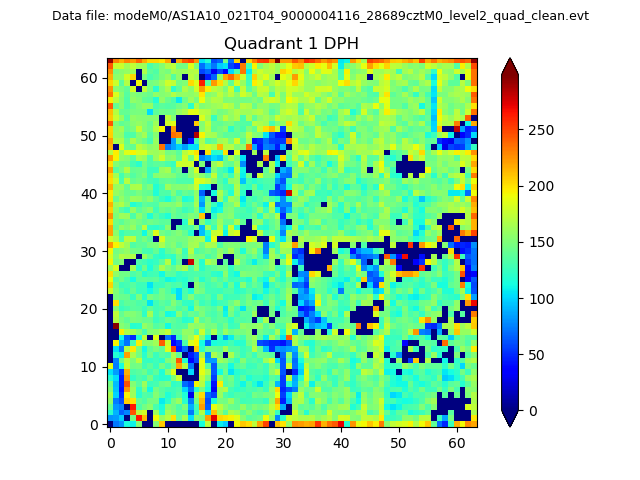 |
Quadrant B |
|---|---|---|---|
| Quadrant D | 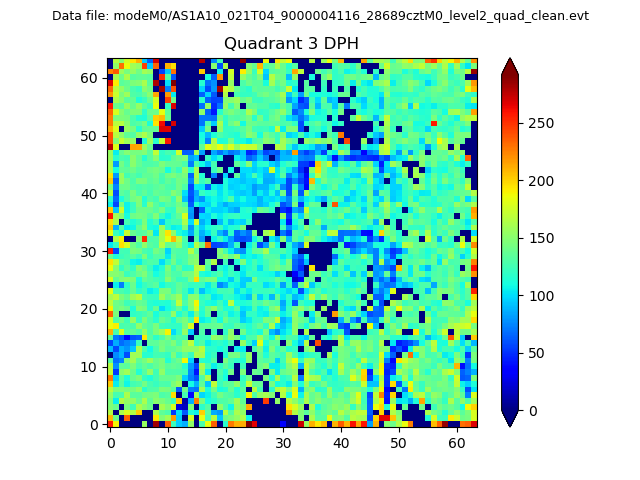 |
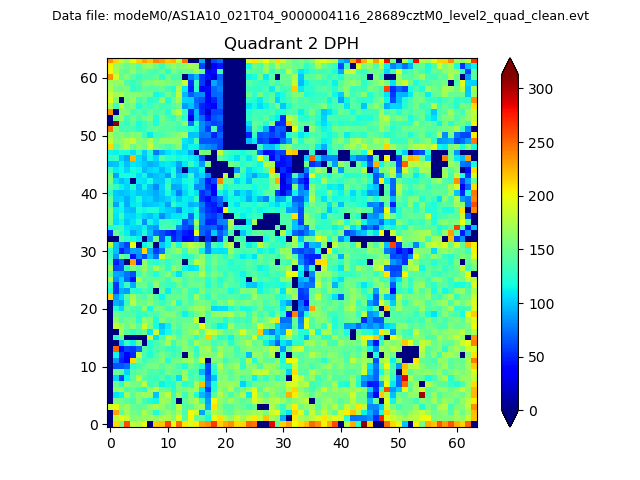 |
Quadrant C |
| Plot type | Count rate plots | Images |
|---|---|---|
| Comparison with Poisson distribution Blue bars denote a histogram of data divided into 1 sec bins. Red curve is a Poisson curve with rate = median count rate of data. |
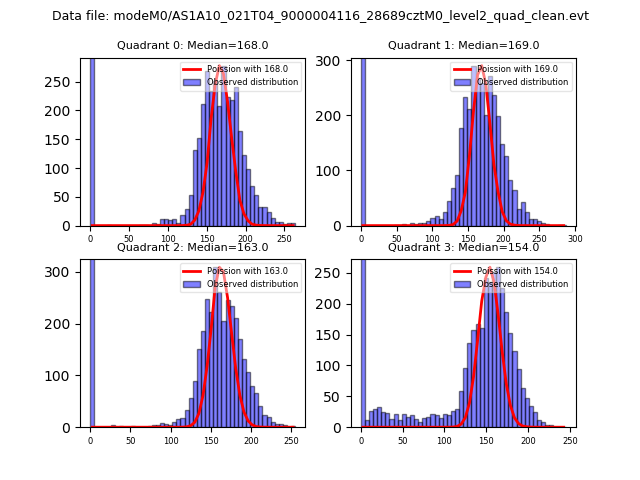 |
 |
| Quadrant-wise count rates Data is divided into 100 sec bins |
 |
|
| Module-wise count rates for Quadrant A Data is divided into 100 sec bins |
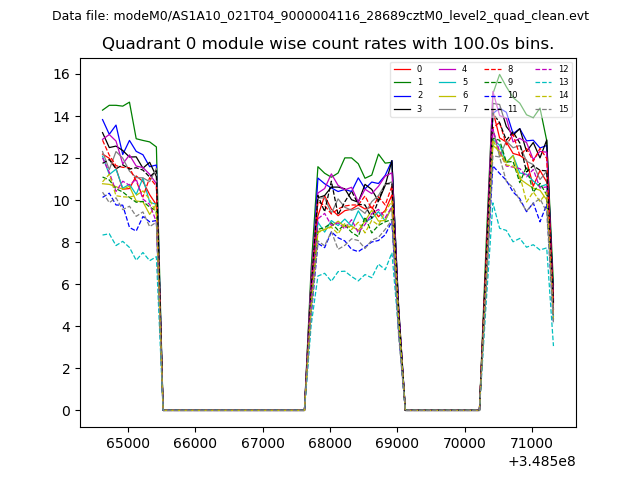 |
 |
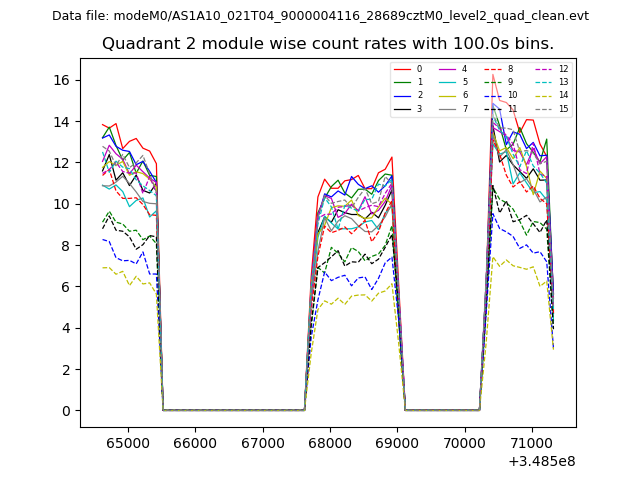
| Module-wise count rates for Quadrant B Data is divided into 100 sec bins |
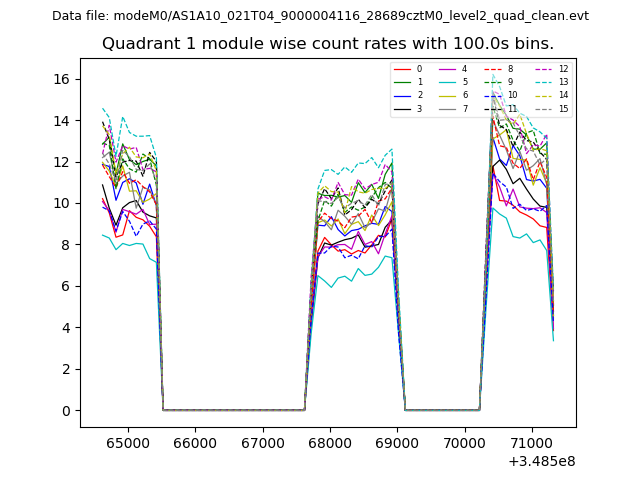 |
 |
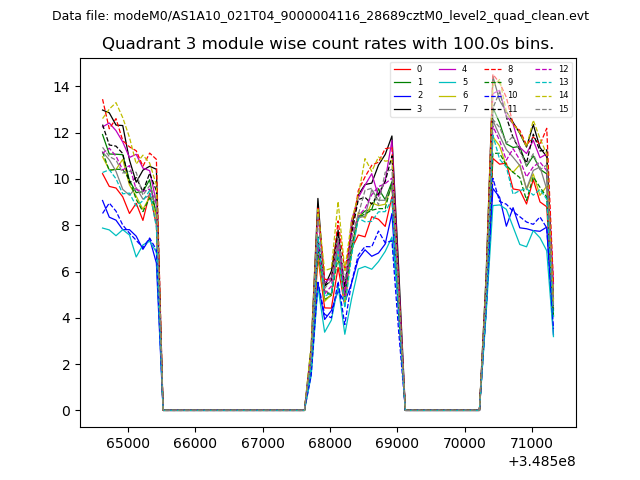
| Module-wise count rates for Quadrant C Data is divided into 100 sec bins |
 |
 |
| Module-wise count rates for Quadrant D Data is divided into 100 sec bins |
 |
 |
| Parameter | Plot |
|---|---|
| CZT HV Monitor | 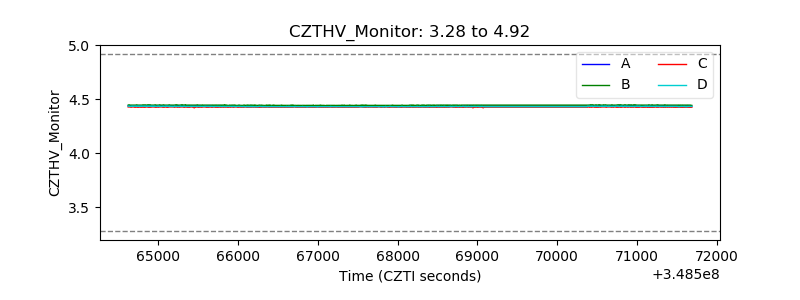 |
| D_VDD | 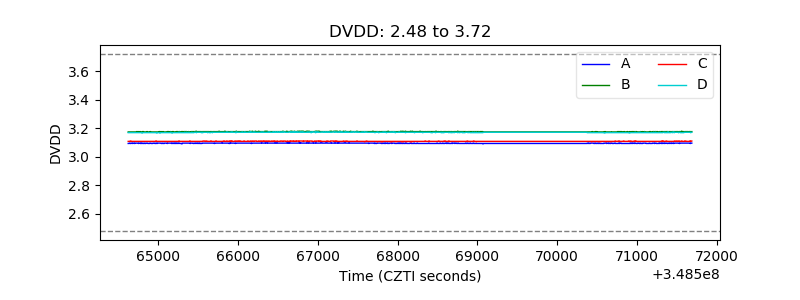 |
| Temperature 1 | 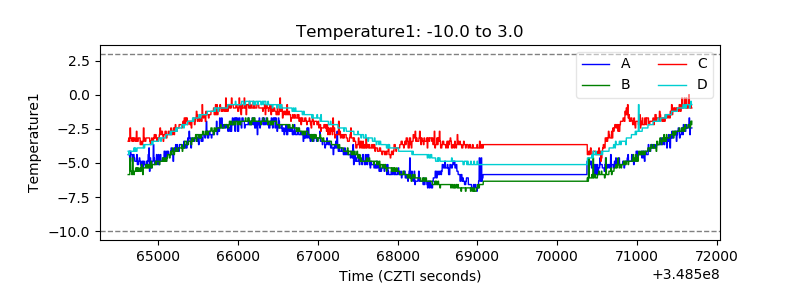 |
| Veto HV Monitor | 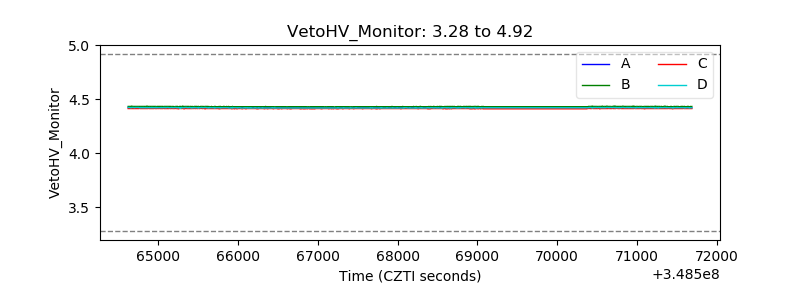 |
| Veto LLD | 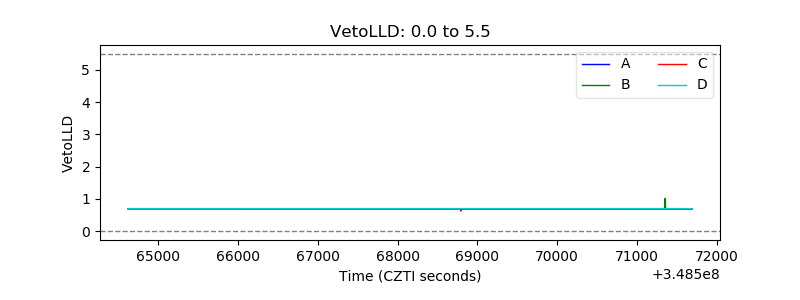 |
| Alpha Counter | 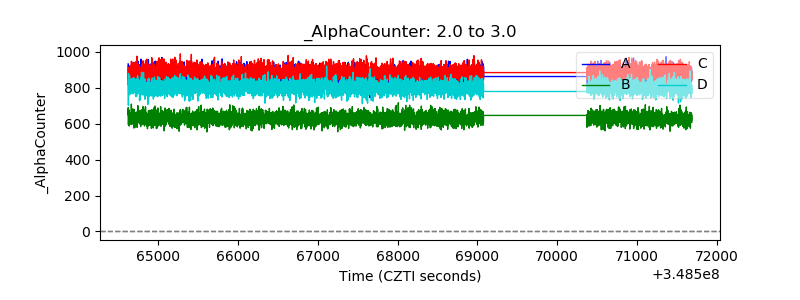 |
| _CPM_Rate |  |
| CZT Counter |  |
| +2.5 Volts monitor |  |
| +5 Volts monitor |  |
| _ROLL_ROT | 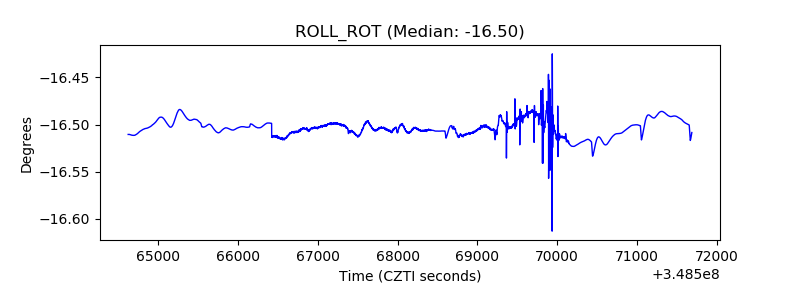 |
| _Roll_DEC | 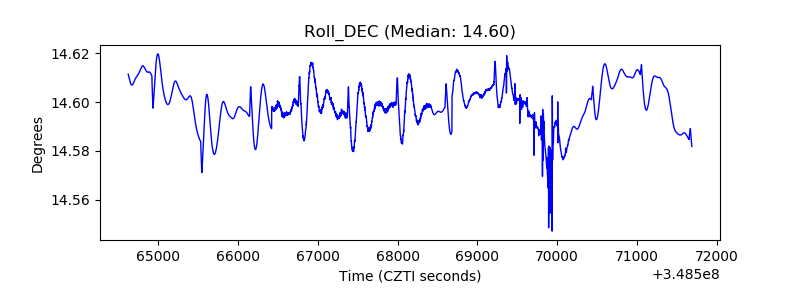 |
| _Roll_RA |  |
| Veto Counter | 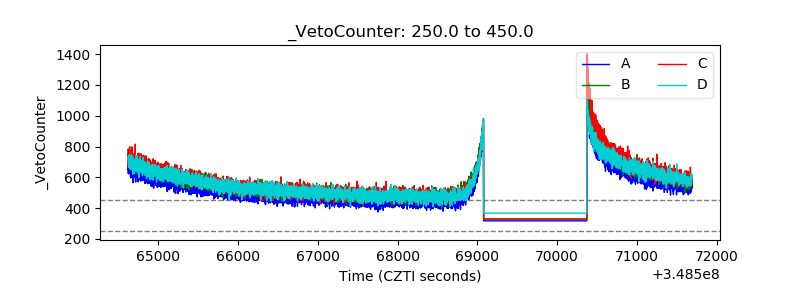 |