| Param | Original file | Final file |
|---|---|---|
| Filename | modeM0/AS1A10_021T04_9000004116_28690cztM0_level2.evt | modeM0/AS1A10_021T04_9000004116_28690cztM0_level2_quad_clean.evt |
| Size (bytes) | 684,521,280 | 79,773,120 |
| Size | 652.8 MB | 76.1 MB |
| Events in quadrant A | 3,378,688 | 515,468 |
| Events in quadrant B | 3,598,112 | 520,749 |
| Events in quadrant C | 4,048,888 | 495,768 |
| Events in quadrant D | 9,287,212 | 451,222 |
| Mode M0 | |||
|---|---|---|---|
| Quadrant | BADHDUFLAG | Total packets | Discarded packets |
| A | 0 | 13582 | 1 |
| B | 0 | 14309 | 1 |
| C | 0 | 16441 | 1 |
| D | 0 | 31963 | 2 |
| Mode SS | |||
|---|---|---|---|
| Quadrant | BADHDUFLAG | Total packets | Discarded packets |
| A | 0 | 126 | 0 |
| B | 0 | 126 | 0 |
| C | 0 | 126 | 0 |
| D | 0 | 126 | 0 |
| Mode M9 | |||
|---|---|---|---|
| Quadrant | BADHDUFLAG | Total packets | Discarded packets |
| A | 0 | 13 | 0 |
| B | 0 | 13 | 0 |
| C | 0 | 13 | 0 |
| D | 0 | 13 | 0 |
| Quadrant | Total seconds | Saturated seconds | Saturation percentage |
|---|---|---|---|
| A | 6188 | 106 | 1.712993% |
| B | 6189 | 166 | 2.682178% |
| C | 6189 | 259 | 4.184844% |
| D | 6188 | 1674 | 27.052359% |
Noise dominated data is calculated using 1-second bins in cleaned event files. If a bin has >2000 counts, and if more than 50% of those come from <1% of pixels, then it is considered to be noise-dominated and hence unusable.
| Quadrant | # 1 sec bins | Bins with >0 counts | Bins with >2000 counts | High rate bins dominated by noise | Noise dominated (total time) | Noise dominated (detector-on time) | Marked lightcurve |
|---|---|---|---|---|---|---|---|
| A | 7473 | 6188 | 0 | 0 | 0.00% | 0.00% |  |
| B | 7473 | 6188 | 37 | 37 | 0.50% | 0.60% |  |
| C | 7474 | 6189 | 2 | 2 | 0.03% | 0.03% |  |
| D | 7473 | 6188 | 1765 | 1765 | 23.62% | 28.52% |  |
Top three noisy pixels from each quadrant. If the there are fewer than three noisy pixels in the level2.evt file, extra rows are filled as -1
| Pixel properties | Quadrant properties | ||||||
|---|---|---|---|---|---|---|---|
| Quadrant | DetID | PixID | Counts | Sigma | Mean | Median | Sigma |
| A | 13 | 254 | 11085 | 58.7 | 875 | 860 | 174.2 |
| A | 3 | 137 | 7734 | 39.46 | 875 | 860 | 174.2 |
| A | 0 | 226 | 7659 | 39.03 | 875 | 860 | 174.2 |
| B | 15 | 33 | 119300 | 742.71 | 850 | 832 | 159.5 |
| B | 10 | 245 | 108850 | 677.2 | 850 | 832 | 159.5 |
| B | 3 | 209 | 23209 | 140.29 | 850 | 832 | 159.5 |
| C | 3 | 233 | 495598 | 2591.11 | 830 | 839 | 190.9 |
| C | 14 | 238 | 173982 | 906.77 | 830 | 839 | 190.9 |
| C | 2 | 16 | 88949 | 461.44 | 830 | 839 | 190.9 |
| D | 8 | 195 | 3097526 | 16748.12 | 783 | 765 | 184.9 |
| D | 1 | 52 | 3068138 | 16589.19 | 783 | 765 | 184.9 |
| D | 7 | 238 | 38035 | 201.56 | 783 | 765 | 184.9 |
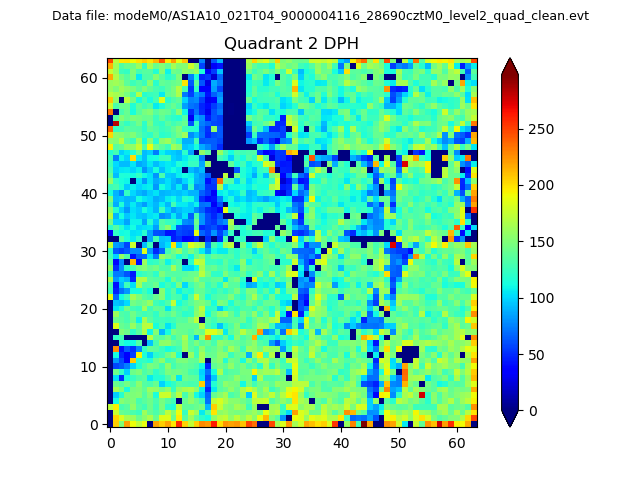
Histogram calculated using DETX and DETY for each event in the final _common_clean file
| Quadrant A | 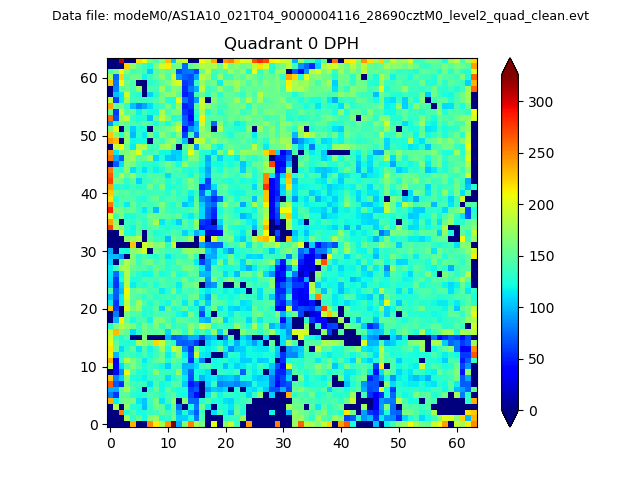 |
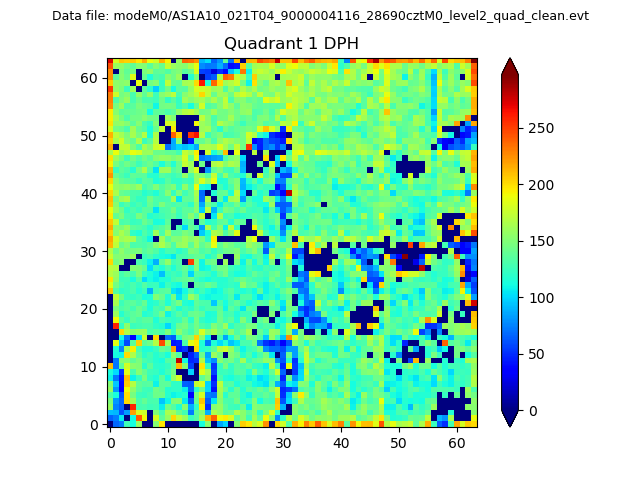 |
Quadrant B |
|---|---|---|---|
| Quadrant D | 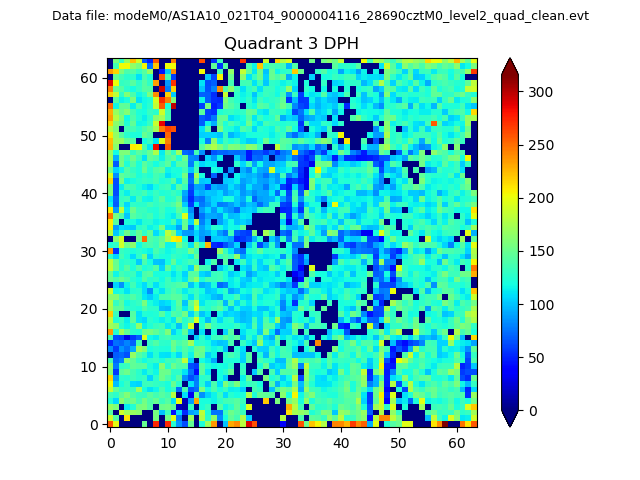 |
 |
Quadrant C |
| Plot type | Count rate plots | Images |
|---|---|---|
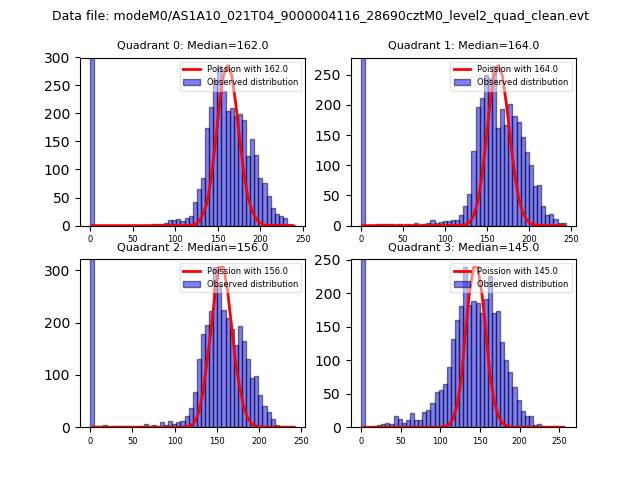
| Comparison with Poisson distribution Blue bars denote a histogram of data divided into 1 sec bins. Red curve is a Poisson curve with rate = median count rate of data. |
 |
 |
| Quadrant-wise count rates Data is divided into 100 sec bins |
 |
|
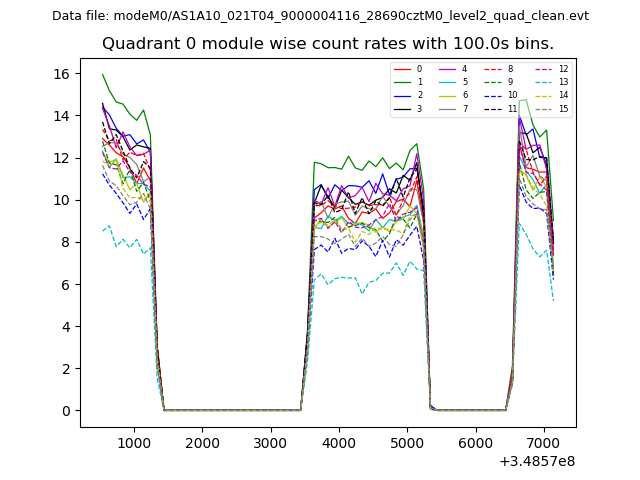
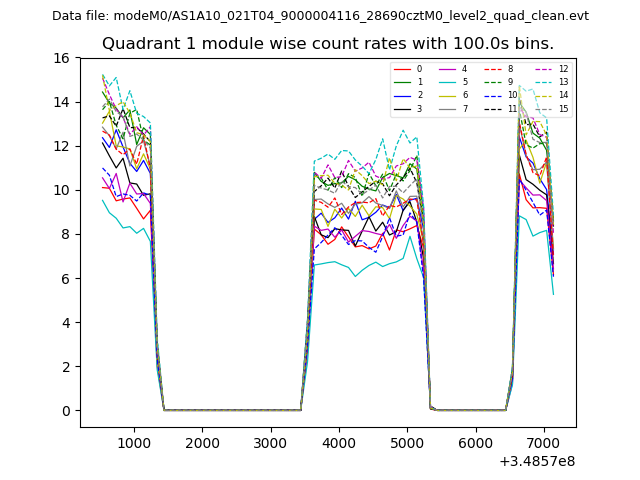
| Module-wise count rates for Quadrant A Data is divided into 100 sec bins |
 |
 |
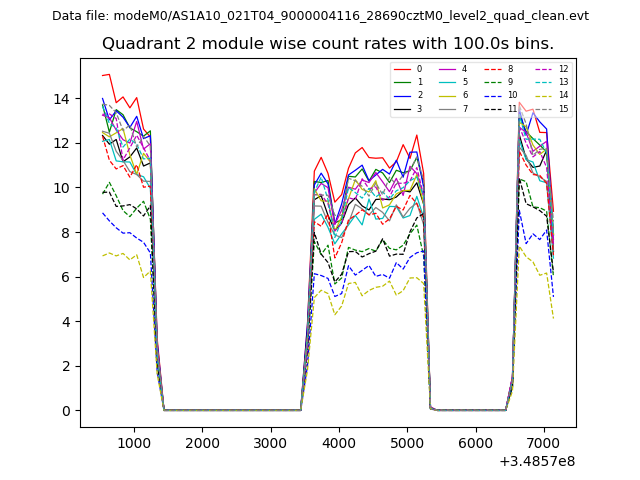
| Module-wise count rates for Quadrant B Data is divided into 100 sec bins |
 |
 |
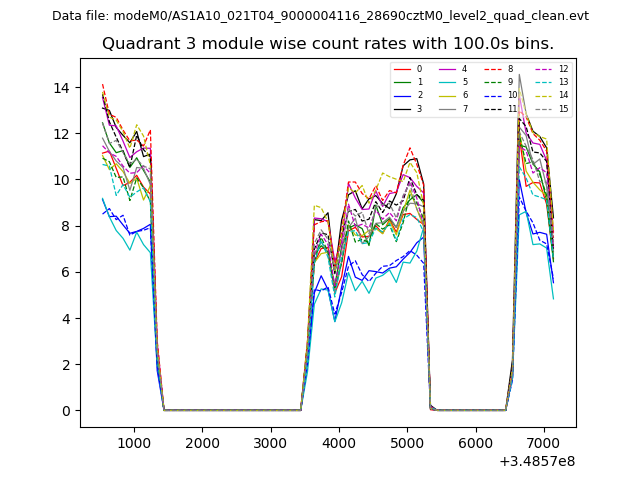
| Module-wise count rates for Quadrant C Data is divided into 100 sec bins |
 |
 |
| Module-wise count rates for Quadrant D Data is divided into 100 sec bins |
 |
 |
| Parameter | Plot |
|---|---|
| CZT HV Monitor | 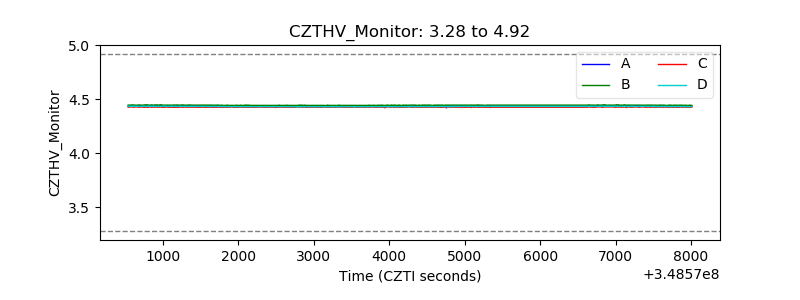 |
| D_VDD | 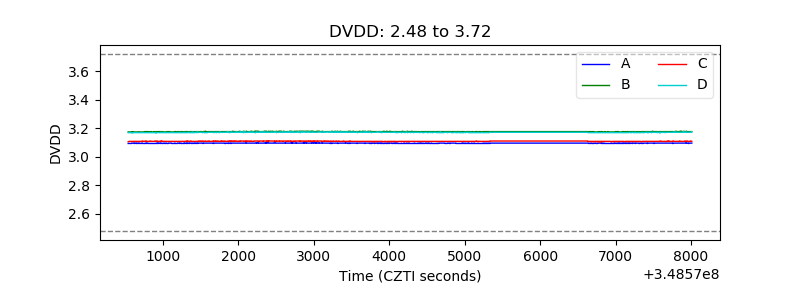 |
| Temperature 1 | 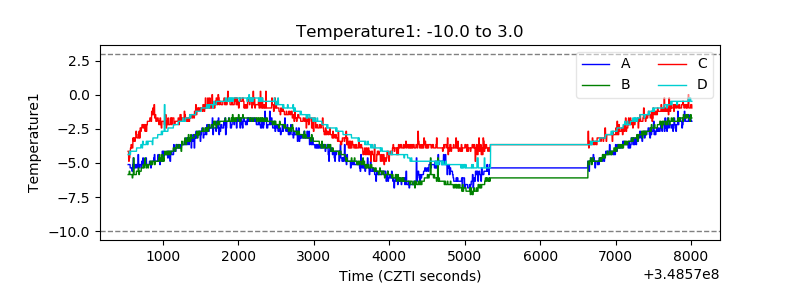 |
| Veto HV Monitor | 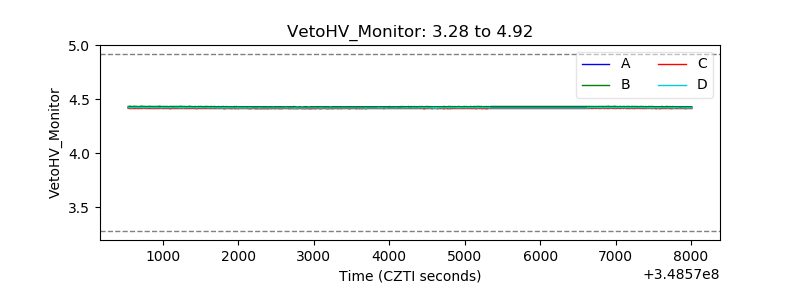 |
| Veto LLD | 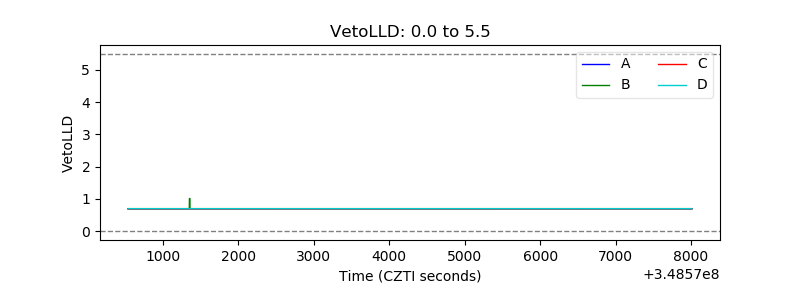 |
| Alpha Counter | 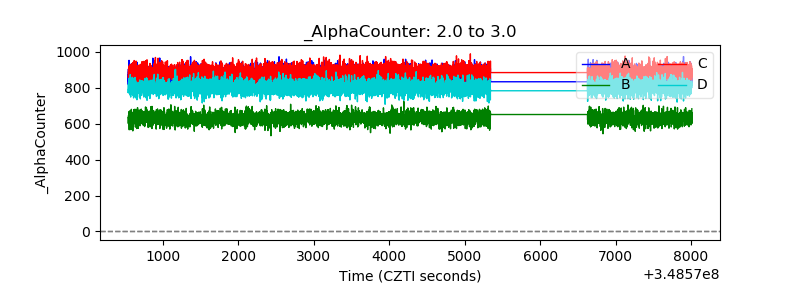 |
| _CPM_Rate | 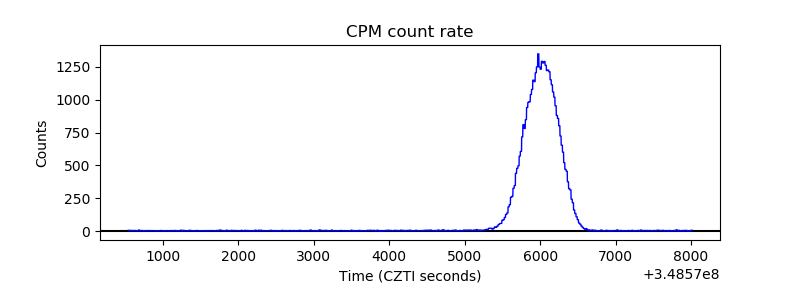 |
| CZT Counter |  |
| +2.5 Volts monitor |  |
| +5 Volts monitor |  |
| _ROLL_ROT | 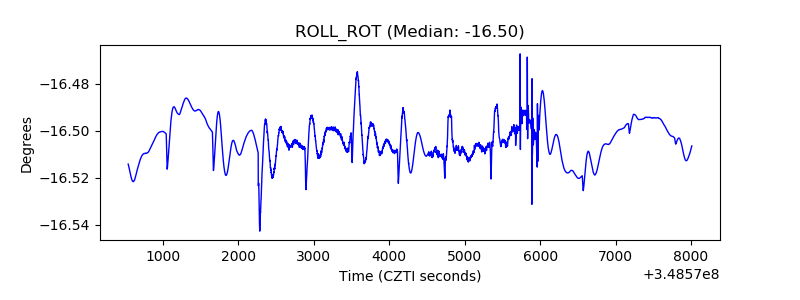 |
| _Roll_DEC | 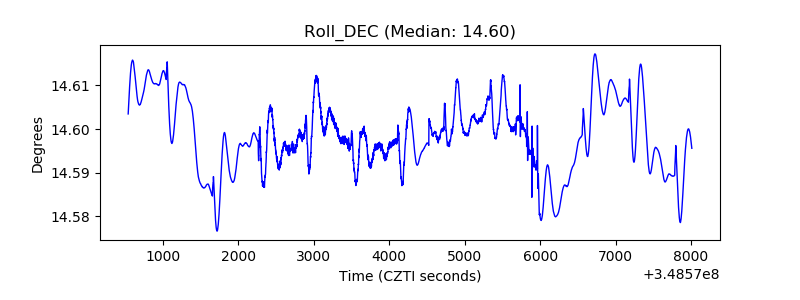 |
| _Roll_RA |  |
| Veto Counter | 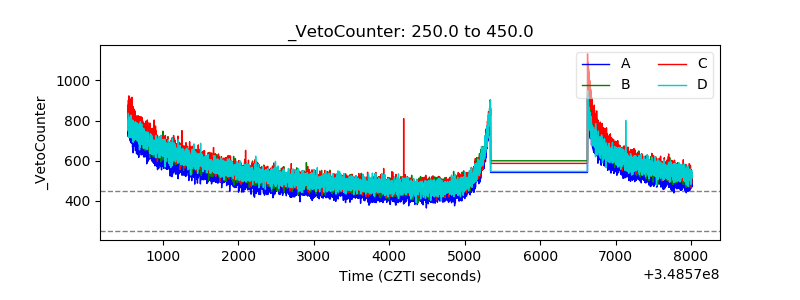 |