| Param | Original file | Final file |
|---|---|---|
| Filename | modeM0/AS1A10_021T04_9000004116_28692cztM0_level2.evt | modeM0/AS1A10_021T04_9000004116_28692cztM0_level2_quad_clean.evt |
| Size (bytes) | 584,648,640 | 73,604,160 |
| Size | 557.6 MB | 70.2 MB |
| Events in quadrant A | 3,559,521 | 439,667 |
| Events in quadrant B | 4,292,330 | 444,909 |
| Events in quadrant C | 3,857,890 | 430,918 |
| Events in quadrant D | 5,515,560 | 419,064 |
| Mode M0 | |||
|---|---|---|---|
| Quadrant | BADHDUFLAG | Total packets | Discarded packets |
| A | 0 | 14828 | 2 |
| B | 0 | 17088 | 2 |
| C | 0 | 15645 | 2 |
| D | 0 | 21251 | 2 |
| Mode SS | |||
|---|---|---|---|
| Quadrant | BADHDUFLAG | Total packets | Discarded packets |
| A | 0 | 144 | 0 |
| B | 0 | 144 | 0 |
| C | 0 | 144 | 0 |
| D | 0 | 144 | 0 |
| Mode M9 | |||
|---|---|---|---|
| Quadrant | BADHDUFLAG | Total packets | Discarded packets |
| A | 0 | 8 | 0 |
| B | 0 | 9 | 0 |
| C | 0 | 9 | 0 |
| D | 0 | 9 | 0 |
| Quadrant | Total seconds | Saturated seconds | Saturation percentage |
|---|---|---|---|
| A | 7096 | 90 | 1.268320% |
| B | 7096 | 333 | 4.692785% |
| C | 7096 | 172 | 2.423901% |
| D | 7096 | 325 | 4.580045% |
Noise dominated data is calculated using 1-second bins in cleaned event files. If a bin has >2000 counts, and if more than 50% of those come from <1% of pixels, then it is considered to be noise-dominated and hence unusable.
| Quadrant | # 1 sec bins | Bins with >0 counts | Bins with >2000 counts | High rate bins dominated by noise | Noise dominated (total time) | Noise dominated (detector-on time) | Marked lightcurve |
|---|---|---|---|---|---|---|---|
| A | 7896 | 7096 | 0 | 0 | 0.00% | 0.00% | 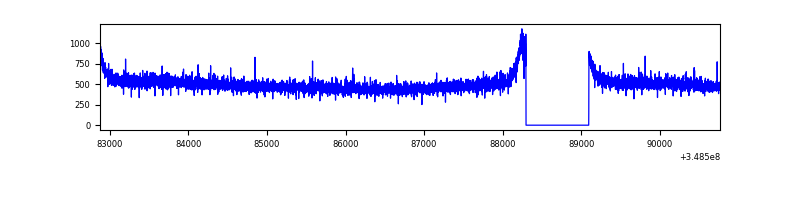 |
| B | 7896 | 7096 | 160 | 160 | 2.03% | 2.25% | 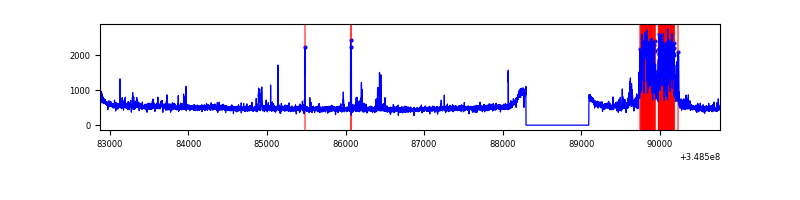 |
| C | 7896 | 7096 | 7 | 7 | 0.09% | 0.10% | 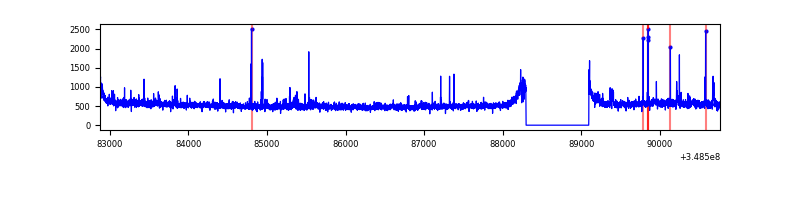 |
| D | 7896 | 7096 | 228 | 228 | 2.89% | 3.21% | 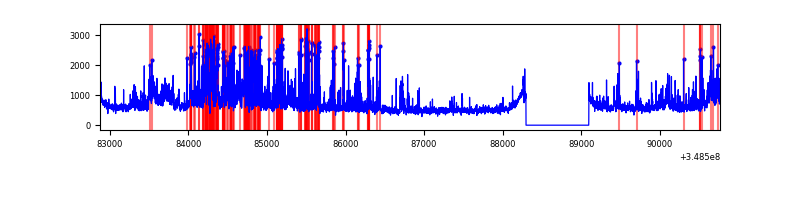 |
Top three noisy pixels from each quadrant. If the there are fewer than three noisy pixels in the level2.evt file, extra rows are filled as -1
| Pixel properties | Quadrant properties | ||||||
|---|---|---|---|---|---|---|---|
| Quadrant | DetID | PixID | Counts | Sigma | Mean | Median | Sigma |
| A | 13 | 254 | 13230 | 66.55 | 920 | 898 | 185.3 |
| A | 3 | 137 | 8856 | 42.95 | 920 | 898 | 185.3 |
| A | 0 | 226 | 7969 | 38.16 | 920 | 898 | 185.3 |
| B | 10 | 245 | 720727 | 4155.21 | 899 | 876 | 173.2 |
| B | 12 | 111 | 21136 | 116.95 | 899 | 876 | 173.2 |
| B | 3 | 209 | 20551 | 113.57 | 899 | 876 | 173.2 |
| C | 3 | 233 | 198442 | 956.54 | 882 | 891 | 206.5 |
| C | 14 | 238 | 145813 | 701.71 | 882 | 891 | 206.5 |
| C | 2 | 16 | 71456 | 341.67 | 882 | 891 | 206.5 |
| D | 1 | 52 | 1551478 | 7211.28 | 887 | 864 | 215.0 |
| D | 8 | 195 | 441226 | 2047.94 | 887 | 864 | 215.0 |
| D | 7 | 80 | 59503 | 272.7 | 887 | 864 | 215.0 |
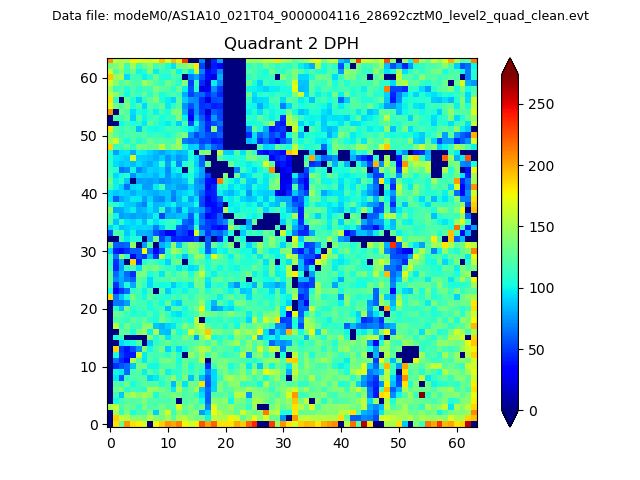
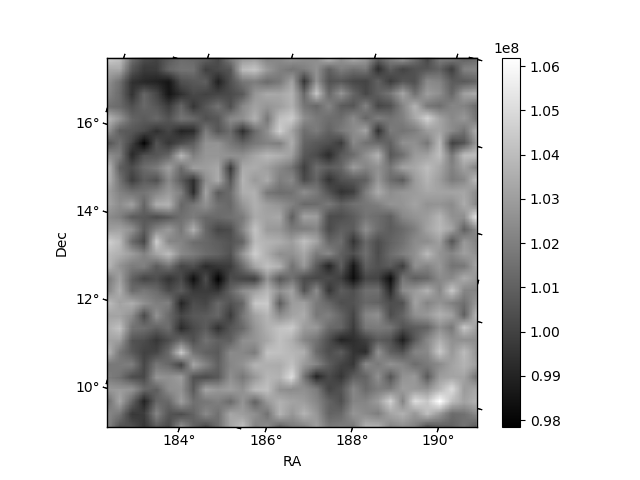
Histogram calculated using DETX and DETY for each event in the final _common_clean file
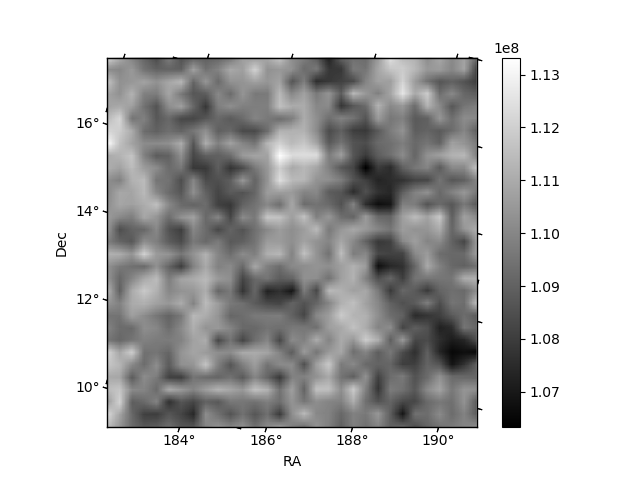
| Quadrant A | 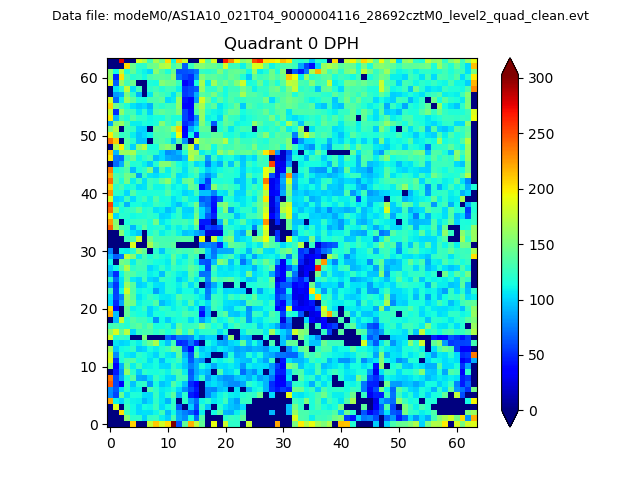 |
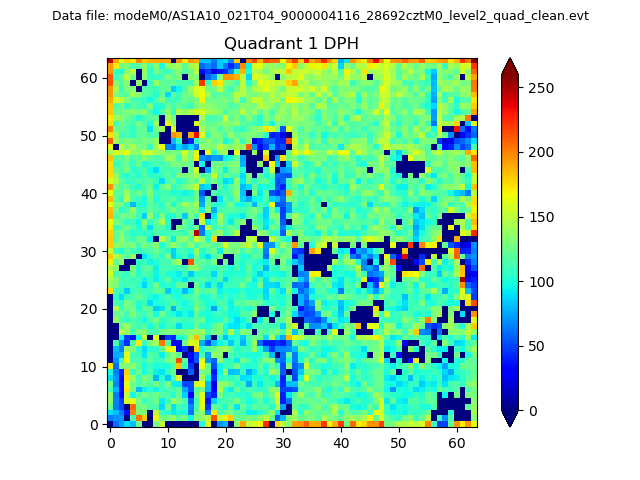 |
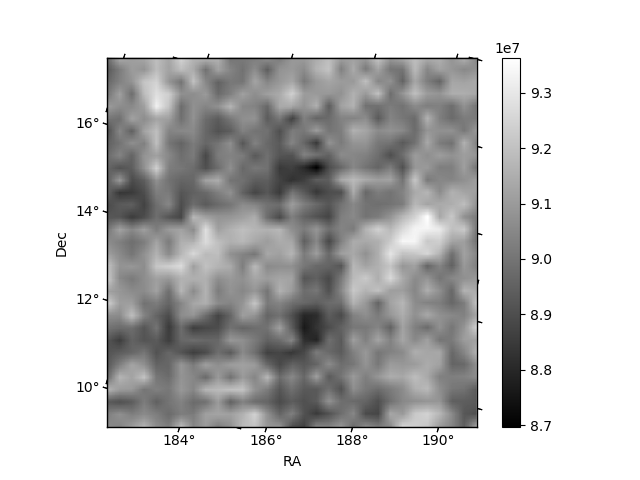
Quadrant B |
|---|---|---|---|
| Quadrant D | 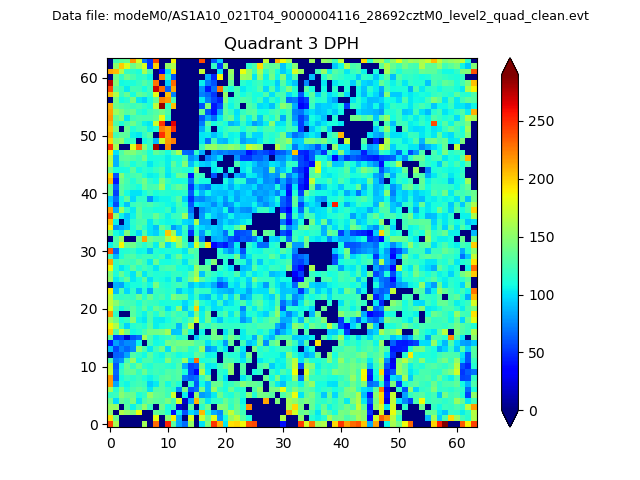 |
 |
Quadrant C |
| Plot type | Count rate plots | Images |
|---|---|---|
| Comparison with Poisson distribution Blue bars denote a histogram of data divided into 1 sec bins. Red curve is a Poisson curve with rate = median count rate of data. |
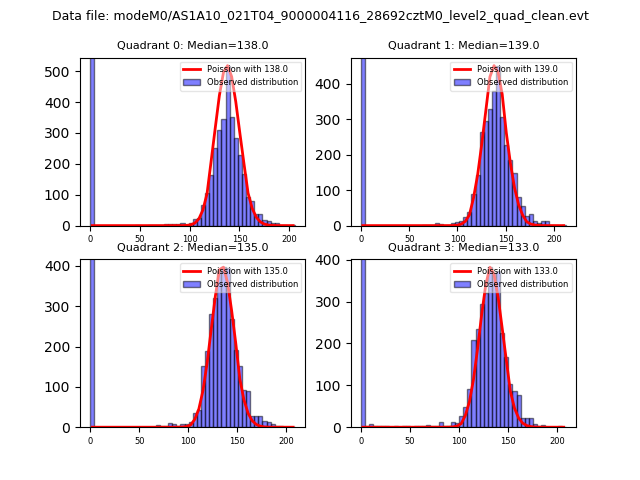 |
 |
| Quadrant-wise count rates Data is divided into 100 sec bins |
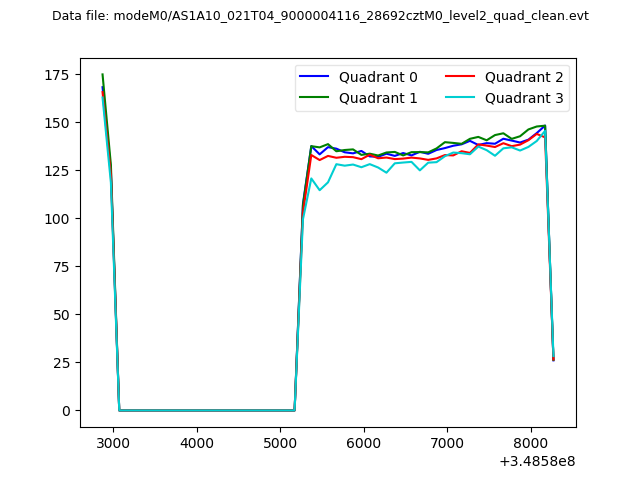 |
|
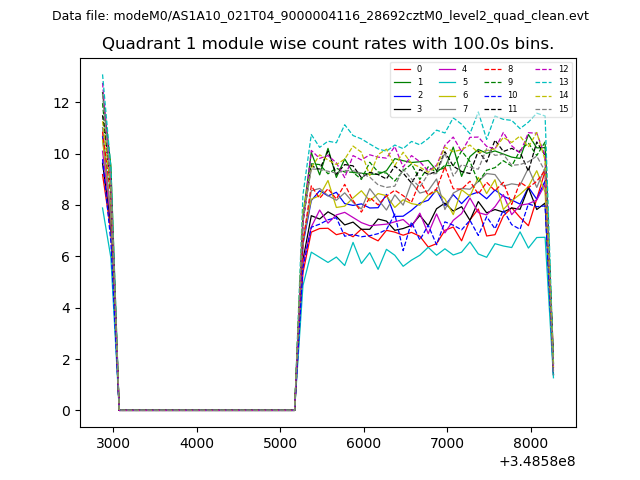
| Module-wise count rates for Quadrant A Data is divided into 100 sec bins |
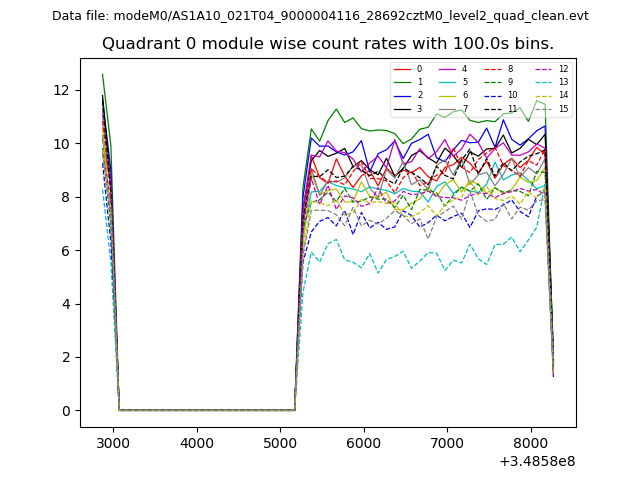 |
 |
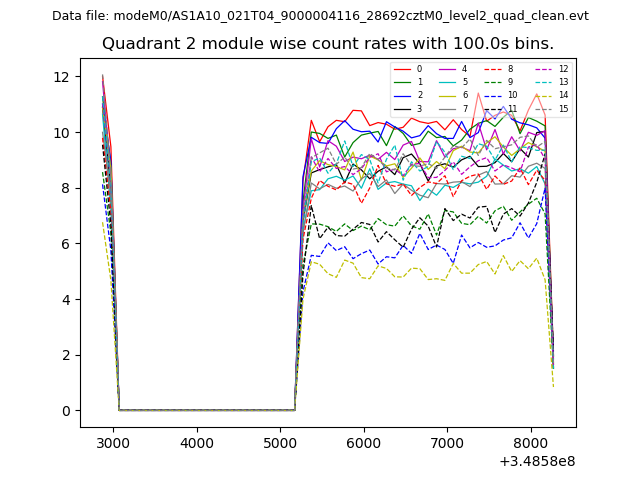
| Module-wise count rates for Quadrant B Data is divided into 100 sec bins |
 |
 |
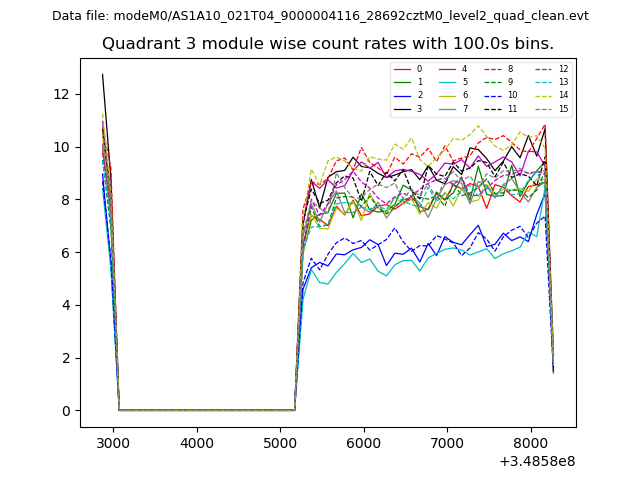
| Module-wise count rates for Quadrant C Data is divided into 100 sec bins |
 |
 |
| Module-wise count rates for Quadrant D Data is divided into 100 sec bins |
 |
 |
| Parameter | Plot |
|---|---|
| CZT HV Monitor | 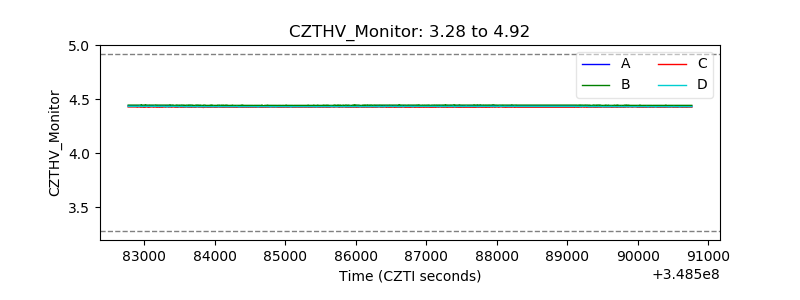 |
| D_VDD | 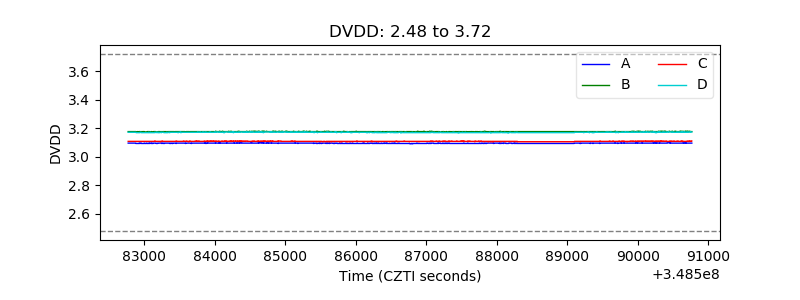 |
| Temperature 1 | 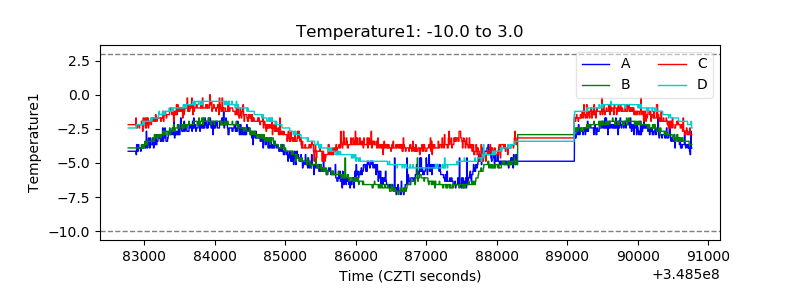 |
| Veto HV Monitor | 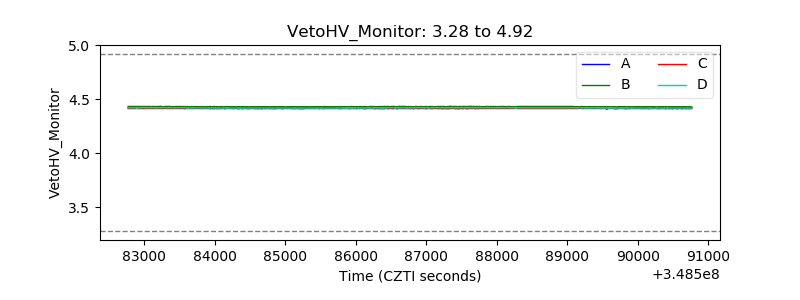 |
| Veto LLD | 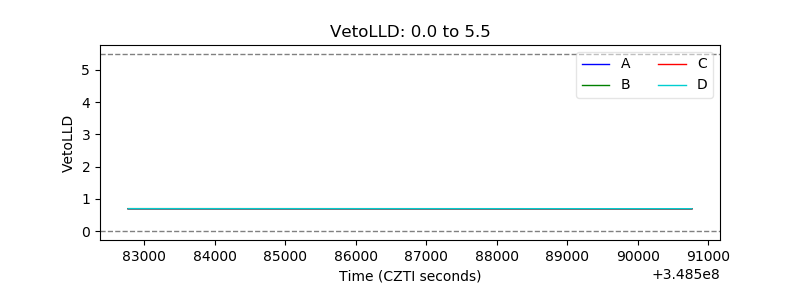 |
| Alpha Counter | 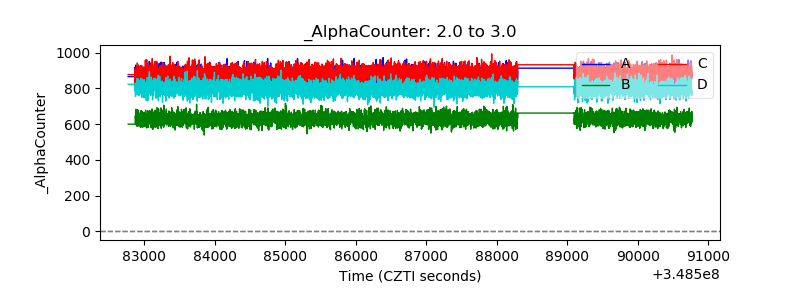 |
| _CPM_Rate | 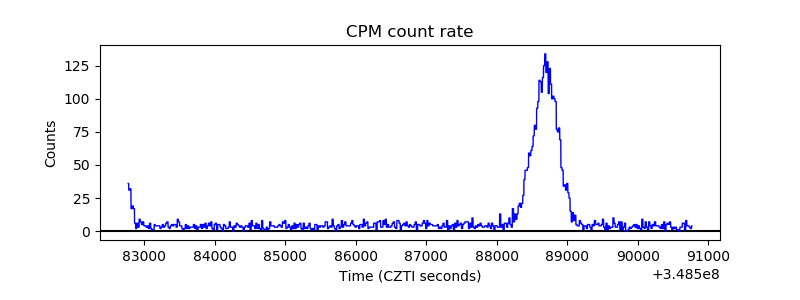 |
| CZT Counter | 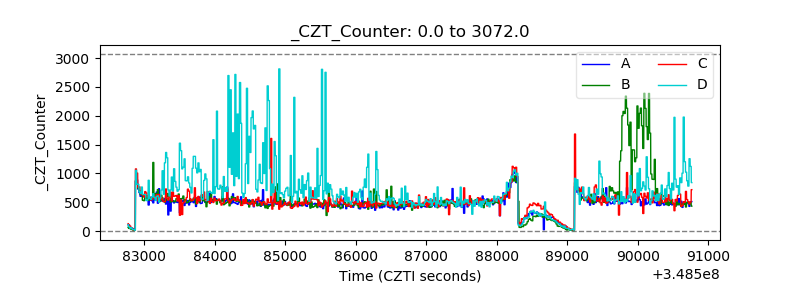 |
| +2.5 Volts monitor |  |
| +5 Volts monitor |  |
| _ROLL_ROT | 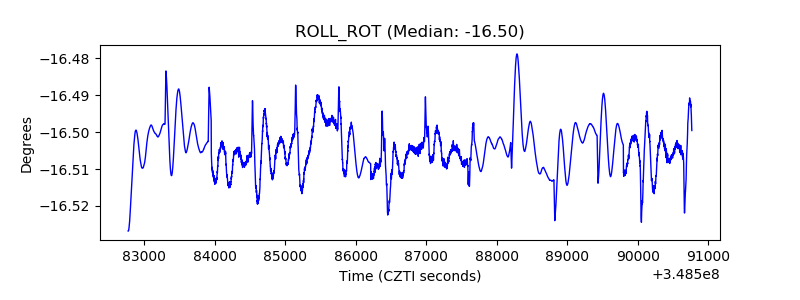 |
| _Roll_DEC | 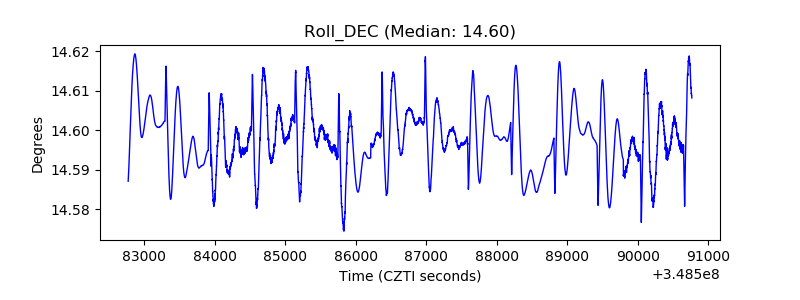 |
| _Roll_RA | 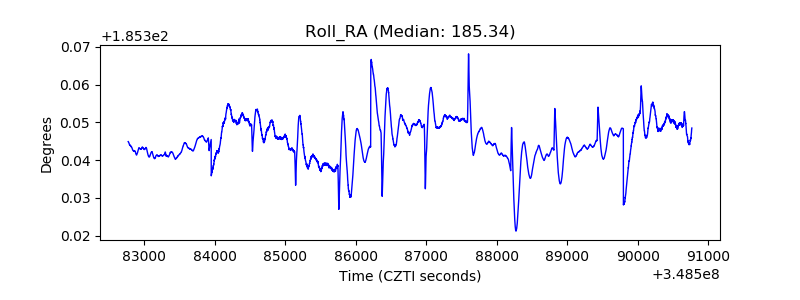 |
| Veto Counter | 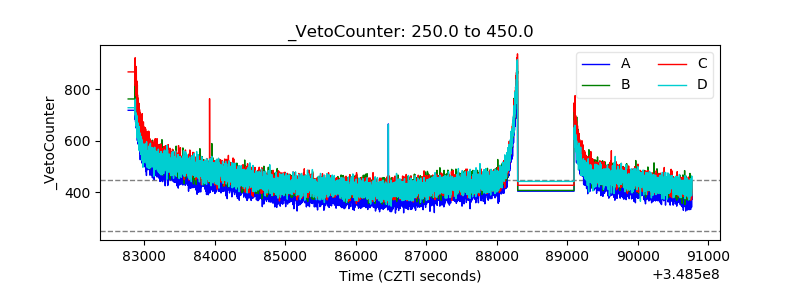 |