| Param | Original file | Final file |
|---|---|---|
| Filename | modeM0/AS1A10_021T04_9000004116_28694cztM0_level2.evt | modeM0/AS1A10_021T04_9000004116_28694cztM0_level2_quad_clean.evt |
| Size (bytes) | 643,158,720 | 86,143,680 |
| Size | 613.4 MB | 82.2 MB |
| Events in quadrant A | 4,046,090 | 520,901 |
| Events in quadrant B | 4,284,965 | 528,004 |
| Events in quadrant C | 4,510,534 | 502,850 |
| Events in quadrant D | 6,091,047 | 497,128 |
| Mode M0 | |||
|---|---|---|---|
| Quadrant | BADHDUFLAG | Total packets | Discarded packets |
| A | 0 | 17098 | 2 |
| B | 0 | 17879 | 2 |
| C | 0 | 18375 | 2 |
| D | 0 | 23790 | 2 |
| Mode SS | |||
|---|---|---|---|
| Quadrant | BADHDUFLAG | Total packets | Discarded packets |
| A | 0 | 162 | 0 |
| B | 0 | 162 | 0 |
| C | 0 | 162 | 0 |
| D | 0 | 162 | 0 |
| Mode M9 | |||
|---|---|---|---|
| Quadrant | BADHDUFLAG | Total packets | Discarded packets |
| A | 0 | 6 | 0 |
| B | 0 | 6 | 0 |
| C | 0 | 6 | 0 |
| D | 0 | 6 | 0 |
| Quadrant | Total seconds | Saturated seconds | Saturation percentage |
|---|---|---|---|
| A | 8061 | 137 | 1.699541% |
| B | 8062 | 247 | 3.063756% |
| C | 8062 | 447 | 5.544530% |
| D | 8062 | 379 | 4.701067% |
Noise dominated data is calculated using 1-second bins in cleaned event files. If a bin has >2000 counts, and if more than 50% of those come from <1% of pixels, then it is considered to be noise-dominated and hence unusable.
| Quadrant | # 1 sec bins | Bins with >0 counts | Bins with >2000 counts | High rate bins dominated by noise | Noise dominated (total time) | Noise dominated (detector-on time) | Marked lightcurve |
|---|---|---|---|---|---|---|---|
| A | 8566 | 8062 | 1 | 1 | 0.01% | 0.01% | 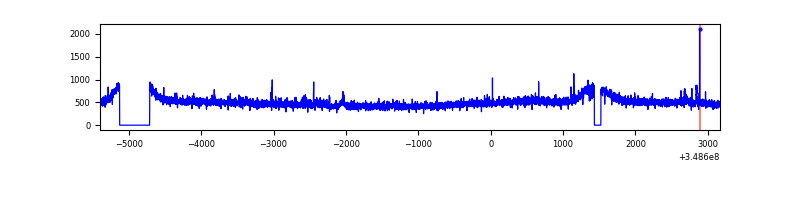 |
| B | 8567 | 8062 | 11 | 11 | 0.13% | 0.14% | 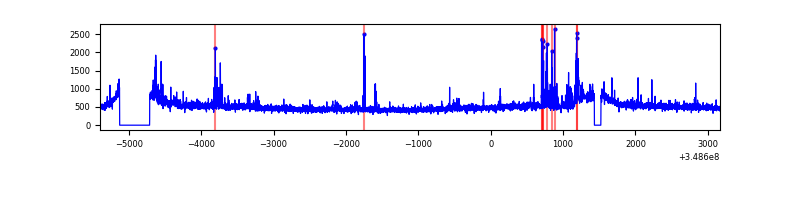 |
| C | 8567 | 8063 | 25 | 25 | 0.29% | 0.31% | 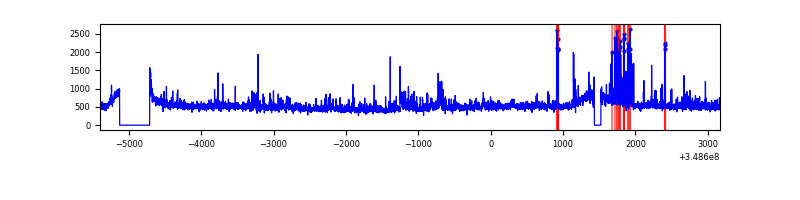 |
| D | 8567 | 8062 | 135 | 135 | 1.58% | 1.67% | 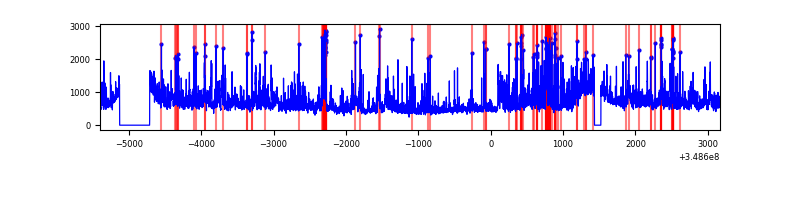 |
Top three noisy pixels from each quadrant. If the there are fewer than three noisy pixels in the level2.evt file, extra rows are filled as -1
| Pixel properties | Quadrant properties | ||||||
|---|---|---|---|---|---|---|---|
| Quadrant | DetID | PixID | Counts | Sigma | Mean | Median | Sigma |
| A | 15 | 174 | 37832 | 177.17 | 1029 | 1004 | 207.9 |
| A | 1 | 113 | 26193 | 121.18 | 1029 | 1004 | 207.9 |
| A | 13 | 254 | 15187 | 68.23 | 1029 | 1004 | 207.9 |
| B | 10 | 245 | 249436 | 1257.41 | 1016 | 990 | 197.6 |
| B | 12 | 111 | 24547 | 119.22 | 1016 | 990 | 197.6 |
| B | 11 | 111 | 22214 | 107.42 | 1016 | 990 | 197.6 |
| C | 2 | 16 | 304713 | 1325.59 | 974 | 982 | 229.1 |
| C | 14 | 238 | 212923 | 924.99 | 974 | 982 | 229.1 |
| C | 3 | 233 | 108920 | 471.08 | 974 | 982 | 229.1 |
| D | 1 | 52 | 1457807 | 6018.43 | 993 | 962 | 242.1 |
| D | 8 | 195 | 534477 | 2204.02 | 993 | 962 | 242.1 |
| D | 2 | 250 | 116936 | 479.1 | 993 | 962 | 242.1 |
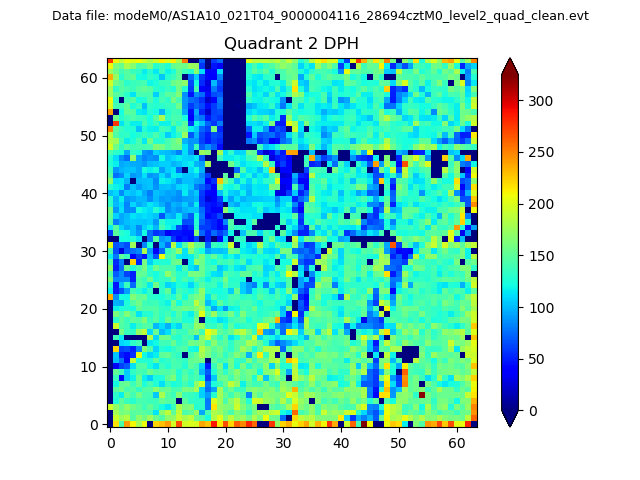
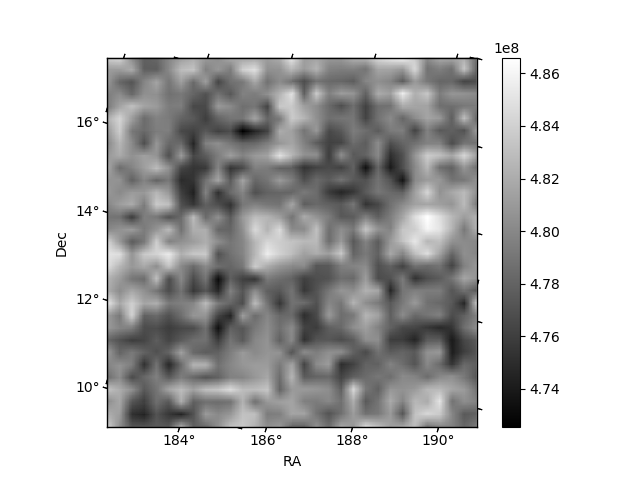
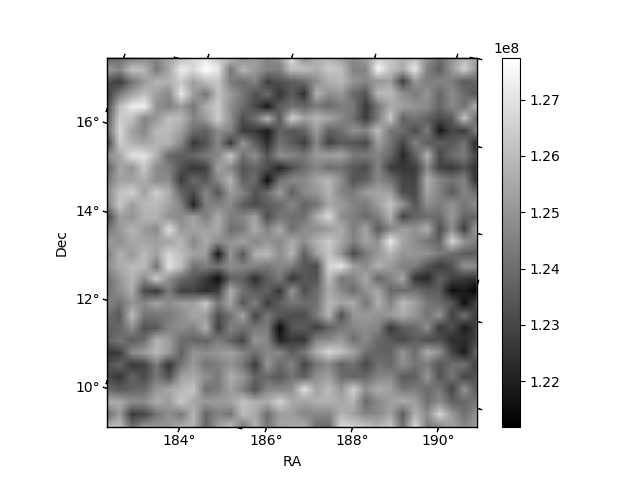
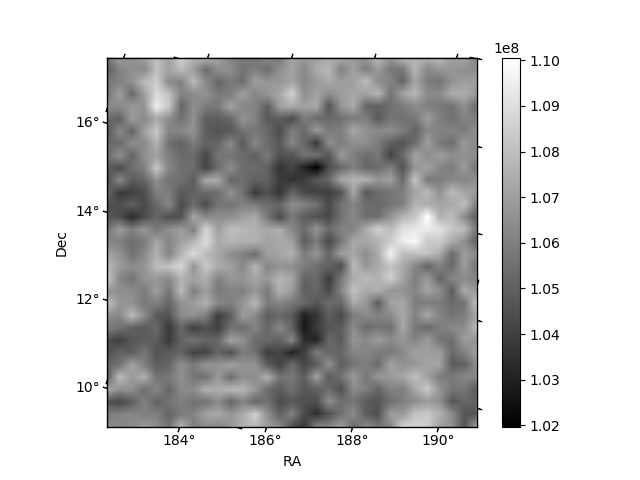
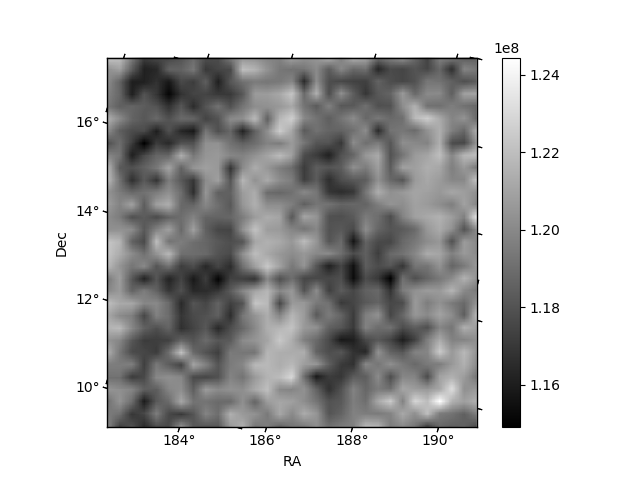
Histogram calculated using DETX and DETY for each event in the final _common_clean file
| Quadrant A | 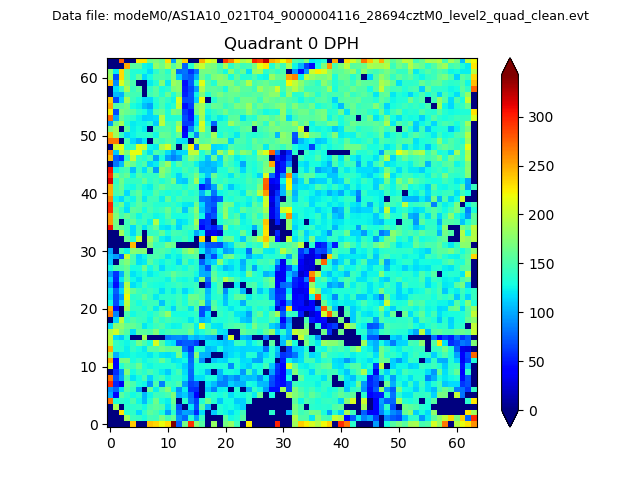 |
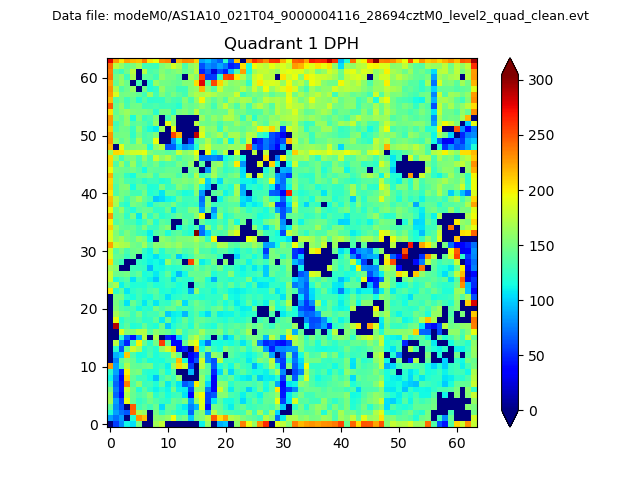 |
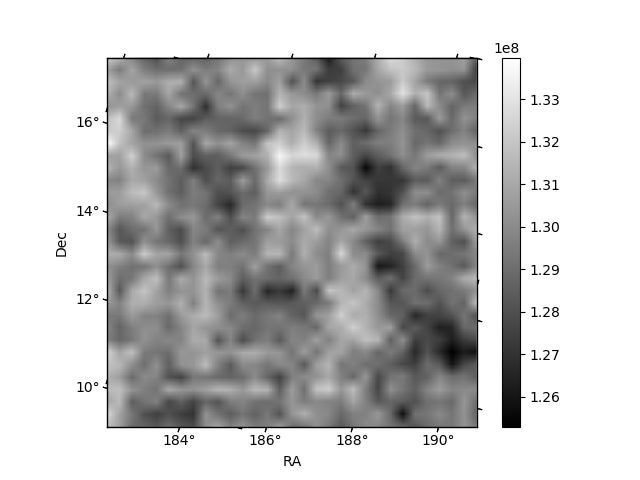
Quadrant B |
|---|---|---|---|
| Quadrant D | 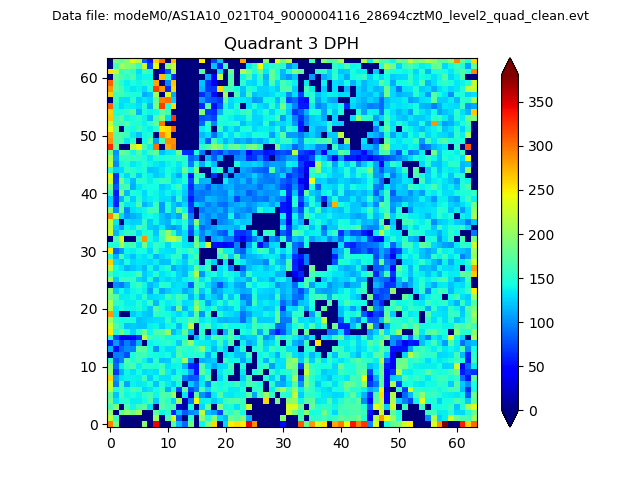 |
 |
Quadrant C |
| Plot type | Count rate plots | Images |
|---|---|---|
| Comparison with Poisson distribution Blue bars denote a histogram of data divided into 1 sec bins. Red curve is a Poisson curve with rate = median count rate of data. |
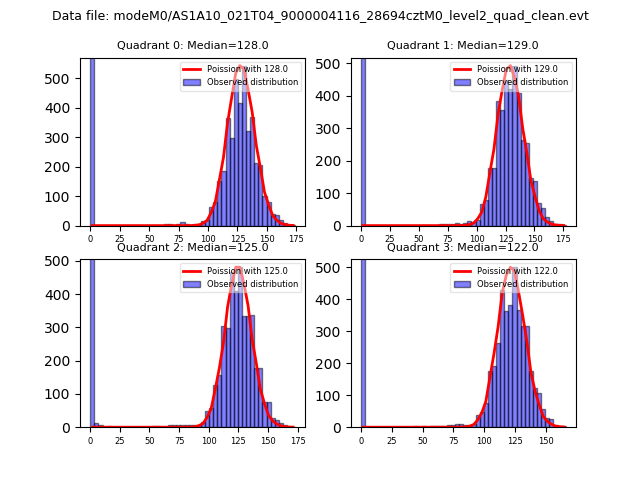 |
 |
| Quadrant-wise count rates Data is divided into 100 sec bins |
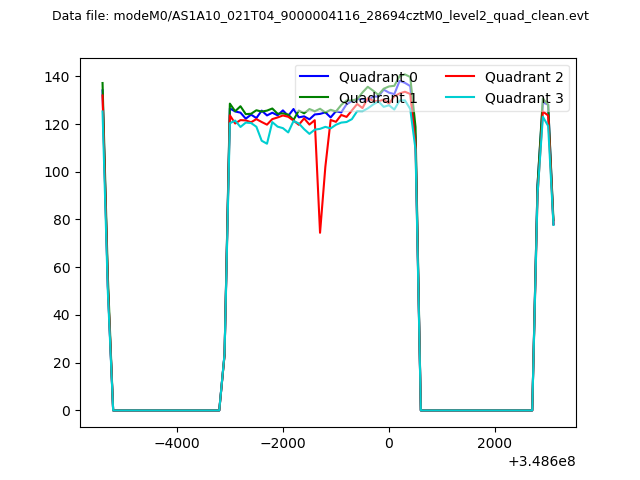 |
|
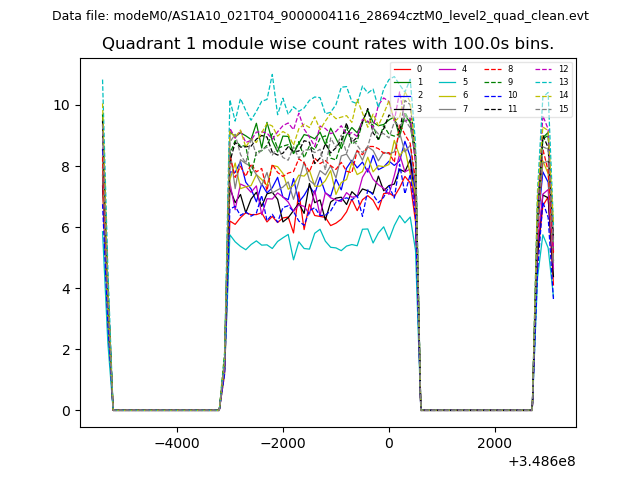
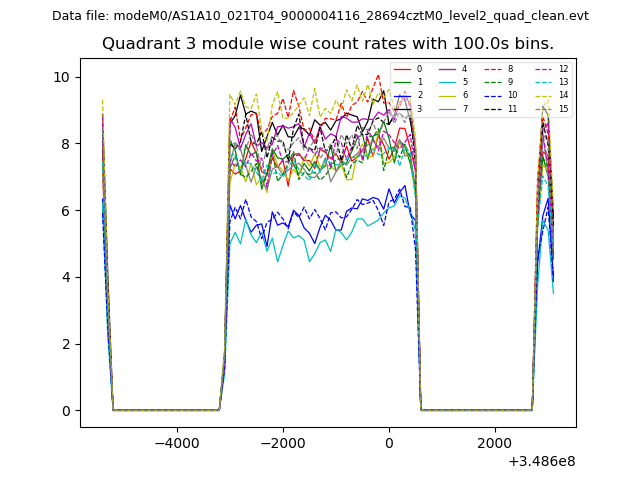
| Module-wise count rates for Quadrant A Data is divided into 100 sec bins |
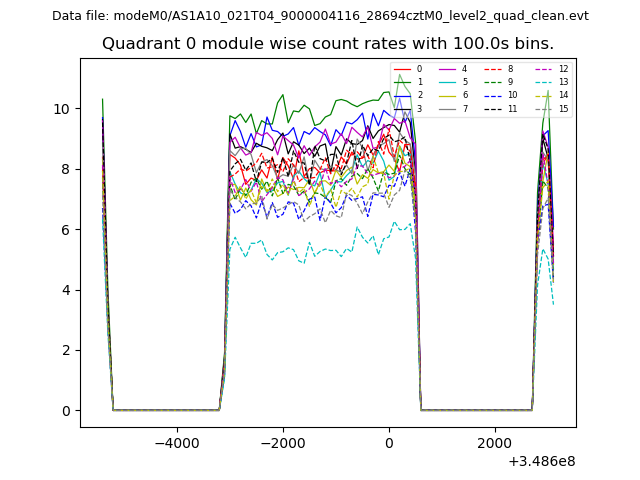 |
 |
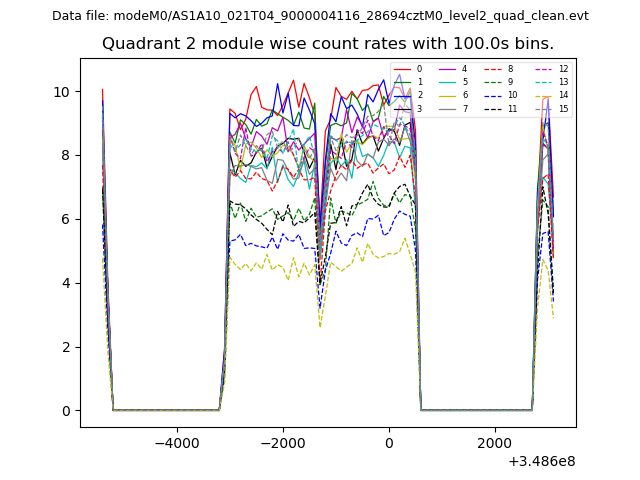
| Module-wise count rates for Quadrant B Data is divided into 100 sec bins |
 |
 |
| Module-wise count rates for Quadrant C Data is divided into 100 sec bins |
 |
 |
| Module-wise count rates for Quadrant D Data is divided into 100 sec bins |
 |
 |
| Parameter | Plot |
|---|---|
| CZT HV Monitor | 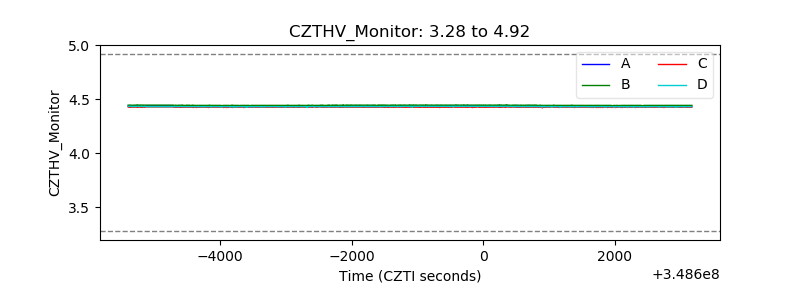 |
| D_VDD |  |
| Temperature 1 | 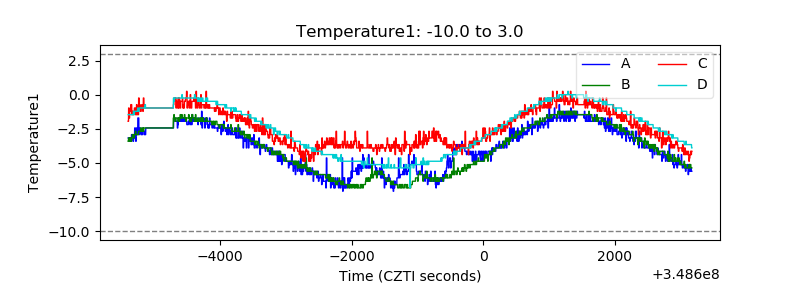 |
| Veto HV Monitor |  |
| Veto LLD | 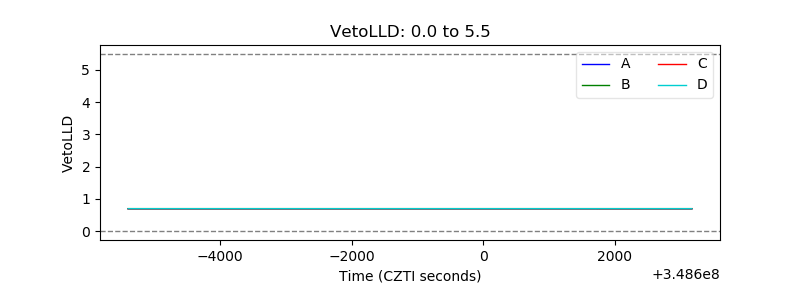 |
| Alpha Counter | 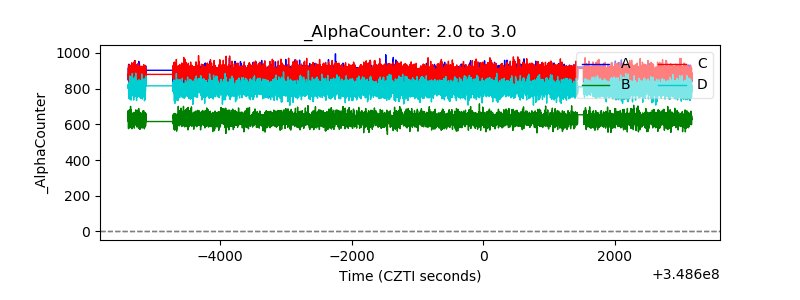 |
| _CPM_Rate | 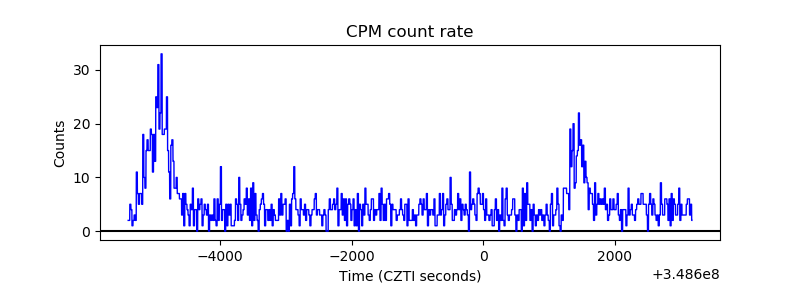 |
| CZT Counter | 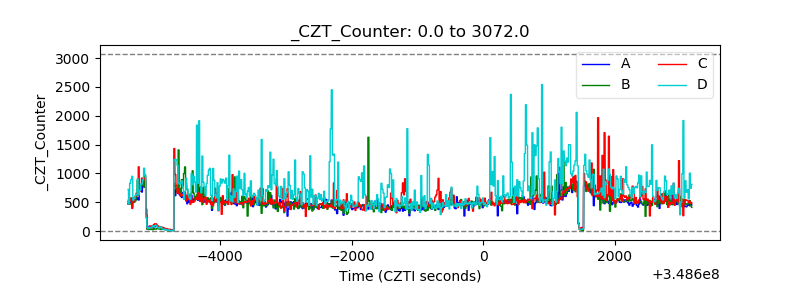 |
| +2.5 Volts monitor | 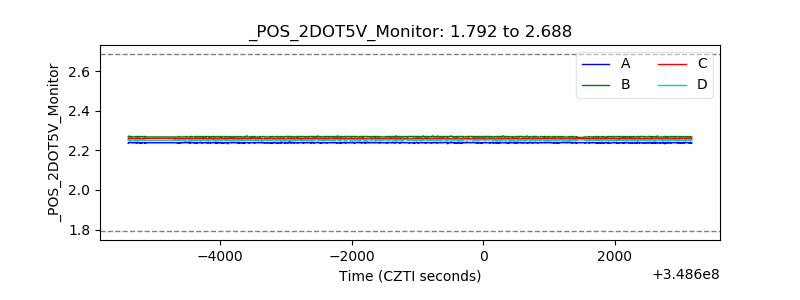 |
| +5 Volts monitor |  |
| _ROLL_ROT | 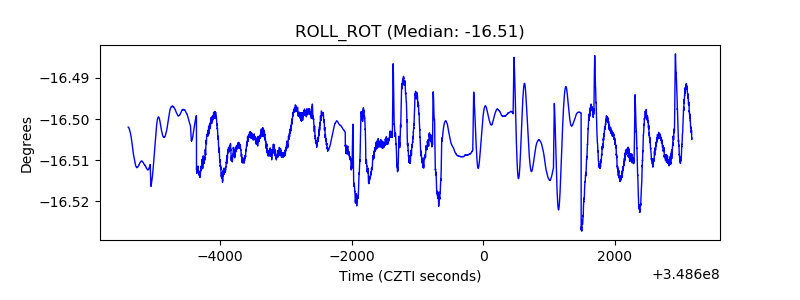 |
| _Roll_DEC | 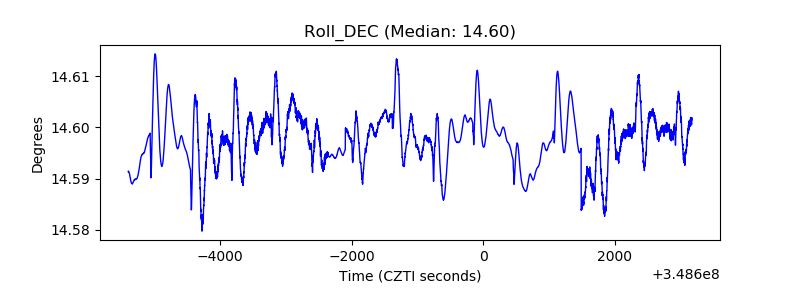 |
| _Roll_RA | 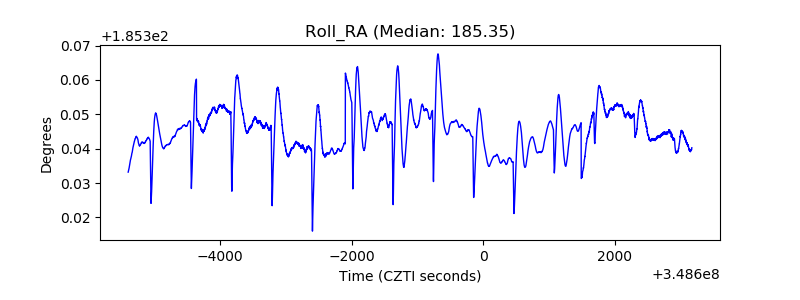 |
| Veto Counter | 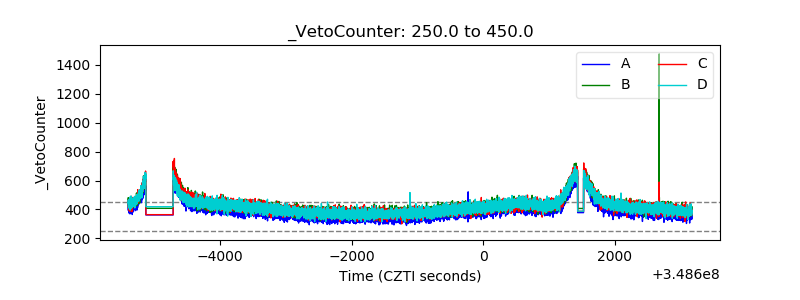 |