| Param | Original file | Final file |
|---|---|---|
| Filename | modeM0/AS1A10_021T04_9000004116_28695cztM0_level2.evt | modeM0/AS1A10_021T04_9000004116_28695cztM0_level2_quad_clean.evt |
| Size (bytes) | 543,179,520 | 88,600,320 |
| Size | 518.0 MB | 84.5 MB |
| Events in quadrant A | 3,491,469 | 551,878 |
| Events in quadrant B | 4,483,273 | 554,614 |
| Events in quadrant C | 3,620,700 | 541,605 |
| Events in quadrant D | 4,365,087 | 532,609 |
| Mode M0 | |||
|---|---|---|---|
| Quadrant | BADHDUFLAG | Total packets | Discarded packets |
| A | 0 | 15006 | 1 |
| B | 0 | 17904 | 1 |
| C | 0 | 15310 | 1 |
| D | 0 | 17915 | 1 |
| Mode SS | |||
|---|---|---|---|
| Quadrant | BADHDUFLAG | Total packets | Discarded packets |
| A | 0 | 148 | 0 |
| B | 0 | 148 | 0 |
| C | 0 | 148 | 0 |
| D | 0 | 148 | 0 |
| Mode M9 | |||
|---|---|---|---|
| Quadrant | BADHDUFLAG | Total packets | Discarded packets |
| A | 0 | 3 | 0 |
| B | 0 | 3 | 0 |
| C | 0 | 3 | 0 |
| D | 0 | 3 | 0 |
| Quadrant | Total seconds | Saturated seconds | Saturation percentage |
|---|---|---|---|
| A | 7209 | 60 | 0.832293% |
| B | 7210 | 361 | 5.006935% |
| C | 7210 | 186 | 2.579750% |
| D | 7210 | 115 | 1.595007% |
Noise dominated data is calculated using 1-second bins in cleaned event files. If a bin has >2000 counts, and if more than 50% of those come from <1% of pixels, then it is considered to be noise-dominated and hence unusable.
| Quadrant | # 1 sec bins | Bins with >0 counts | Bins with >2000 counts | High rate bins dominated by noise | Noise dominated (total time) | Noise dominated (detector-on time) | Marked lightcurve |
|---|---|---|---|---|---|---|---|
| A | 7519 | 7209 | 2 | 2 | 0.03% | 0.03% | 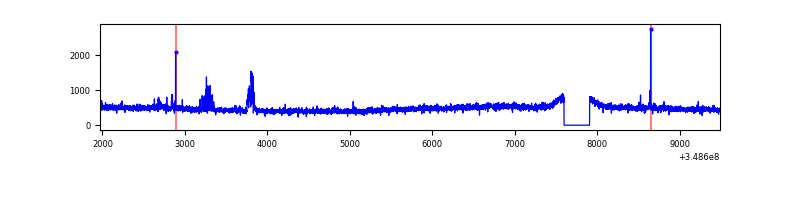 |
| B | 7520 | 7210 | 122 | 122 | 1.62% | 1.69% | 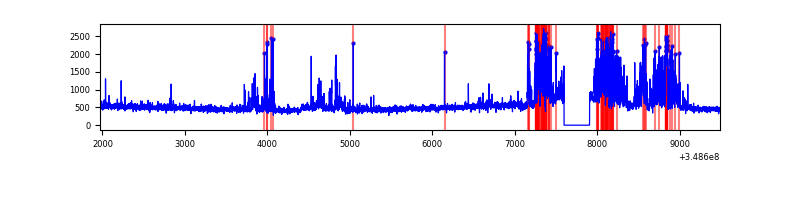 |
| C | 7520 | 7210 | 5 | 5 | 0.07% | 0.07% | 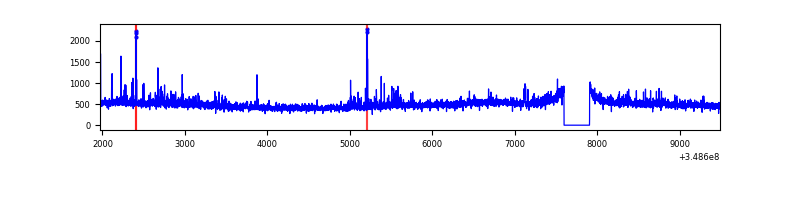 |
| D | 7520 | 7210 | 33 | 33 | 0.44% | 0.46% | 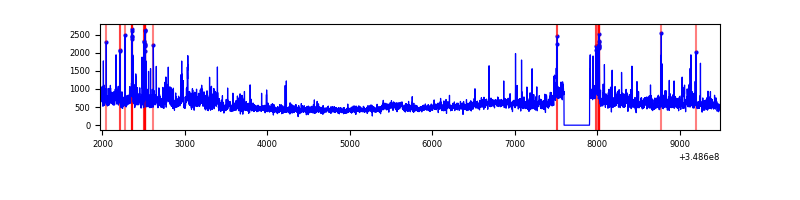 |
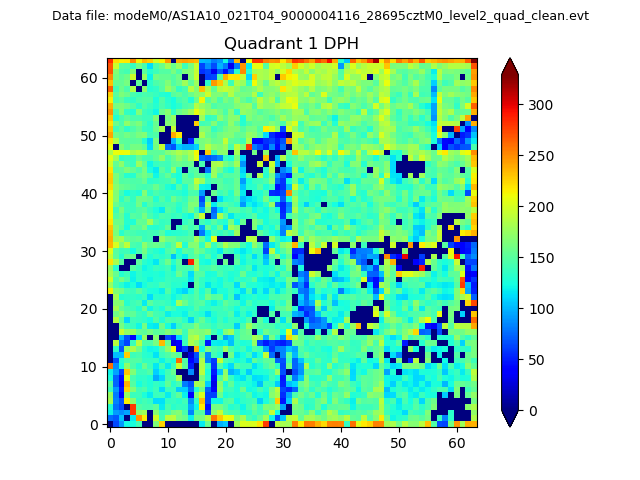
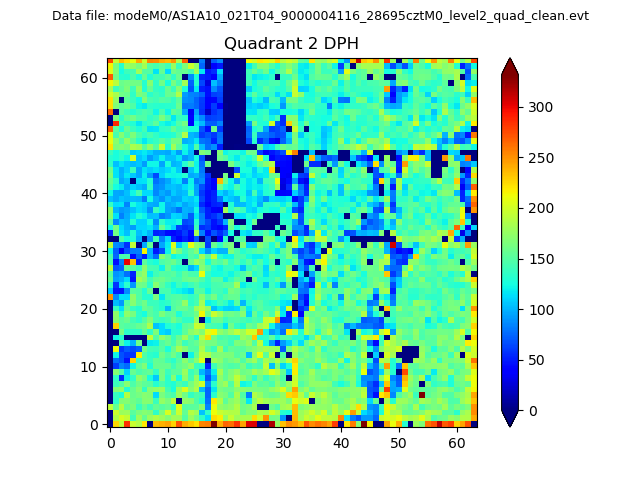
Top three noisy pixels from each quadrant. If the there are fewer than three noisy pixels in the level2.evt file, extra rows are filled as -1
| Pixel properties | Quadrant properties | ||||||
|---|---|---|---|---|---|---|---|
| Quadrant | DetID | PixID | Counts | Sigma | Mean | Median | Sigma |
| A | 15 | 174 | 92709 | 516.33 | 879 | 860 | 177.9 |
| A | 13 | 254 | 13850 | 73.02 | 879 | 860 | 177.9 |
| A | 3 | 137 | 8662 | 43.86 | 879 | 860 | 177.9 |
| B | 10 | 245 | 1061137 | 6402.71 | 862 | 839 | 165.6 |
| B | 12 | 111 | 20555 | 119.06 | 862 | 839 | 165.6 |
| B | 11 | 111 | 18856 | 108.8 | 862 | 839 | 165.6 |
| C | 14 | 238 | 169103 | 846.64 | 844 | 848 | 198.7 |
| C | 2 | 16 | 84768 | 422.28 | 844 | 848 | 198.7 |
| C | 14 | 254 | 48876 | 241.67 | 844 | 848 | 198.7 |
| D | 8 | 195 | 596972 | 2877.45 | 853 | 830 | 207.2 |
| D | 1 | 52 | 340690 | 1640.43 | 853 | 830 | 207.2 |
| D | 2 | 250 | 104116 | 498.54 | 853 | 830 | 207.2 |
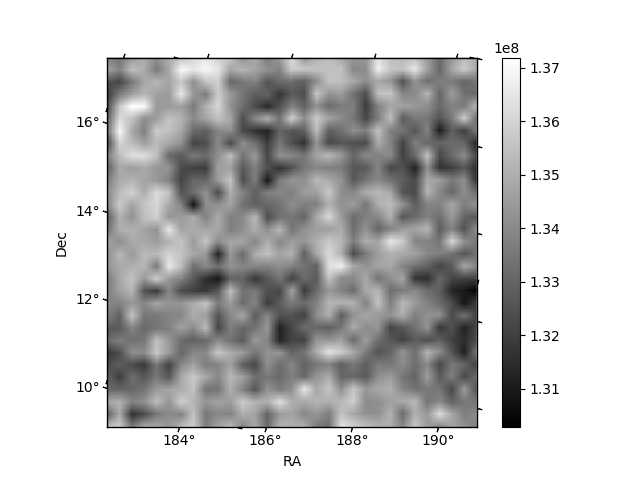
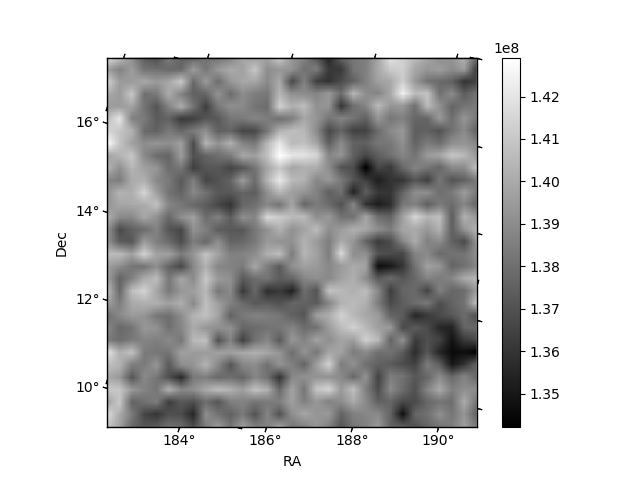
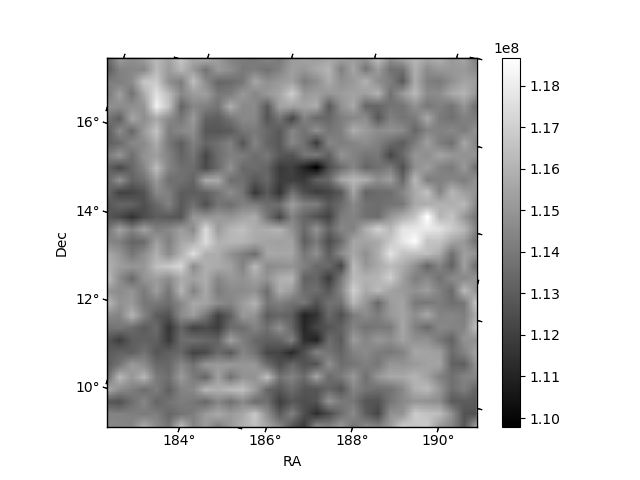
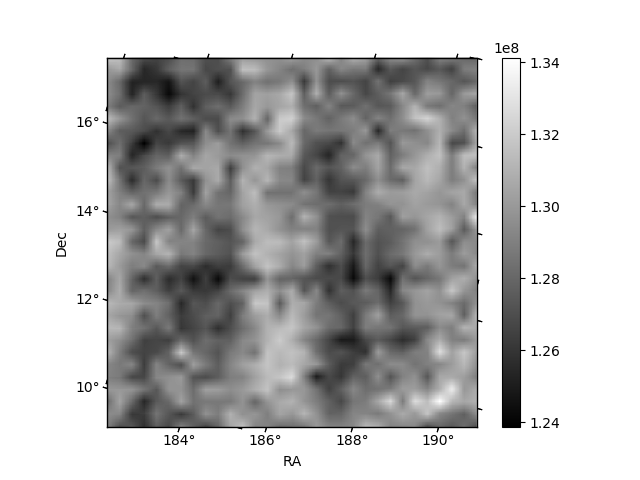
Histogram calculated using DETX and DETY for each event in the final _common_clean file
| Quadrant A | 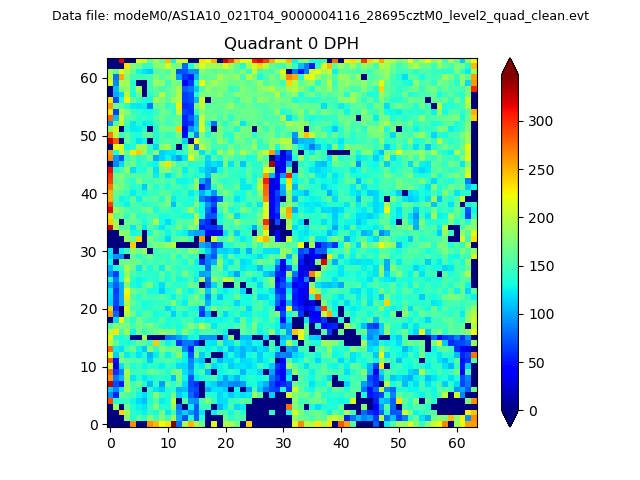 |
 |
Quadrant B |
|---|---|---|---|
| Quadrant D | 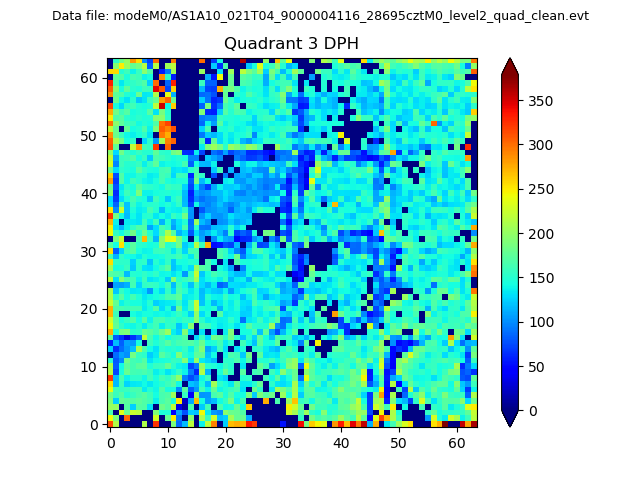 |
 |
Quadrant C |
| Plot type | Count rate plots | Images |
|---|---|---|
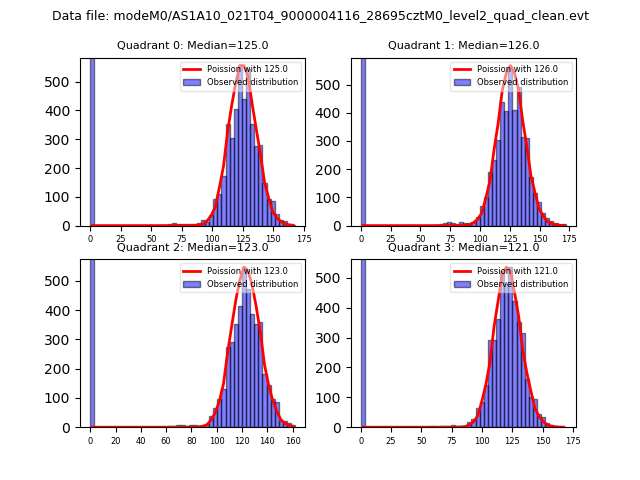
| Comparison with Poisson distribution Blue bars denote a histogram of data divided into 1 sec bins. Red curve is a Poisson curve with rate = median count rate of data. |
 |
 |
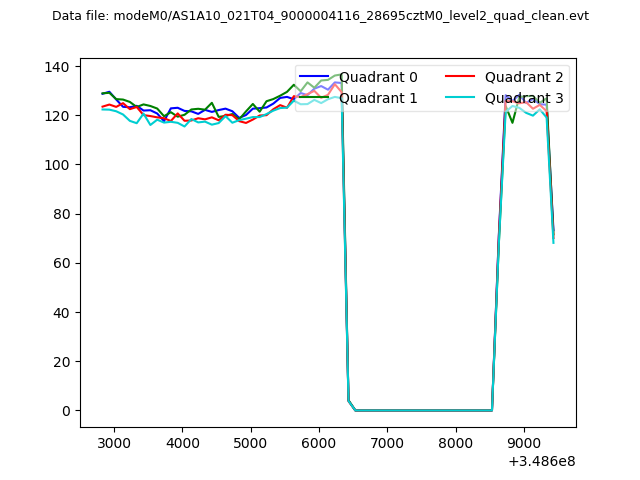
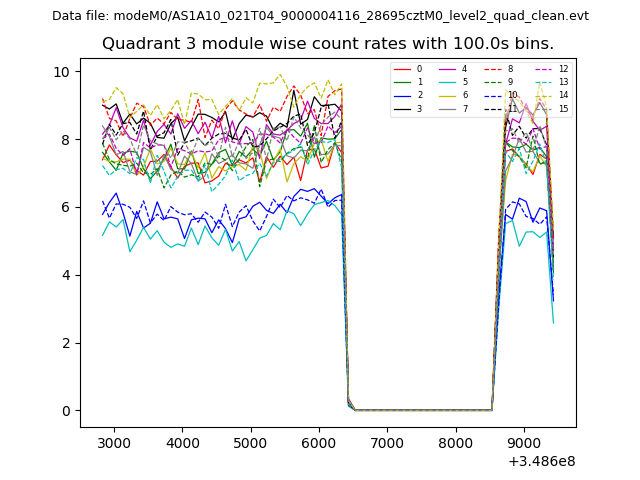
| Quadrant-wise count rates Data is divided into 100 sec bins |
 |
|
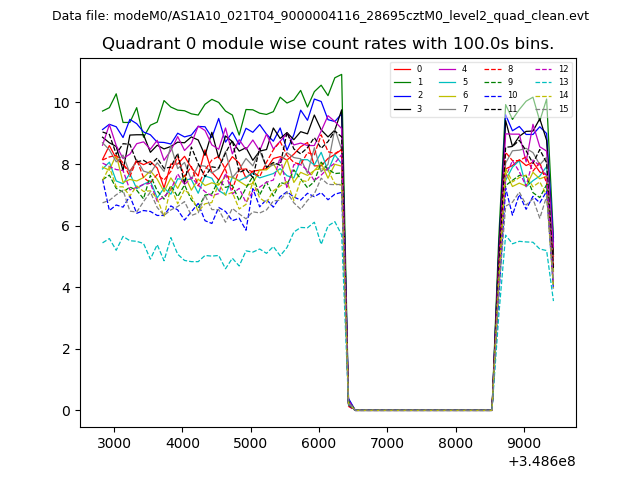
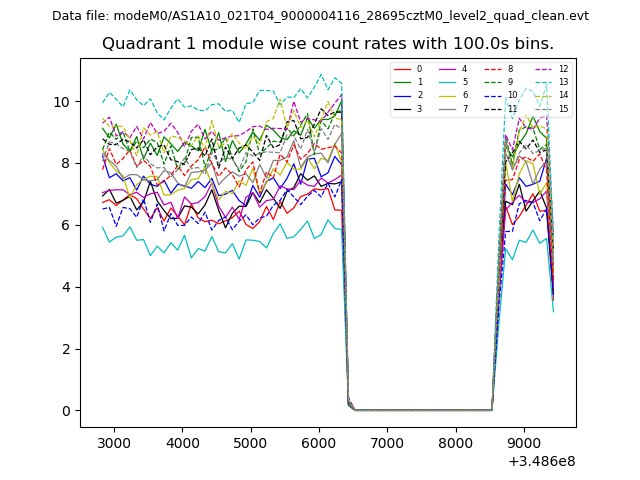
| Module-wise count rates for Quadrant A Data is divided into 100 sec bins |
 |
 |
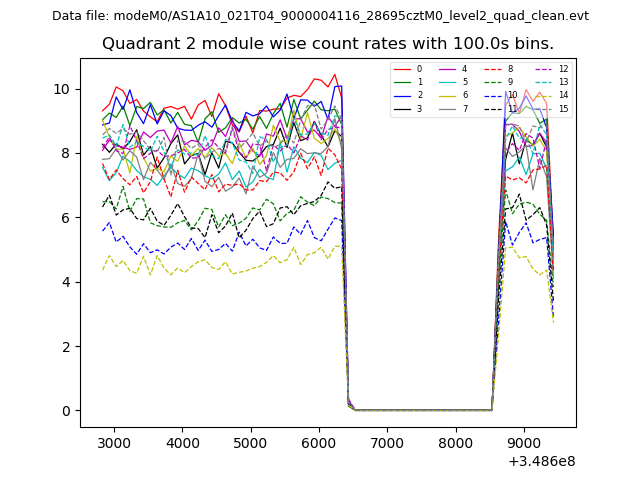
| Module-wise count rates for Quadrant B Data is divided into 100 sec bins |
 |
 |
| Module-wise count rates for Quadrant C Data is divided into 100 sec bins |
 |
 |
| Module-wise count rates for Quadrant D Data is divided into 100 sec bins |
 |
 |
| Parameter | Plot |
|---|---|
| CZT HV Monitor | 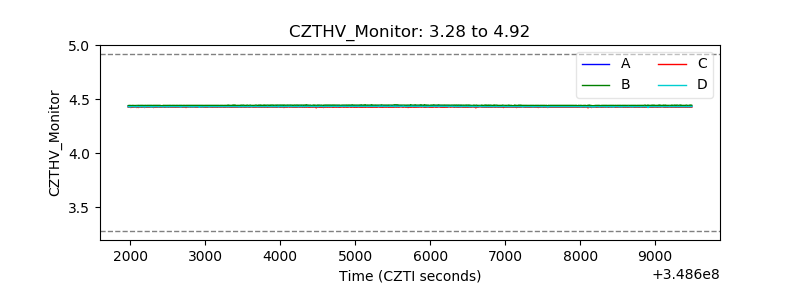 |
| D_VDD | 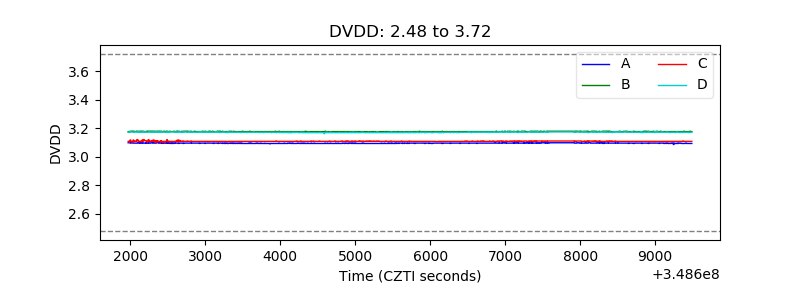 |
| Temperature 1 | 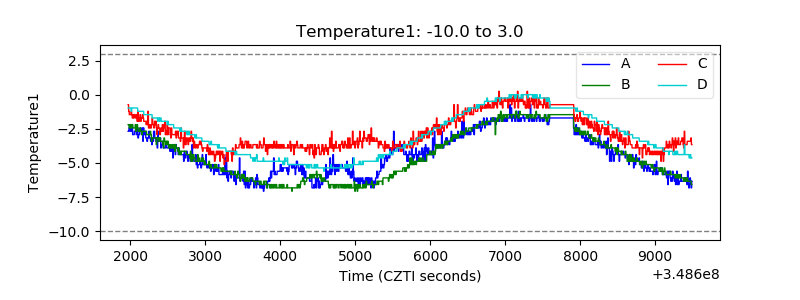 |
| Veto HV Monitor | 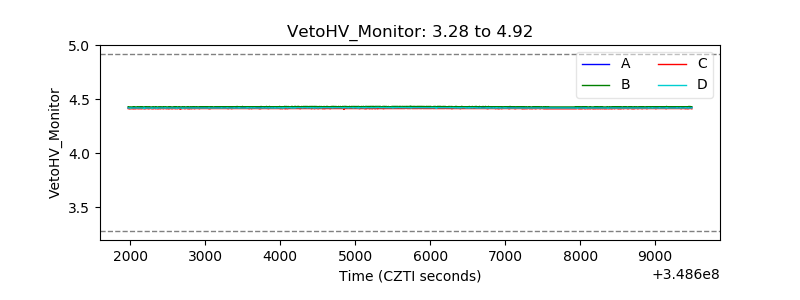 |
| Veto LLD | 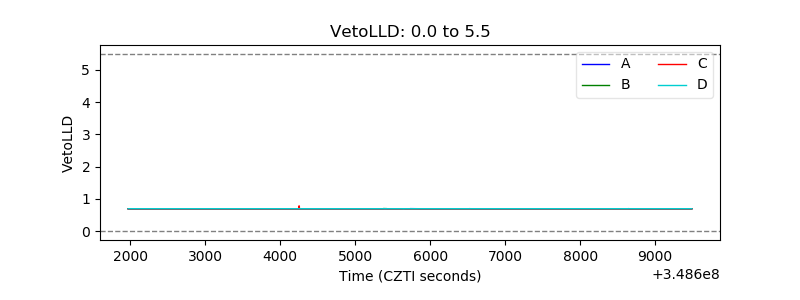 |
| Alpha Counter | 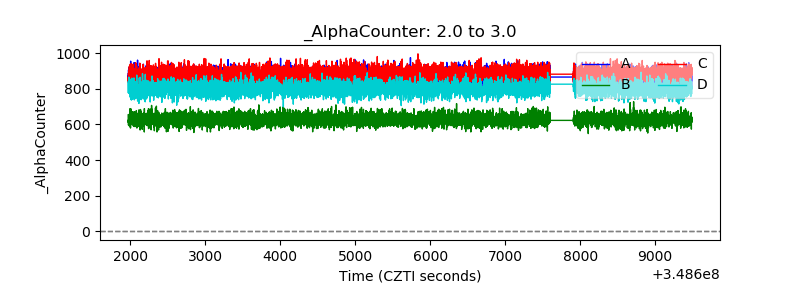 |
| _CPM_Rate | 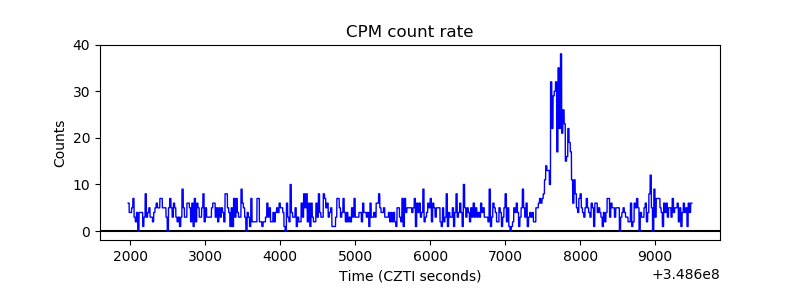 |
| CZT Counter | 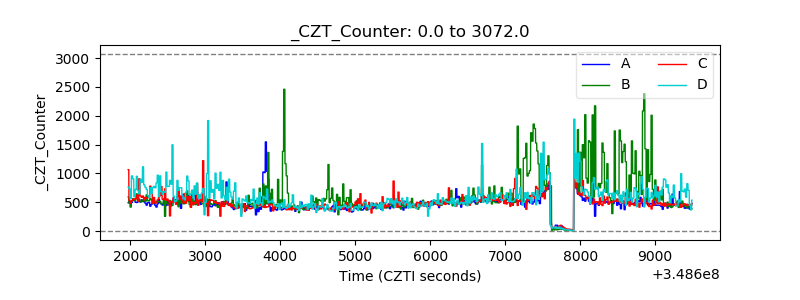 |
| +2.5 Volts monitor |  |
| +5 Volts monitor |  |
| _ROLL_ROT | 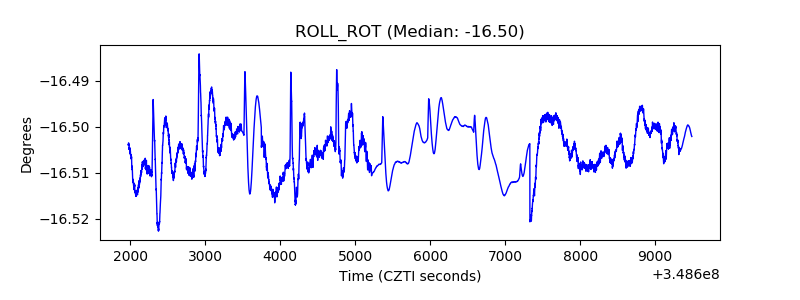 |
| _Roll_DEC | 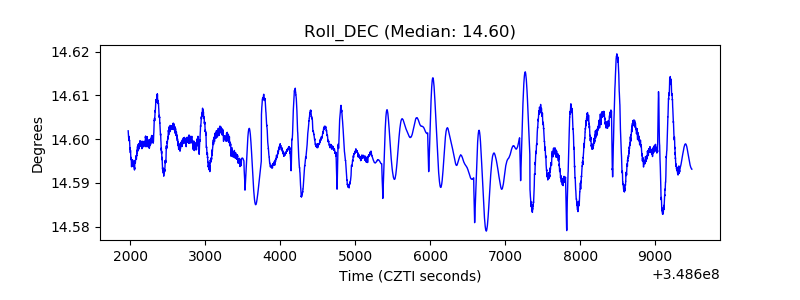 |
| _Roll_RA |  |
| Veto Counter | 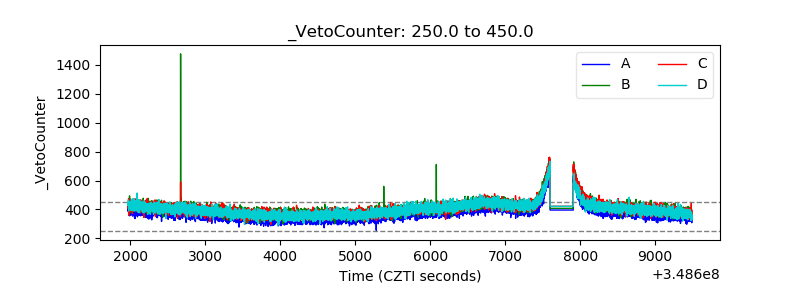 |