| Param | Original file | Final file |
|---|---|---|
| Filename | modeM0/AS1A10_021T04_9000004116_28698cztM0_level2.evt | modeM0/AS1A10_021T04_9000004116_28698cztM0_level2_quad_clean.evt |
| Size (bytes) | 1,002,263,040 | 161,858,880 |
| Size | 955.8 MB | 154.4 MB |
| Events in quadrant A | 5,914,923 | 1,025,599 |
| Events in quadrant B | 6,826,359 | 1,040,711 |
| Events in quadrant C | 6,064,109 | 1,004,960 |
| Events in quadrant D | 10,703,334 | 967,030 |
| Mode M0 | |||
|---|---|---|---|
| Quadrant | BADHDUFLAG | Total packets | Discarded packets |
| A | 0 | 25871 | 3 |
| B | 0 | 28592 | 3 |
| C | 0 | 26004 | 3 |
| D | 0 | 40606 | 3 |
| Mode SS | |||
|---|---|---|---|
| Quadrant | BADHDUFLAG | Total packets | Discarded packets |
| A | 0 | 258 | 0 |
| B | 0 | 258 | 0 |
| C | 0 | 258 | 0 |
| D | 0 | 258 | 0 |
| Mode M9 | |||
|---|---|---|---|
| Quadrant | BADHDUFLAG | Total packets | Discarded packets |
| A | 0 | 15 | 0 |
| B | 0 | 15 | 0 |
| C | 0 | 15 | 0 |
| D | 0 | 15 | 0 |
| Quadrant | Total seconds | Saturated seconds | Saturation percentage |
|---|---|---|---|
| A | 12490 | 80 | 0.640512% |
| B | 12491 | 330 | 2.641902% |
| C | 12490 | 206 | 1.649319% |
| D | 12490 | 1309 | 10.480384% |
Noise dominated data is calculated using 1-second bins in cleaned event files. If a bin has >2000 counts, and if more than 50% of those come from <1% of pixels, then it is considered to be noise-dominated and hence unusable.
| Quadrant | # 1 sec bins | Bins with >0 counts | Bins with >2000 counts | High rate bins dominated by noise | Noise dominated (total time) | Noise dominated (detector-on time) | Marked lightcurve |
|---|---|---|---|---|---|---|---|
| A | 14070 | 12491 | 2 | 2 | 0.01% | 0.02% | 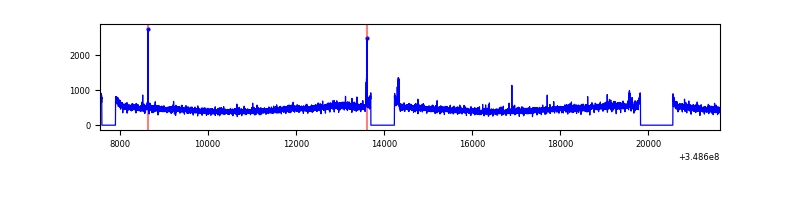 |
| B | 14071 | 12491 | 66 | 66 | 0.47% | 0.53% | 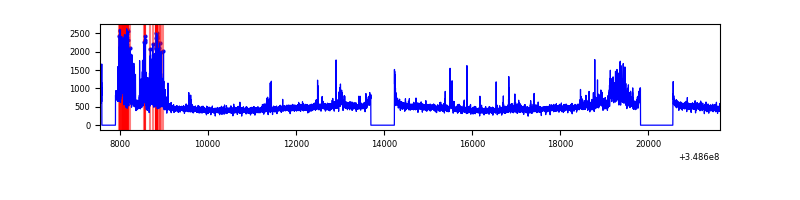 |
| C | 14070 | 12490 | 4 | 4 | 0.03% | 0.03% | 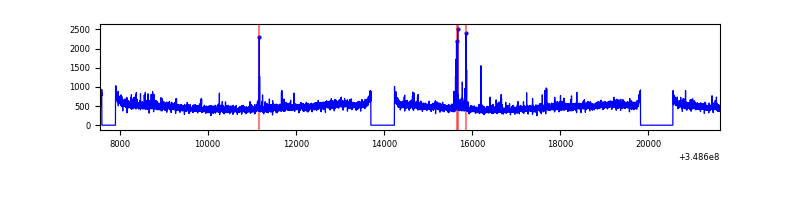 |
| D | 14070 | 12492 | 1092 | 1092 | 7.76% | 8.74% | 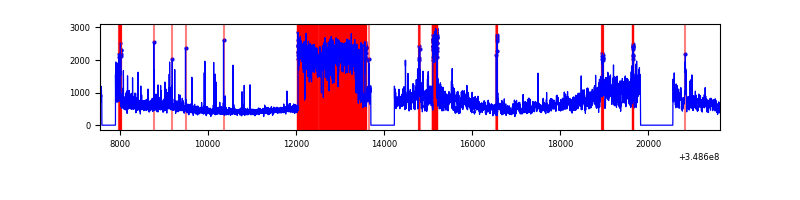 |
Top three noisy pixels from each quadrant. If the there are fewer than three noisy pixels in the level2.evt file, extra rows are filled as -1
| Pixel properties | Quadrant properties | ||||||
|---|---|---|---|---|---|---|---|
| Quadrant | DetID | PixID | Counts | Sigma | Mean | Median | Sigma |
| A | 15 | 174 | 39243 | 124.03 | 1514 | 1479 | 304.5 |
| A | 13 | 254 | 23829 | 73.4 | 1514 | 1479 | 304.5 |
| A | 6 | 16 | 20664 | 63.01 | 1514 | 1479 | 304.5 |
| B | 10 | 245 | 707581 | 2451.2 | 1495 | 1455 | 288.1 |
| B | 15 | 33 | 178910 | 616.01 | 1495 | 1455 | 288.1 |
| B | 12 | 111 | 36226 | 120.7 | 1495 | 1455 | 288.1 |
| C | 14 | 238 | 258351 | 752.54 | 1454 | 1459 | 341.4 |
| C | 2 | 16 | 70927 | 203.5 | 1454 | 1459 | 341.4 |
| C | 14 | 254 | 42179 | 119.29 | 1454 | 1459 | 341.4 |
| D | 8 | 195 | 2425174 | 7041.25 | 1427 | 1388 | 344.2 |
| D | 7 | 80 | 2278444 | 6614.99 | 1427 | 1388 | 344.2 |
| D | 1 | 52 | 368498 | 1066.48 | 1427 | 1388 | 344.2 |
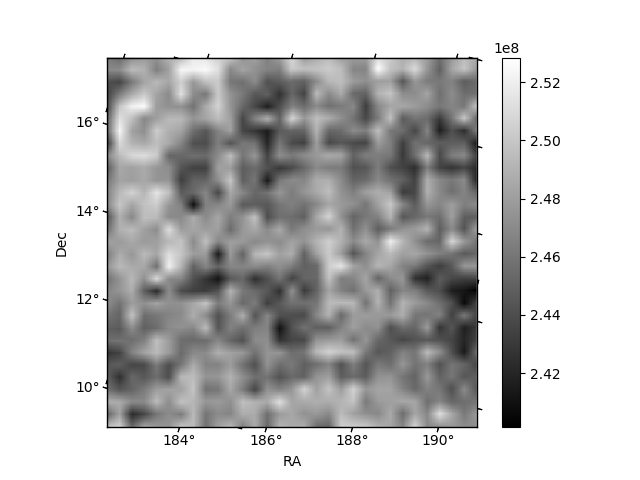
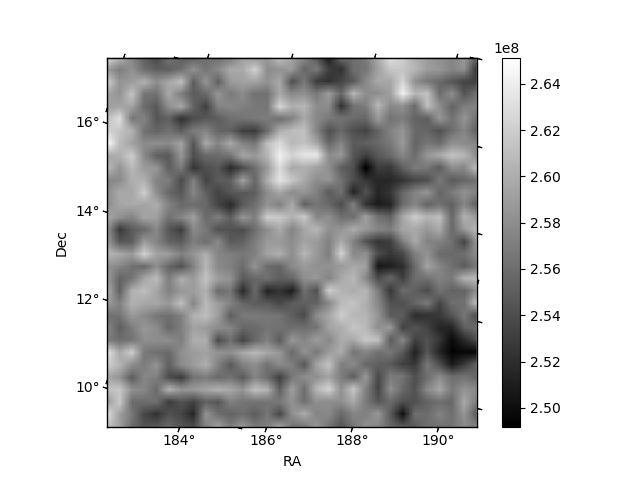
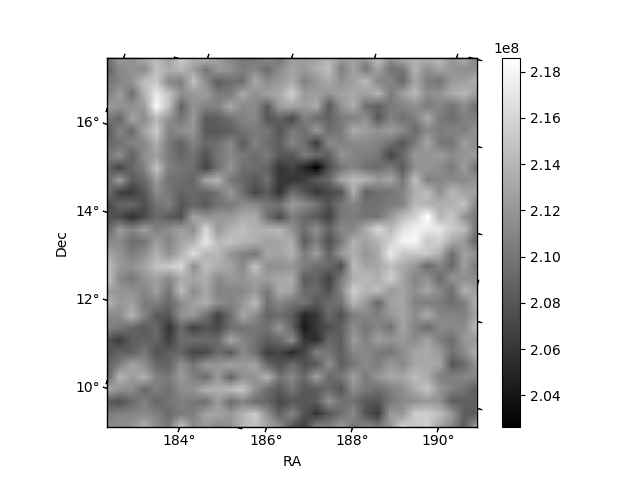
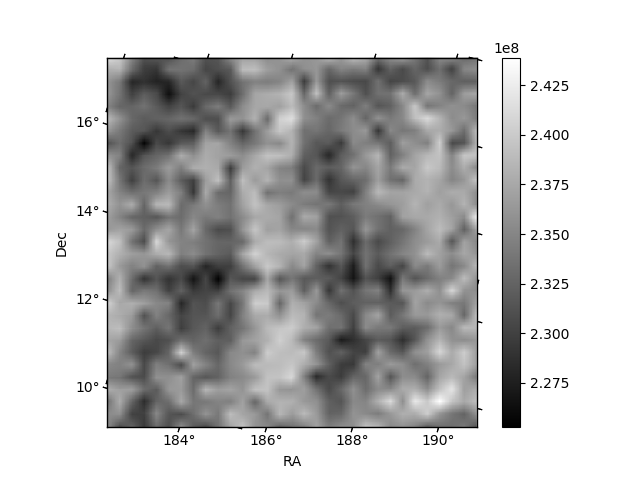
Histogram calculated using DETX and DETY for each event in the final _common_clean file
| Quadrant A | 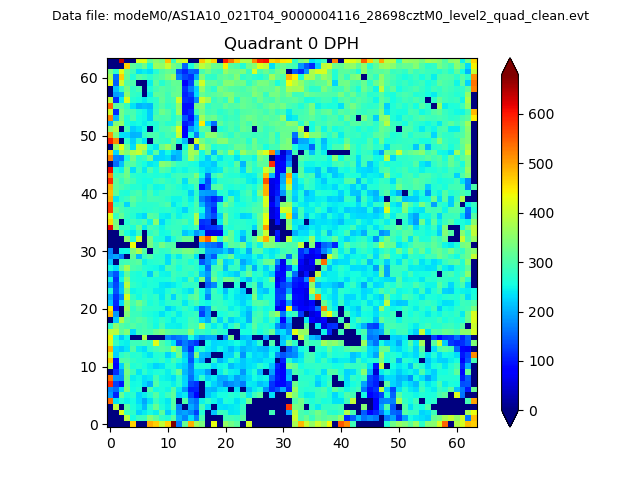 |
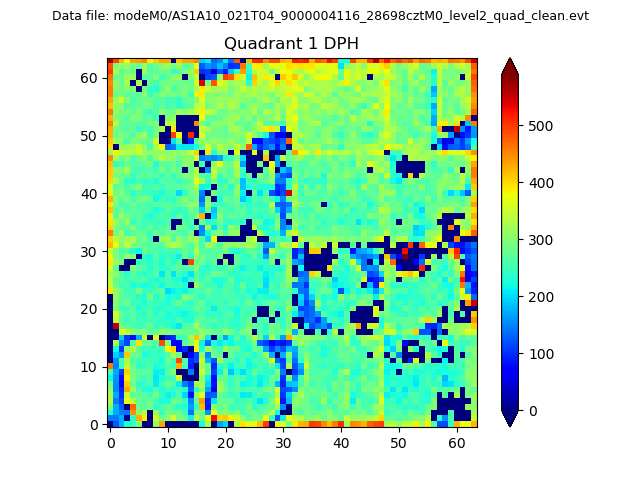 |
Quadrant B |
|---|---|---|---|
| Quadrant D | 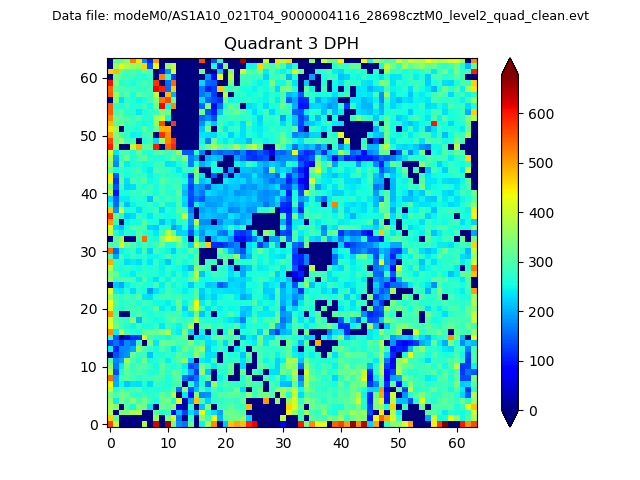 |
 |
Quadrant C |
| Plot type | Count rate plots | Images |
|---|---|---|
| Comparison with Poisson distribution Blue bars denote a histogram of data divided into 1 sec bins. Red curve is a Poisson curve with rate = median count rate of data. |
 |
 |
| Quadrant-wise count rates Data is divided into 100 sec bins |
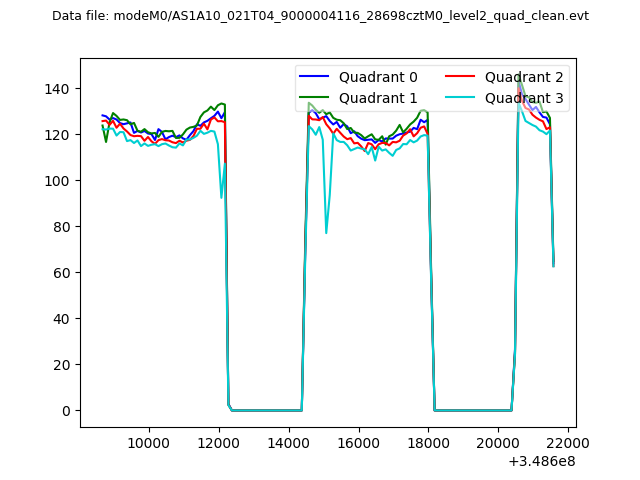 |
|
| Module-wise count rates for Quadrant A Data is divided into 100 sec bins |
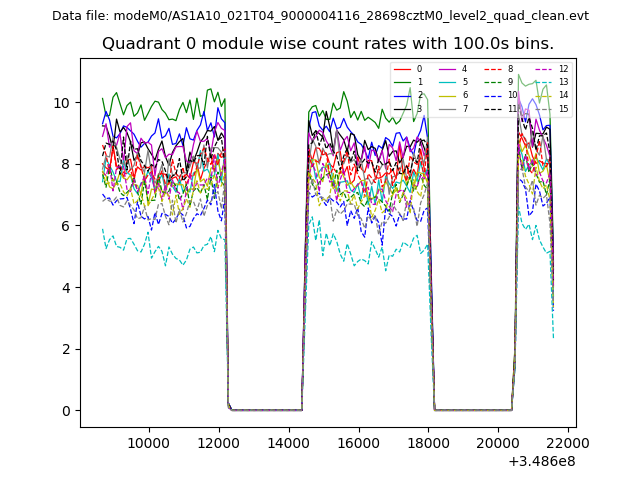 |
 |
| Module-wise count rates for Quadrant B Data is divided into 100 sec bins |
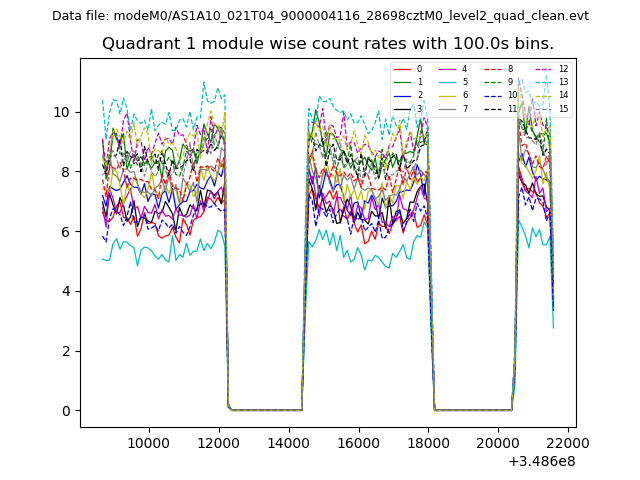 |
 |
| Module-wise count rates for Quadrant C Data is divided into 100 sec bins |
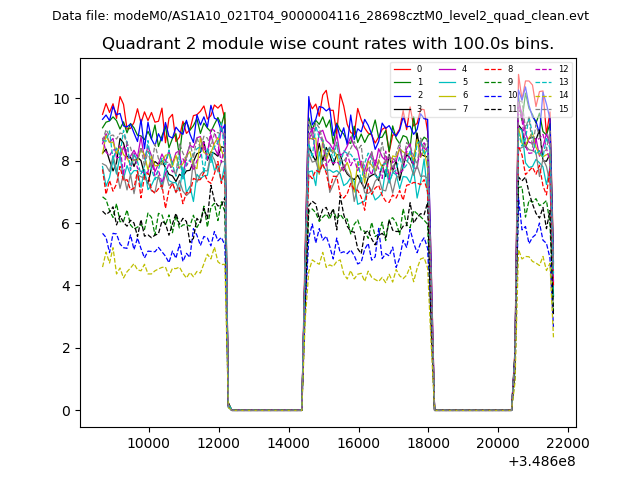 |
 |
| Module-wise count rates for Quadrant D Data is divided into 100 sec bins |
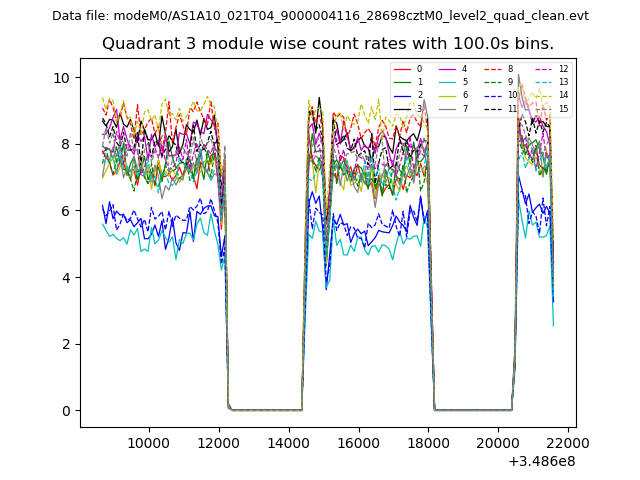 |
 |
| Parameter | Plot |
|---|---|
| CZT HV Monitor | 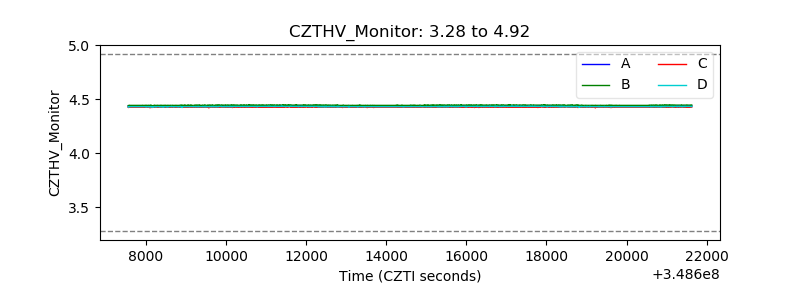 |
| D_VDD | 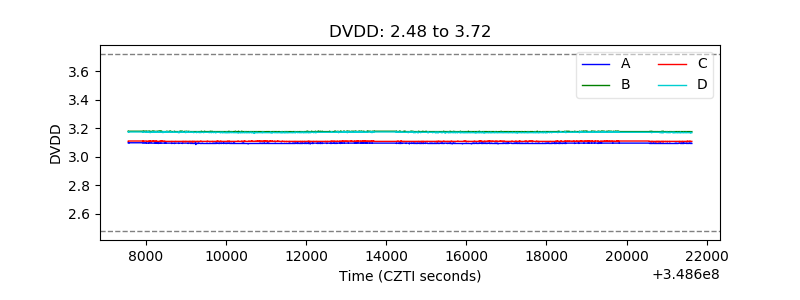 |
| Temperature 1 | 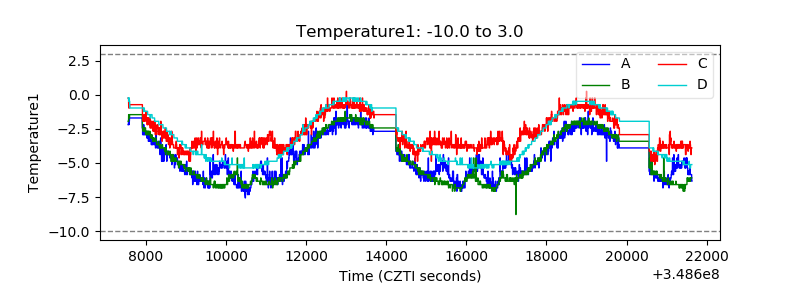 |
| Veto HV Monitor | 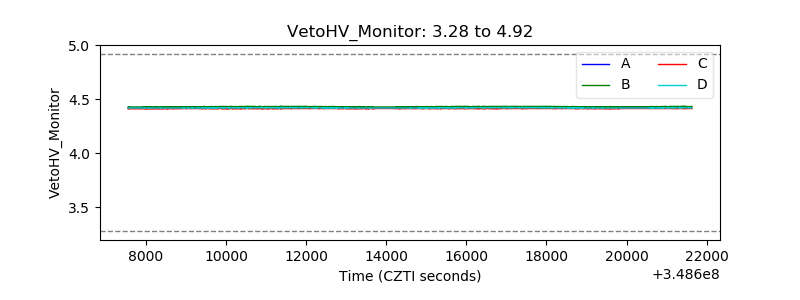 |
| Veto LLD | 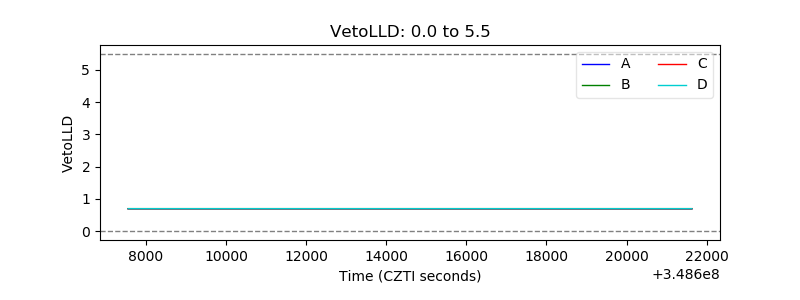 |
| Alpha Counter | 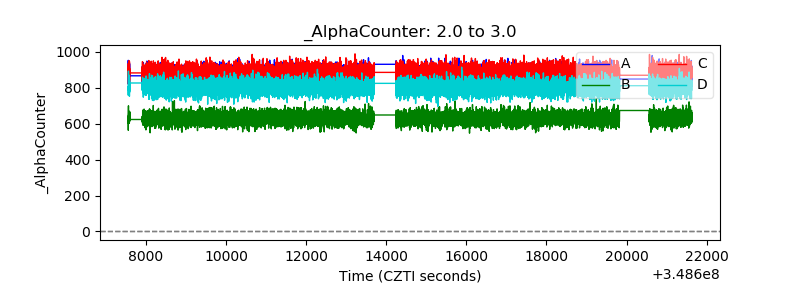 |
| _CPM_Rate | 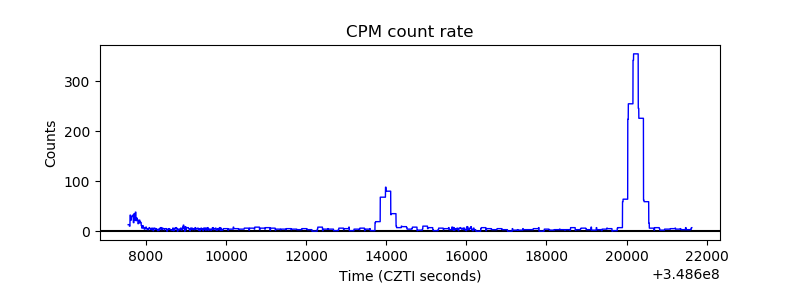 |
| CZT Counter | 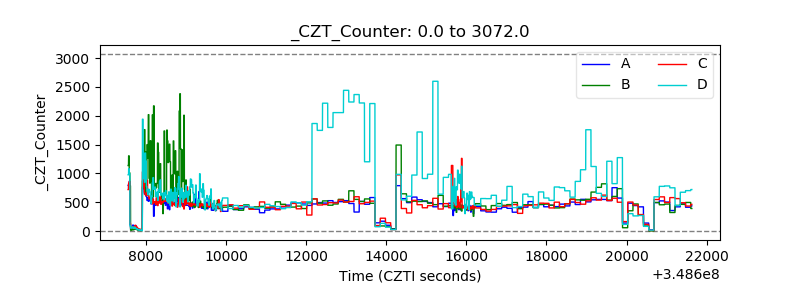 |
| +2.5 Volts monitor |  |
| +5 Volts monitor |  |
| _ROLL_ROT | 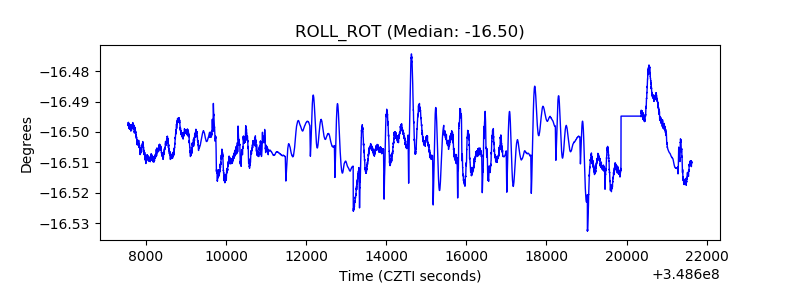 |
| _Roll_DEC | 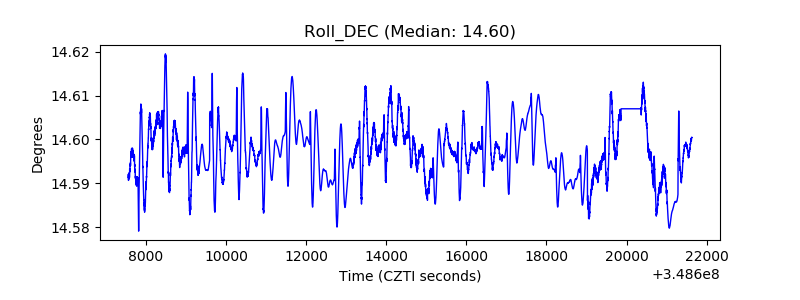 |
| _Roll_RA | 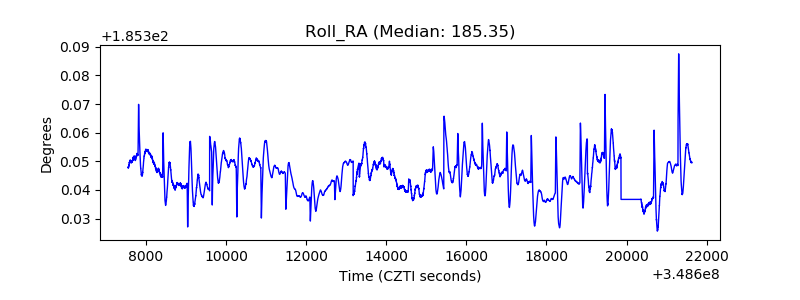 |
| Veto Counter | 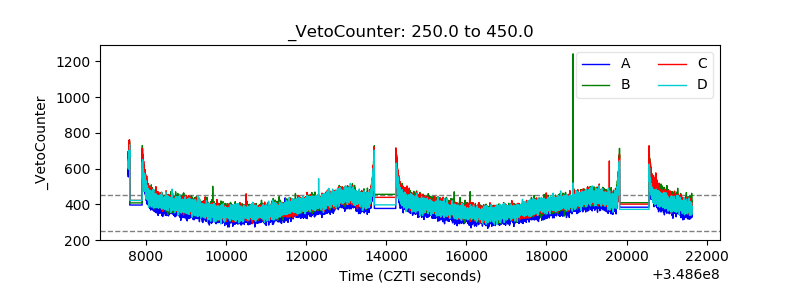 |