| Param | Original file | Final file |
|---|---|---|
| Filename | modeM0/AS1A10_021T08_9000004118cztM0_level2.fits | modeM0/AS1A10_021T08_9000004118cztM0_level2_quad_clean.evt |
| Size (bytes) | 407,710,080 | 134,213,760 |
| Size | 388.8 MB | 128.0 MB |
| Events in quadrant A | 2,598,620 | 374,829 |
| Events in quadrant B | 2,458,956 | 377,903 |
| Events in quadrant C | 2,529,272 | 360,106 |
| Events in quadrant D | 2,139,838 | 327,606 |
| Mode M9 | |||
|---|---|---|---|
| Quadrant | BADHDUFLAG | Total packets | Discarded packets |
| A | 0 | 83 | 0 |
| B | 0 | 83 | 0 |
| C | 0 | 83 | 0 |
| D | 0 | 83 | 0 |
| Mode M0 | |||
|---|---|---|---|
| Quadrant | BADHDUFLAG | Total packets | Discarded packets |
| A | 0 | 81252 | 0 |
| B | 0 | 83441 | 0 |
| C | 0 | 81899 | 0 |
| D | 0 | 118155 | 0 |
| Mode SS | |||
|---|---|---|---|
| Quadrant | BADHDUFLAG | Total packets | Discarded packets |
| A | 0 | 776 | 0 |
| B | 0 | 776 | 0 |
| C | 0 | 776 | 0 |
| D | 0 | 776 | 0 |
| Quadrant | Total seconds | Saturated seconds | Saturation percentage |
|---|---|---|---|
| A | 38159 | 522 | 1.367960% |
| B | 38159 | 692 | 1.813465% |
| C | 38159 | 893 | 2.340208% |
| D | 38159 | 3111 | 8.152729% |
Noise dominated data is calculated using 1-second bins in cleaned event files. If a bin has >2000 counts, and if more than 50% of those come from <1% of pixels, then it is considered to be noise-dominated and hence unusable.
| Quadrant | # 1 sec bins | Bins with >0 counts | Bins with >2000 counts | High rate bins dominated by noise | Noise dominated (total time) | Noise dominated (detector-on time) | Marked lightcurve |
|---|---|---|---|---|---|---|---|
| A | 46428 | 38152 | 0 | 0 | 0.00% | 0.00% |  |
| B | 46428 | 38139 | 0 | 0 | 0.00% | 0.00% |  |
| C | 46428 | 38147 | 0 | 0 | 0.00% | 0.00% |  |
| D | 46428 | 38104 | 0 | 0 | 0.00% | 0.00% | 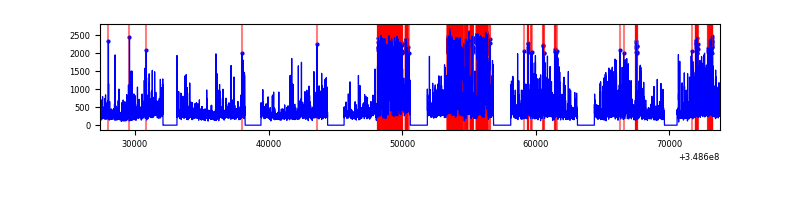 |
Top three noisy pixels from each quadrant. If the there are fewer than three noisy pixels in the level2.evt file, extra rows are filled as -1
| Pixel properties | Quadrant properties | ||||||
|---|---|---|---|---|---|---|---|
| Quadrant | DetID | PixID | Counts | Sigma | Mean | Median | Sigma |
| A | 0 | 29 | 2453 | 11.01 | 678 | 640 | 164.7 |
| A | 7 | 110 | 2010 | 8.32 | 678 | 640 | 164.7 |
| A | 9 | 19 | 1922 | 7.79 | 678 | 640 | 164.7 |
| B | 2 | 9 | 1960 | 10.54 | 650 | 623 | 126.9 |
| B | 5 | 128 | 1699 | 8.48 | 650 | 623 | 126.9 |
| B | 5 | 255 | 1618 | 7.84 | 650 | 623 | 126.9 |
| C | 1 | 80 | 1958 | 7.88 | 668 | 631 | 168.3 |
| C | 1 | 81 | 1923 | 7.68 | 668 | 631 | 168.3 |
| C | 3 | 126 | 1736 | 6.57 | 668 | 631 | 168.3 |
| D | 15 | 46 | 1567 | 6.36 | 610 | 559 | 158.4 |
| D | 6 | 67 | 1504 | 5.97 | 610 | 559 | 158.4 |
| D | 10 | 189 | 1489 | 5.87 | 610 | 559 | 158.4 |
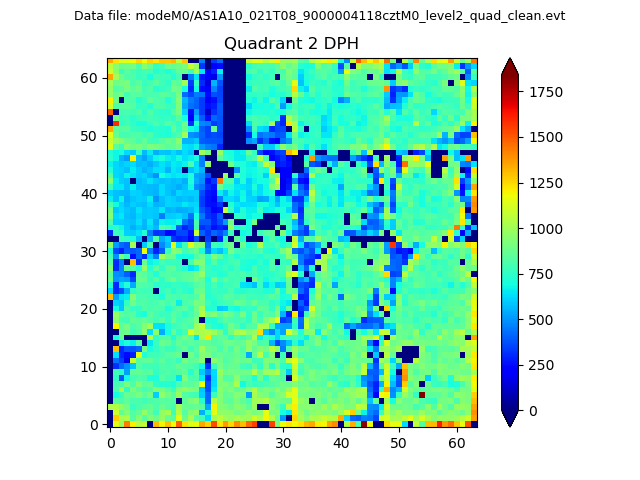
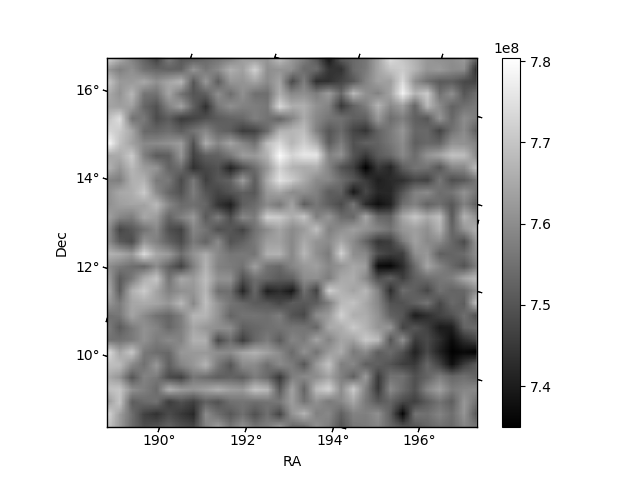
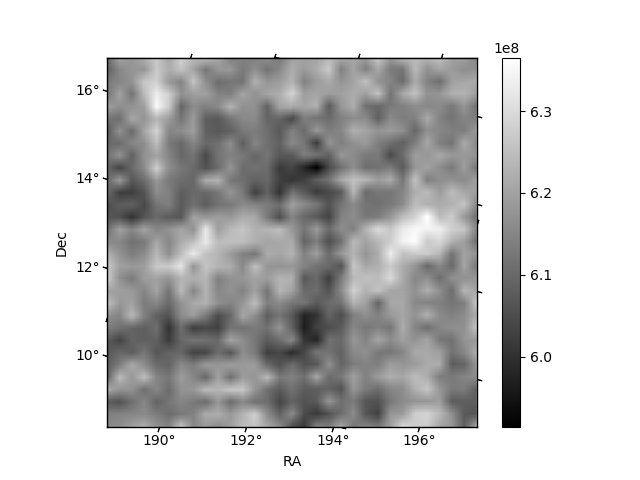
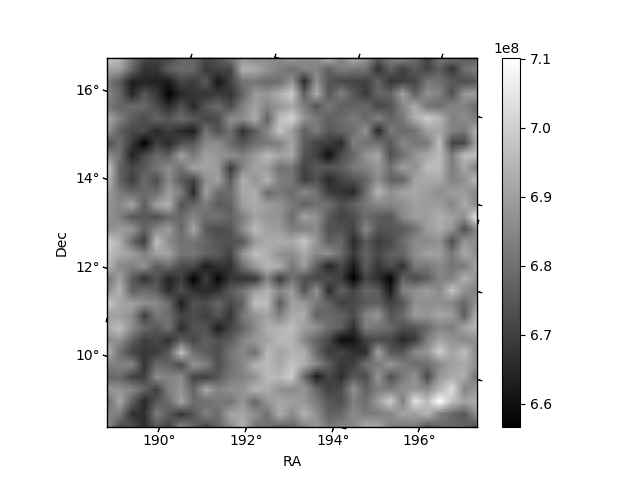
Histogram calculated using DETX and DETY for each event in the final _common_clean file
| Quadrant A | 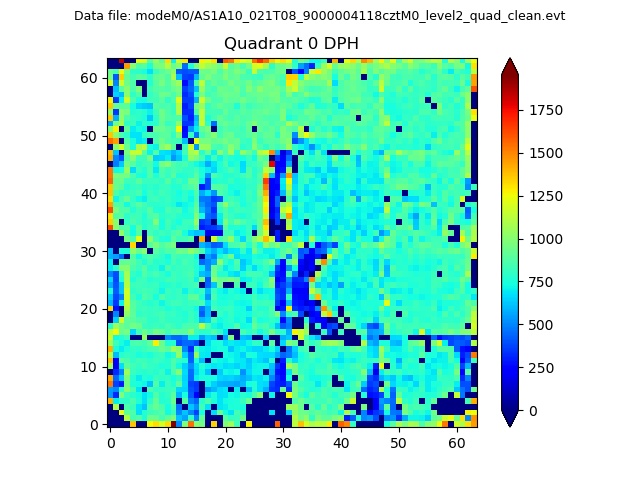 |
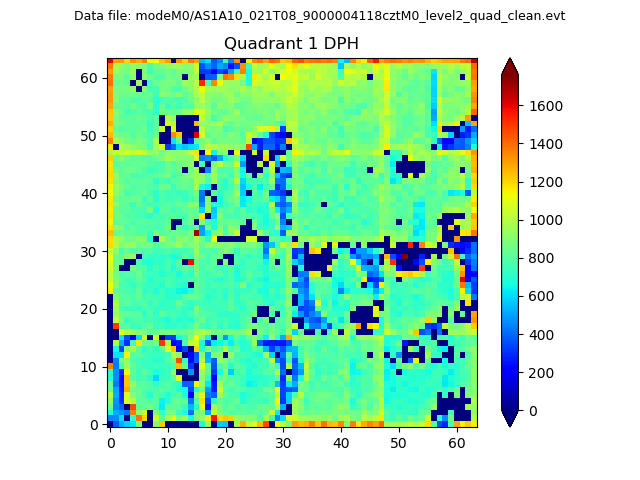 |
Quadrant B |
|---|---|---|---|
| Quadrant D | 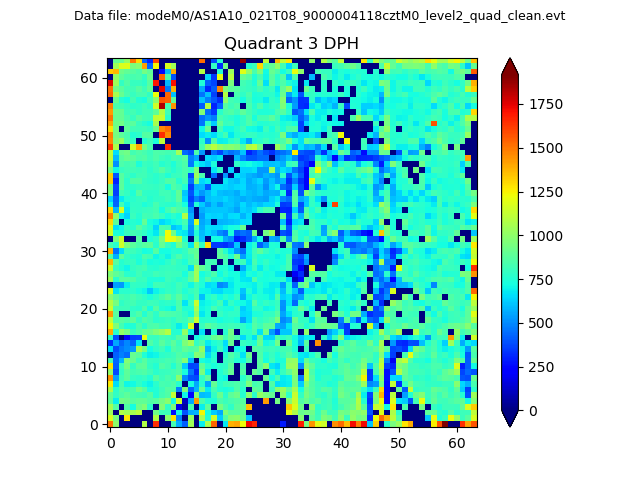 |
 |
Quadrant C |
| Plot type | Count rate plots | Images |
|---|---|---|
| Comparison with Poisson distribution Blue bars denote a histogram of data divided into 1 sec bins. Red curve is a Poisson curve with rate = median count rate of data. |
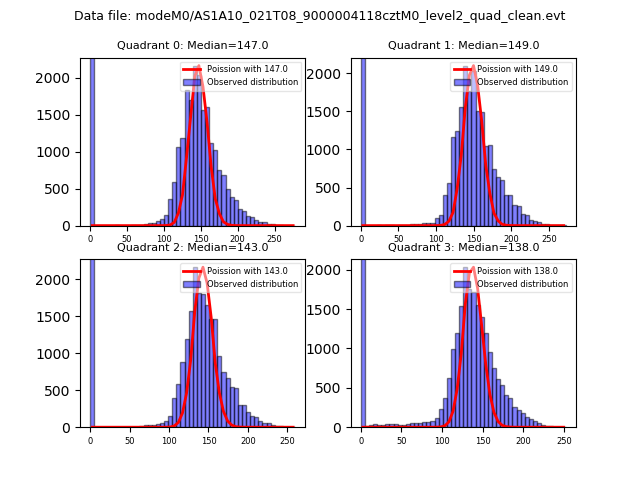 |
 |
| Quadrant-wise count rates Data is divided into 100 sec bins |
 |
|
| Module-wise count rates for Quadrant A Data is divided into 100 sec bins |
 |
 |
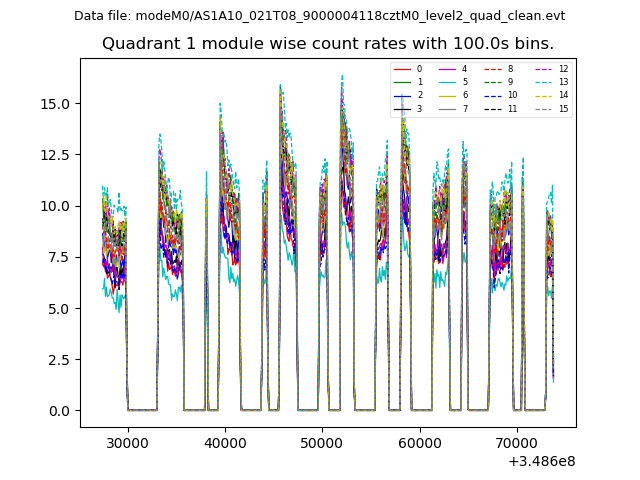
| Module-wise count rates for Quadrant B Data is divided into 100 sec bins |
 |
 |
| Module-wise count rates for Quadrant C Data is divided into 100 sec bins |
 |
 |
| Module-wise count rates for Quadrant D Data is divided into 100 sec bins |
 |
 |
| Parameter | Plot |
|---|---|
| CZT HV Monitor |  |
| D_VDD |  |
| Temperature 1 | 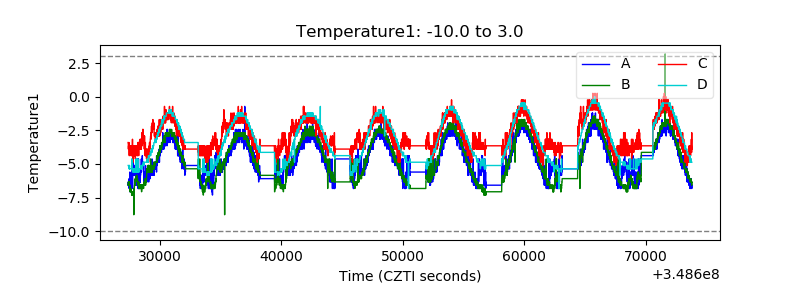 |
| Veto HV Monitor |  |
| Veto LLD |  |
| Alpha Counter | 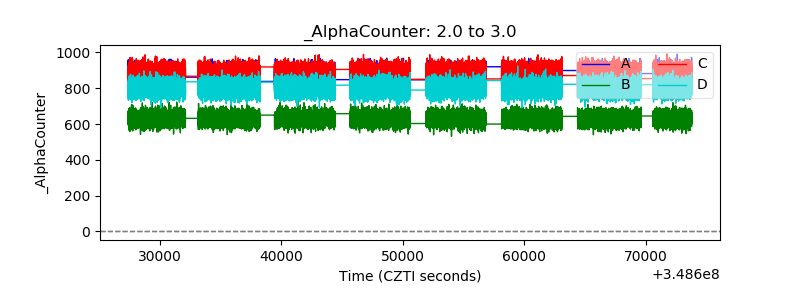 |
| _CPM_Rate |  |
| CZT Counter | 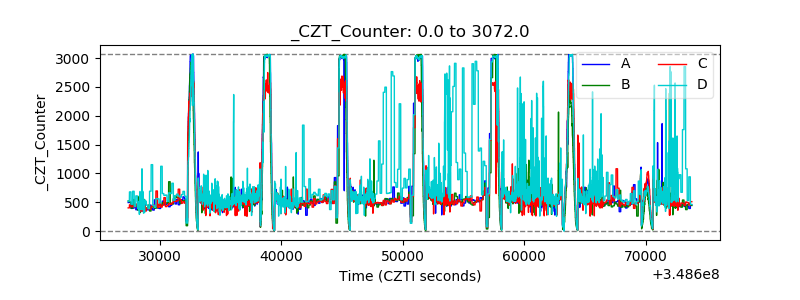 |
| +2.5 Volts monitor |  |
| +5 Volts monitor | 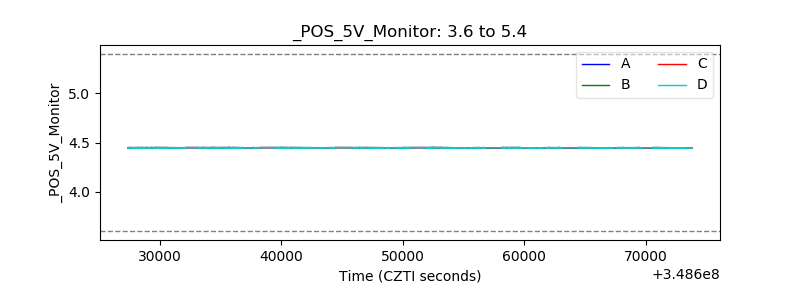 |
| _ROLL_ROT |  |
| _Roll_DEC |  |
| _Roll_RA |  |
| Veto Counter |  |