| Param | Original file | Final file |
|---|---|---|
| Filename | modeM0/AS1A10_021T08_9000004118_28699cztM0_level2.evt | modeM0/AS1A10_021T08_9000004118_28699cztM0_level2_quad_clean.evt |
| Size (bytes) | 437,713,920 | 85,587,840 |
| Size | 417.4 MB | 81.6 MB |
| Events in quadrant A | 2,950,523 | 546,185 |
| Events in quadrant B | 3,008,147 | 558,069 |
| Events in quadrant C | 3,009,264 | 533,148 |
| Events in quadrant D | 3,859,957 | 514,776 |
| Mode M9 | |||
|---|---|---|---|
| Quadrant | BADHDUFLAG | Total packets | Discarded packets |
| A | 0 | 10 | 0 |
| B | 0 | 10 | 0 |
| C | 0 | 10 | 0 |
| D | 0 | 10 | 0 |
| Mode M0 | |||
|---|---|---|---|
| Quadrant | BADHDUFLAG | Total packets | Discarded packets |
| A | 0 | 12867 | 1 |
| B | 0 | 13016 | 1 |
| C | 0 | 13010 | 1 |
| D | 0 | 15877 | 1 |
| Mode SS | |||
|---|---|---|---|
| Quadrant | BADHDUFLAG | Total packets | Discarded packets |
| A | 0 | 128 | 0 |
| B | 0 | 128 | 0 |
| C | 0 | 128 | 0 |
| D | 0 | 128 | 0 |
| Quadrant | Total seconds | Saturated seconds | Saturation percentage |
|---|---|---|---|
| A | 6301 | 21 | 0.333280% |
| B | 6300 | 40 | 0.634921% |
| C | 6300 | 108 | 1.714286% |
| D | 6300 | 39 | 0.619048% |
Noise dominated data is calculated using 1-second bins in cleaned event files. If a bin has >2000 counts, and if more than 50% of those come from <1% of pixels, then it is considered to be noise-dominated and hence unusable.
| Quadrant | # 1 sec bins | Bins with >0 counts | Bins with >2000 counts | High rate bins dominated by noise | Noise dominated (total time) | Noise dominated (detector-on time) | Marked lightcurve |
|---|---|---|---|---|---|---|---|
| A | 7346 | 6301 | 0 | 0 | 0.00% | 0.00% | 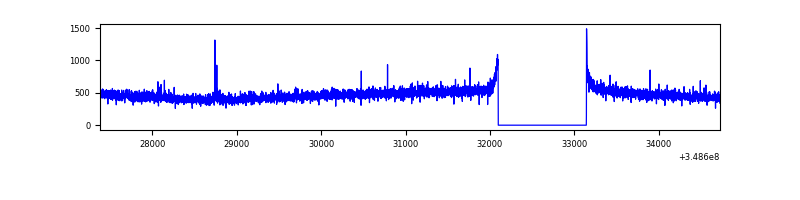 |
| B | 7345 | 6300 | 6 | 6 | 0.08% | 0.10% | 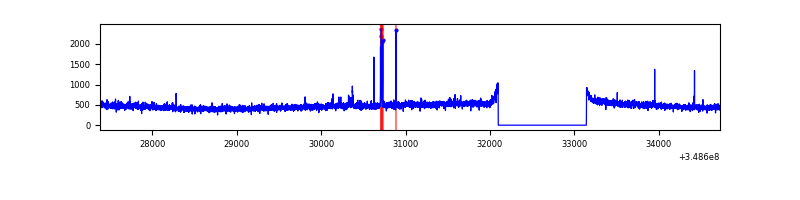 |
| C | 7345 | 6300 | 0 | 0 | 0.00% | 0.00% | 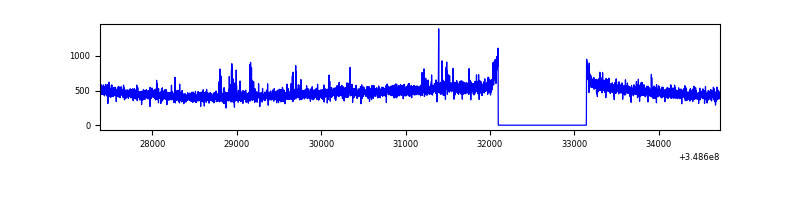 |
| D | 7345 | 6300 | 10 | 10 | 0.14% | 0.16% | 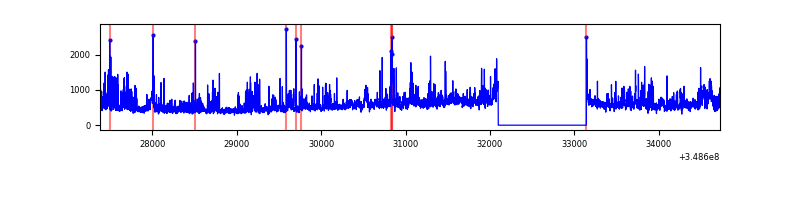 |
Top three noisy pixels from each quadrant. If the there are fewer than three noisy pixels in the level2.evt file, extra rows are filled as -1
| Pixel properties | Quadrant properties | ||||||
|---|---|---|---|---|---|---|---|
| Quadrant | DetID | PixID | Counts | Sigma | Mean | Median | Sigma |
| A | 13 | 254 | 11220 | 68.5 | 760 | 745 | 152.9 |
| A | 14 | 239 | 7963 | 47.2 | 760 | 745 | 152.9 |
| A | 3 | 137 | 7293 | 42.82 | 760 | 745 | 152.9 |
| B | 10 | 247 | 31792 | 216.42 | 756 | 737 | 143.5 |
| B | 12 | 111 | 17889 | 119.53 | 756 | 737 | 143.5 |
| B | 11 | 111 | 16023 | 106.52 | 756 | 737 | 143.5 |
| C | 14 | 238 | 139865 | 816.17 | 726 | 728 | 170.5 |
| C | 14 | 254 | 33320 | 191.18 | 726 | 728 | 170.5 |
| C | 3 | 233 | 9519 | 51.57 | 726 | 728 | 170.5 |
| D | 1 | 52 | 496434 | 2844.98 | 730 | 709 | 174.2 |
| D | 8 | 195 | 343561 | 1967.64 | 730 | 709 | 174.2 |
| D | 13 | 104 | 136077 | 776.88 | 730 | 709 | 174.2 |
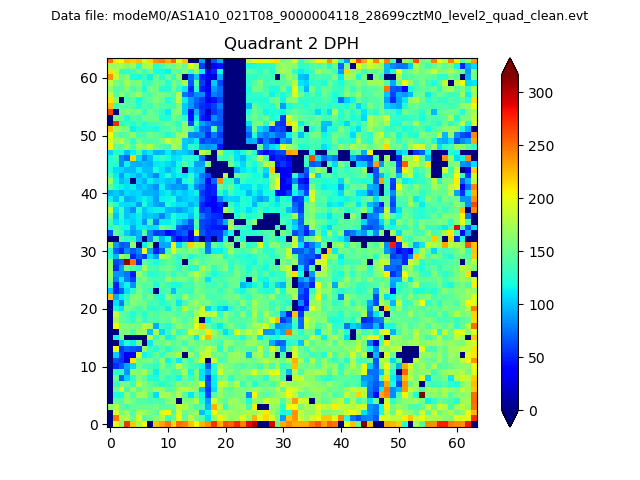
Histogram calculated using DETX and DETY for each event in the final _common_clean file
| Quadrant A | 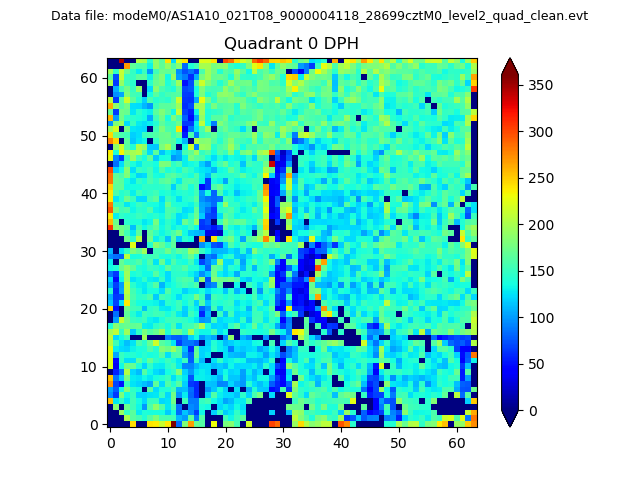 |
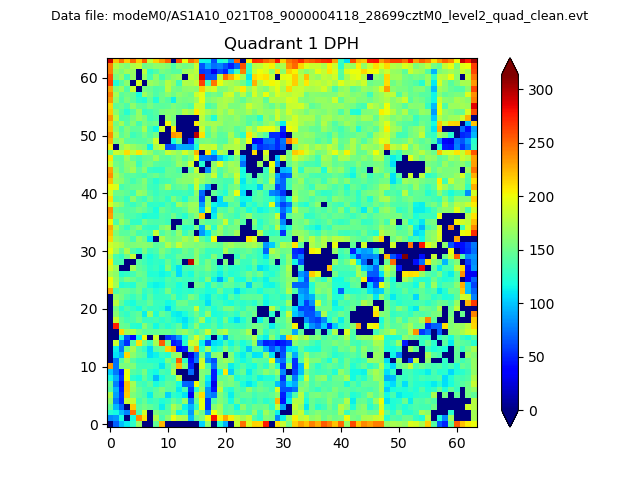 |
Quadrant B |
|---|---|---|---|
| Quadrant D | 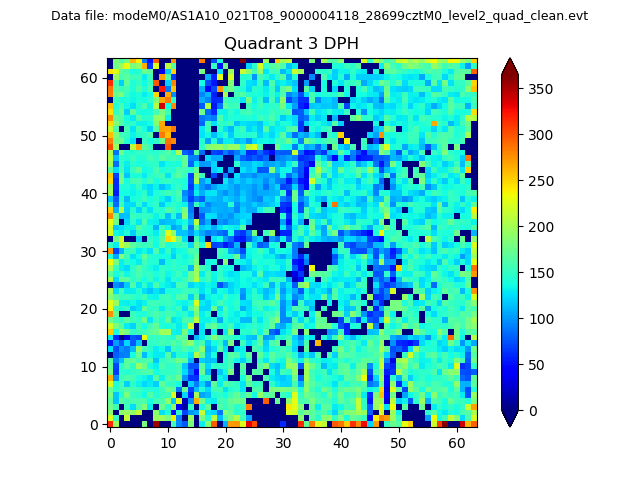 |
 |
Quadrant C |
| Plot type | Count rate plots | Images |
|---|---|---|
| Comparison with Poisson distribution Blue bars denote a histogram of data divided into 1 sec bins. Red curve is a Poisson curve with rate = median count rate of data. |
 |
 |
| Quadrant-wise count rates Data is divided into 100 sec bins |
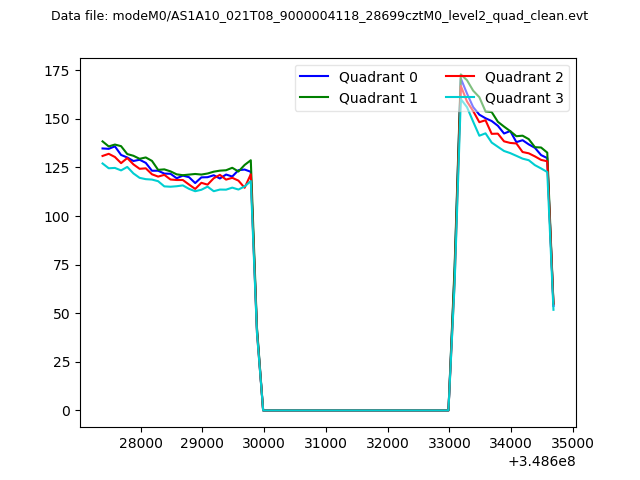 |
|
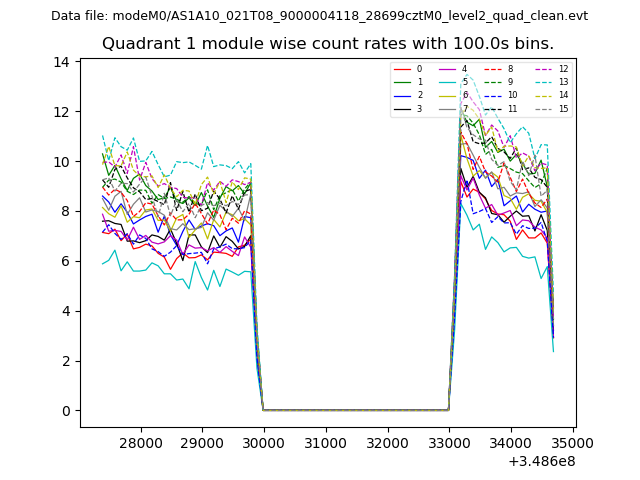
| Module-wise count rates for Quadrant A Data is divided into 100 sec bins |
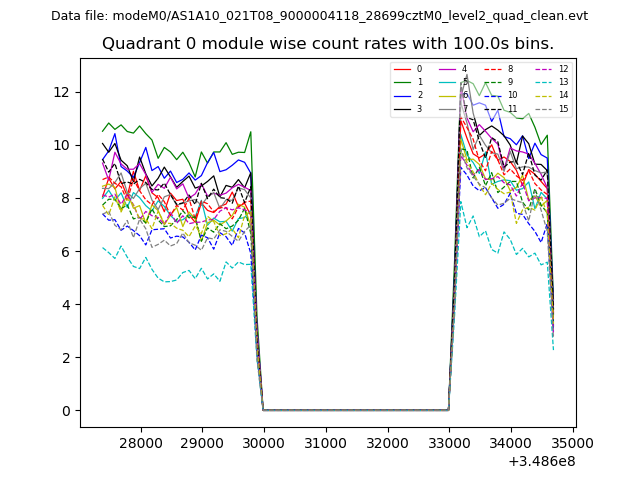 |
 |
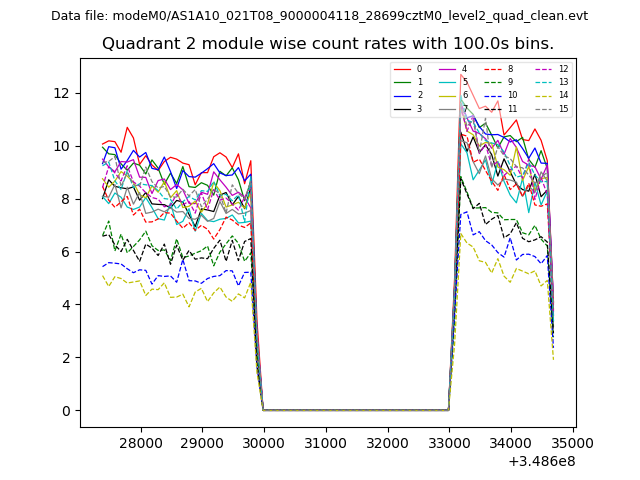
| Module-wise count rates for Quadrant B Data is divided into 100 sec bins |
 |
 |
| Module-wise count rates for Quadrant C Data is divided into 100 sec bins |
 |
 |
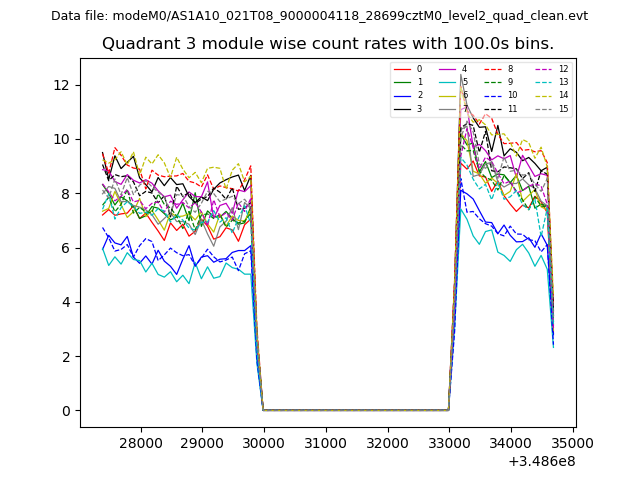
| Module-wise count rates for Quadrant D Data is divided into 100 sec bins |
 |
 |
| Parameter | Plot |
|---|---|
| CZT HV Monitor | 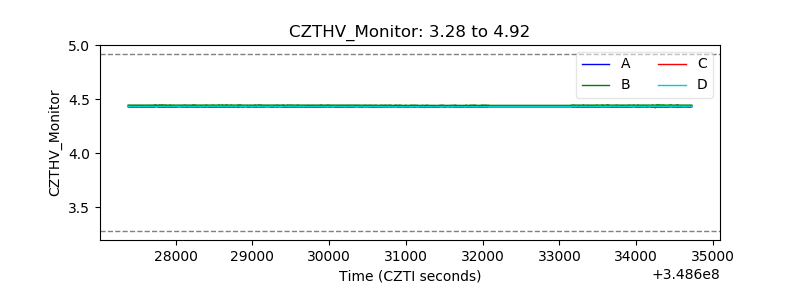 |
| D_VDD |  |
| Temperature 1 | 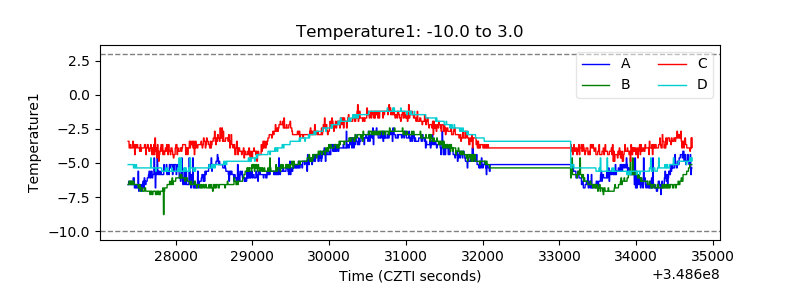 |
| Veto HV Monitor | 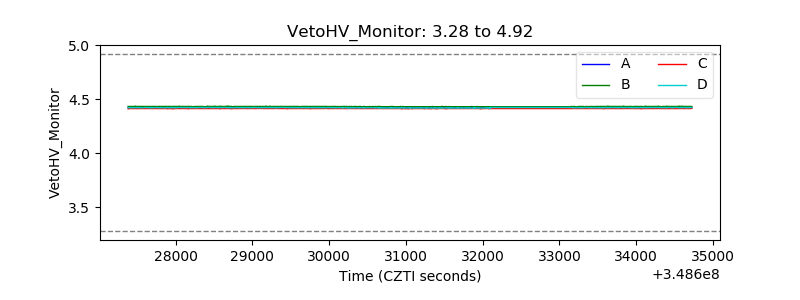 |
| Veto LLD | 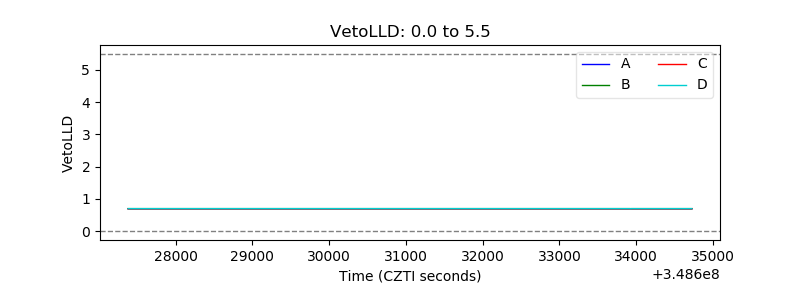 |
| Alpha Counter | 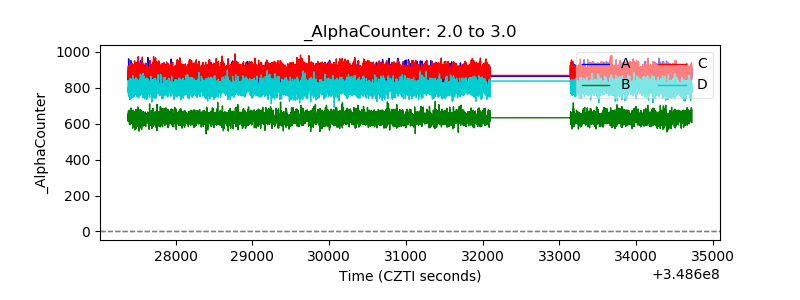 |
| _CPM_Rate | 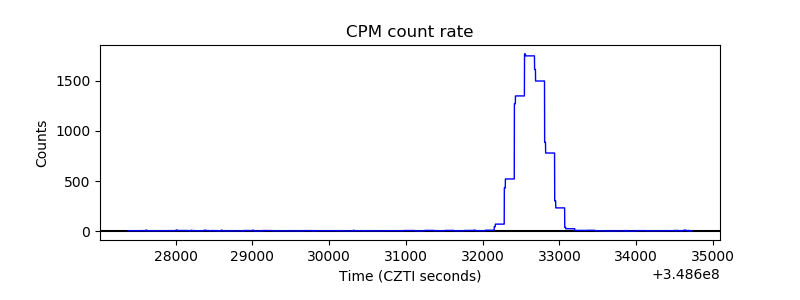 |
| CZT Counter | 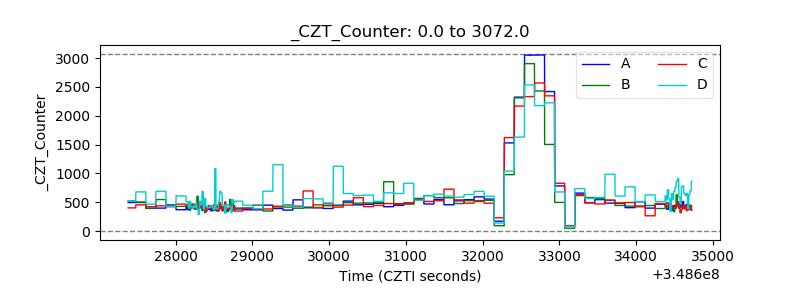 |
| +2.5 Volts monitor |  |
| +5 Volts monitor |  |
| _ROLL_ROT | 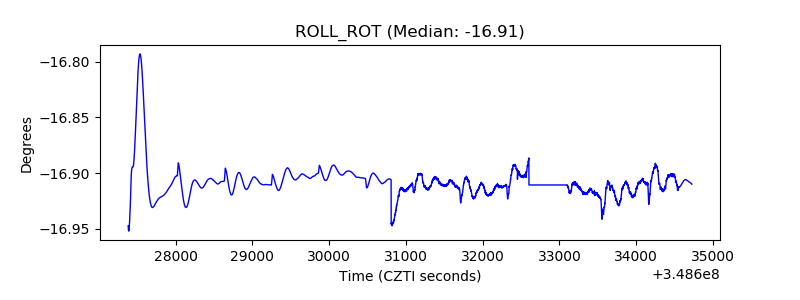 |
| _Roll_DEC | 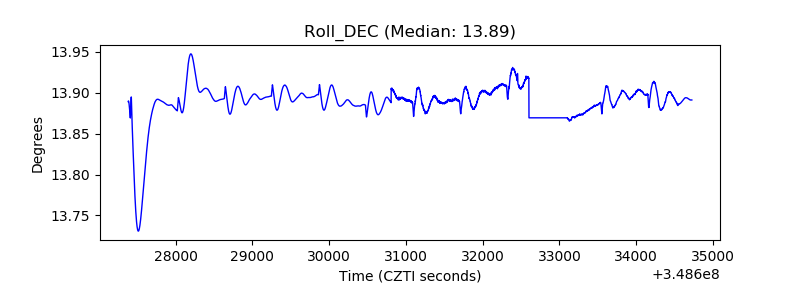 |
| _Roll_RA | 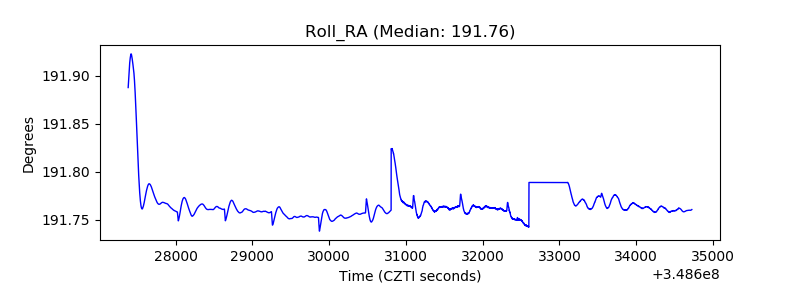 |
| Veto Counter | 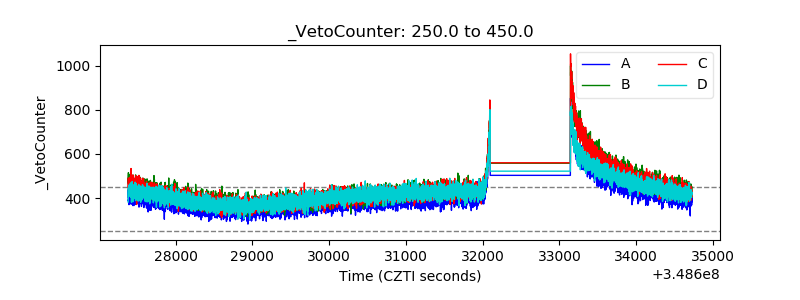 |