| Param | Original file | Final file |
|---|---|---|
| Filename | modeM0/AS1A10_021T08_9000004118_28703cztM0_level2.evt | modeM0/AS1A10_021T08_9000004118_28703cztM0_level2_quad_clean.evt |
| Size (bytes) | 573,160,320 | 103,982,400 |
| Size | 546.6 MB | 99.2 MB |
| Events in quadrant A | 3,450,449 | 692,576 |
| Events in quadrant B | 3,438,829 | 705,286 |
| Events in quadrant C | 3,503,464 | 672,277 |
| Events in quadrant D | 6,540,813 | 641,415 |
| Mode M9 | |||
|---|---|---|---|
| Quadrant | BADHDUFLAG | Total packets | Discarded packets |
| A | 0 | 15 | 0 |
| B | 0 | 16 | 0 |
| C | 0 | 16 | 0 |
| D | 0 | 16 | 0 |
| Mode M0 | |||
|---|---|---|---|
| Quadrant | BADHDUFLAG | Total packets | Discarded packets |
| A | 0 | 13799 | 2 |
| B | 0 | 13792 | 2 |
| C | 0 | 14074 | 2 |
| D | 0 | 23827 | 2 |
| Mode SS | |||
|---|---|---|---|
| Quadrant | BADHDUFLAG | Total packets | Discarded packets |
| A | 0 | 128 | 0 |
| B | 0 | 128 | 0 |
| C | 0 | 128 | 0 |
| D | 0 | 128 | 0 |
| Quadrant | Total seconds | Saturated seconds | Saturation percentage |
|---|---|---|---|
| A | 6265 | 98 | 1.564246% |
| B | 6265 | 119 | 1.899441% |
| C | 6265 | 172 | 2.745411% |
| D | 6265 | 1015 | 16.201117% |
Noise dominated data is calculated using 1-second bins in cleaned event files. If a bin has >2000 counts, and if more than 50% of those come from <1% of pixels, then it is considered to be noise-dominated and hence unusable.
| Quadrant | # 1 sec bins | Bins with >0 counts | Bins with >2000 counts | High rate bins dominated by noise | Noise dominated (total time) | Noise dominated (detector-on time) | Marked lightcurve |
|---|---|---|---|---|---|---|---|
| A | 7550 | 6265 | 0 | 0 | 0.00% | 0.00% | 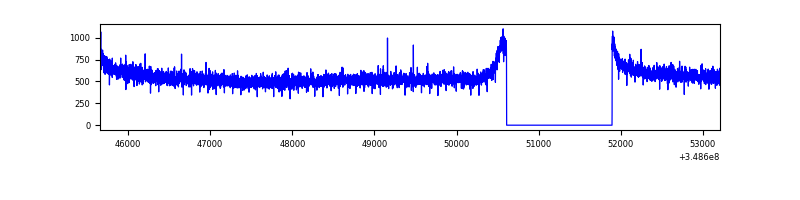 |
| B | 7550 | 6265 | 2 | 2 | 0.03% | 0.03% | 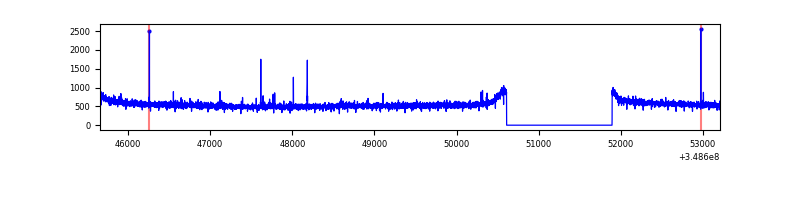 |
| C | 7550 | 6265 | 0 | 0 | 0.00% | 0.00% |  |
| D | 7550 | 6265 | 899 | 899 | 11.91% | 14.35% | 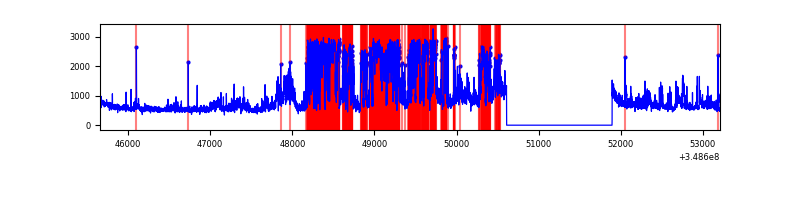 |
Top three noisy pixels from each quadrant. If the there are fewer than three noisy pixels in the level2.evt file, extra rows are filled as -1
| Pixel properties | Quadrant properties | ||||||
|---|---|---|---|---|---|---|---|
| Quadrant | DetID | PixID | Counts | Sigma | Mean | Median | Sigma |
| A | 13 | 254 | 11358 | 59.54 | 892 | 876 | 176.0 |
| A | 0 | 226 | 7771 | 39.17 | 892 | 876 | 176.0 |
| A | 3 | 137 | 7612 | 38.26 | 892 | 876 | 176.0 |
| B | 12 | 111 | 19436 | 113.88 | 871 | 851 | 163.2 |
| B | 11 | 111 | 17789 | 103.79 | 871 | 851 | 163.2 |
| B | 14 | 111 | 16924 | 98.49 | 871 | 851 | 163.2 |
| C | 14 | 238 | 150950 | 766.88 | 850 | 860 | 195.7 |
| C | 14 | 254 | 18428 | 89.76 | 850 | 860 | 195.7 |
| C | 10 | 22 | 12246 | 58.18 | 850 | 860 | 195.7 |
| D | 1 | 52 | 2532014 | 13379.53 | 806 | 790 | 189.2 |
| D | 7 | 80 | 434859 | 2294.4 | 806 | 790 | 189.2 |
| D | 8 | 195 | 249369 | 1313.94 | 806 | 790 | 189.2 |
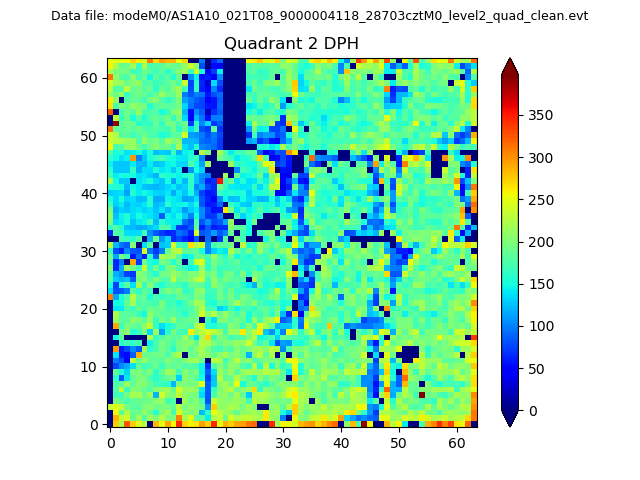
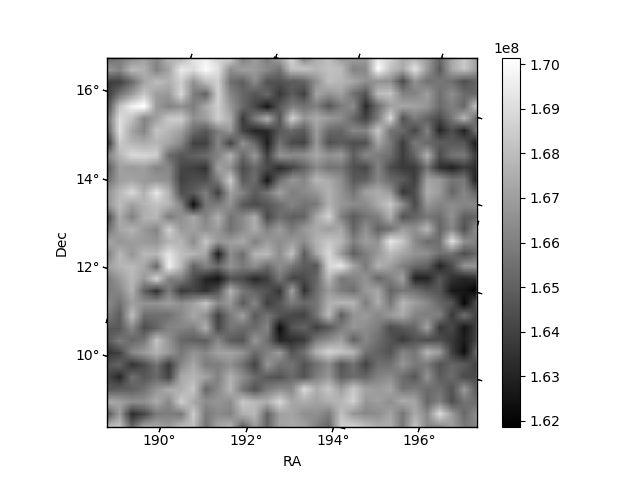
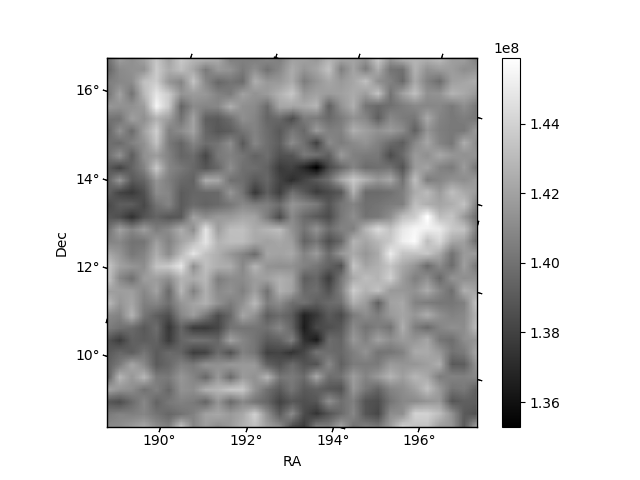
Histogram calculated using DETX and DETY for each event in the final _common_clean file
| Quadrant A | 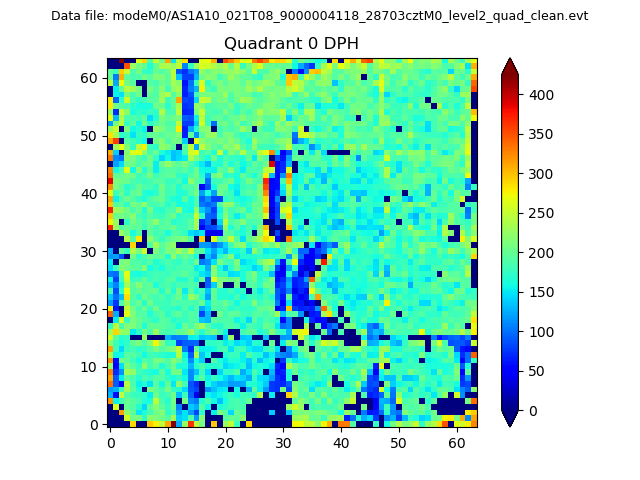 |
 |
Quadrant B |
|---|---|---|---|
| Quadrant D |  |
 |
Quadrant C |
| Plot type | Count rate plots | Images |
|---|---|---|
| Comparison with Poisson distribution Blue bars denote a histogram of data divided into 1 sec bins. Red curve is a Poisson curve with rate = median count rate of data. |
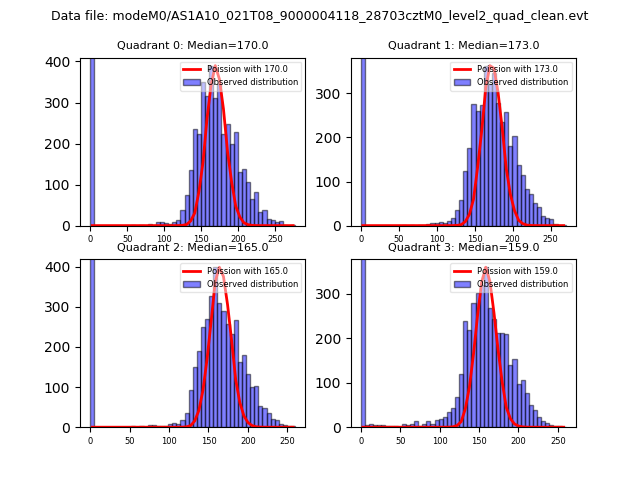 |
 |
| Quadrant-wise count rates Data is divided into 100 sec bins |
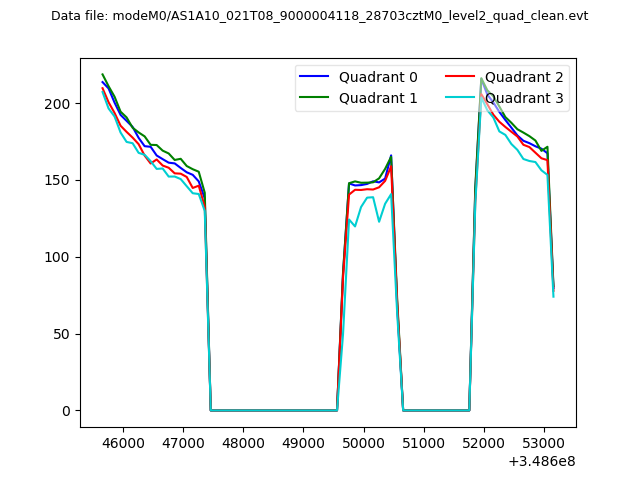 |
|
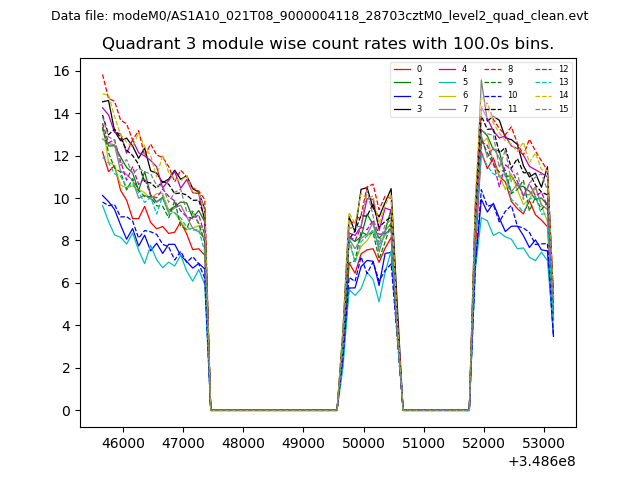
| Module-wise count rates for Quadrant A Data is divided into 100 sec bins |
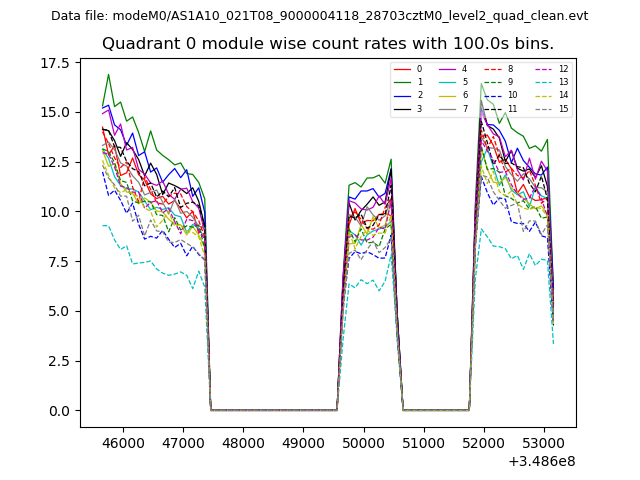 |
 |
| Module-wise count rates for Quadrant B Data is divided into 100 sec bins |
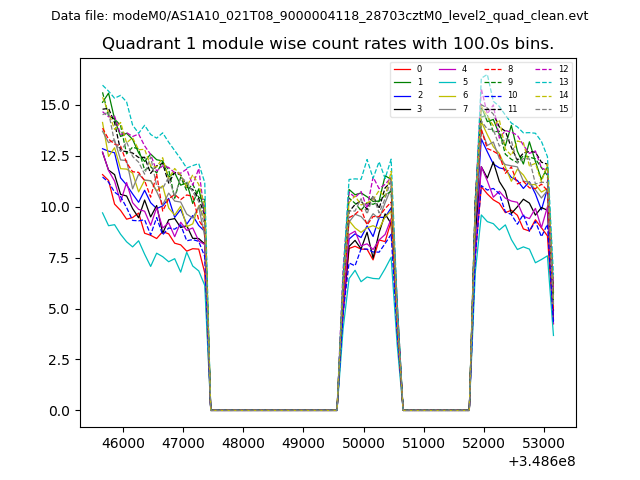 |
 |
| Module-wise count rates for Quadrant C Data is divided into 100 sec bins |
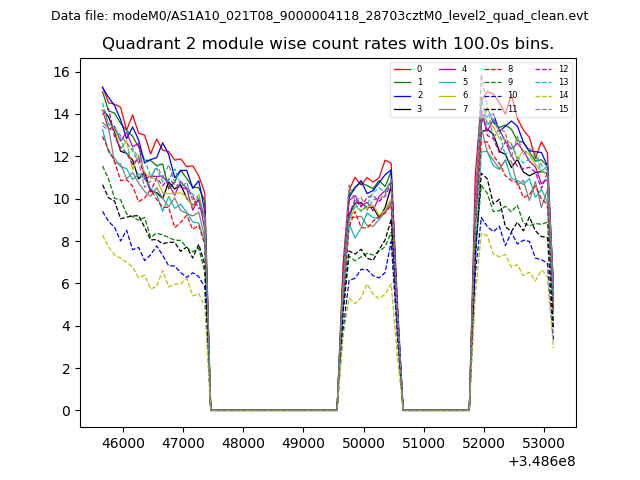 |
 |
| Module-wise count rates for Quadrant D Data is divided into 100 sec bins |
 |
 |
| Parameter | Plot |
|---|---|
| CZT HV Monitor | 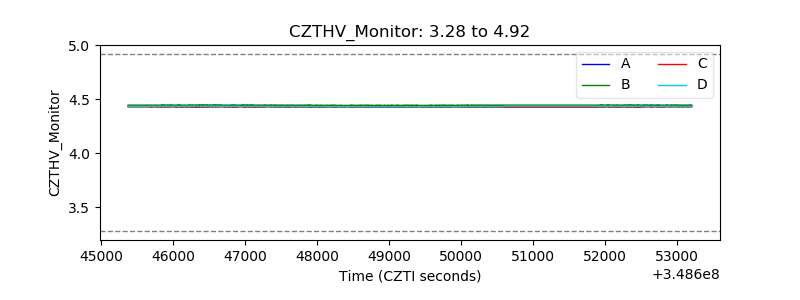 |
| D_VDD | 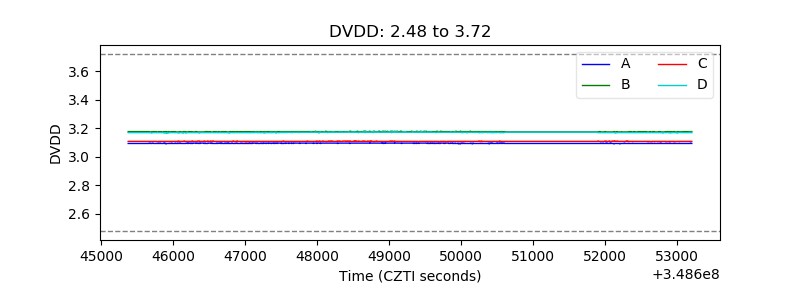 |
| Temperature 1 | 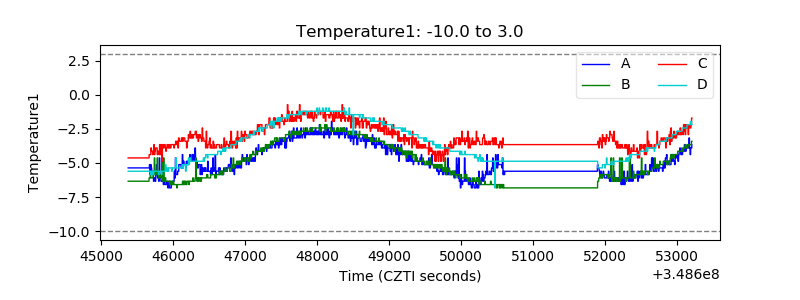 |
| Veto HV Monitor | 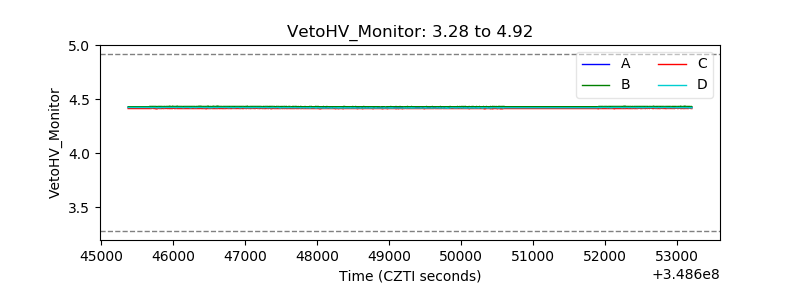 |
| Veto LLD | 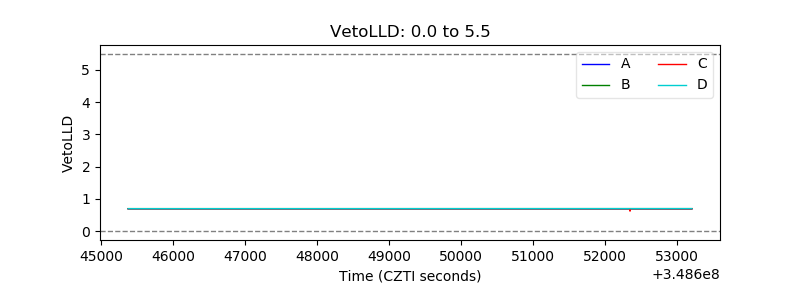 |
| Alpha Counter | 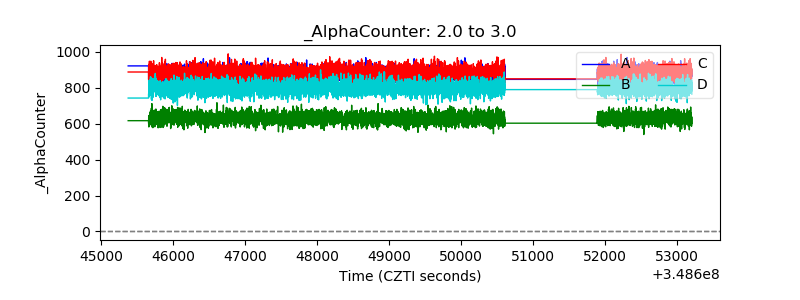 |
| _CPM_Rate | 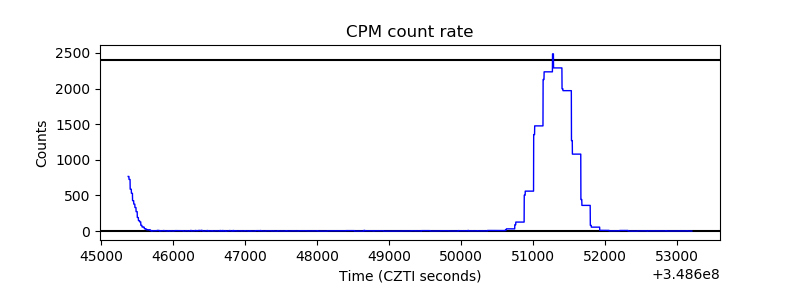 |
| CZT Counter | 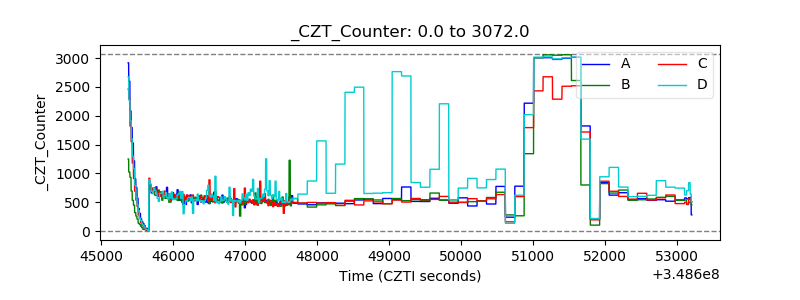 |
| +2.5 Volts monitor |  |
| +5 Volts monitor |  |
| _ROLL_ROT | 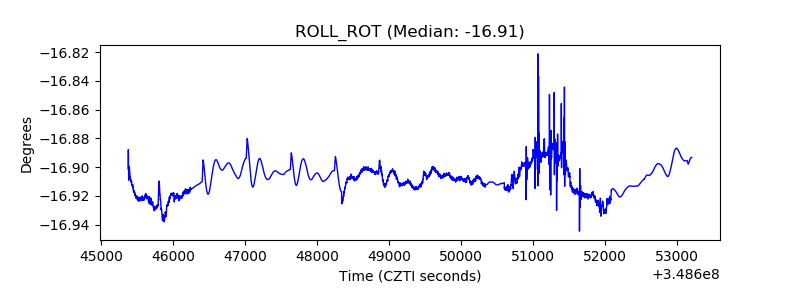 |
| _Roll_DEC | 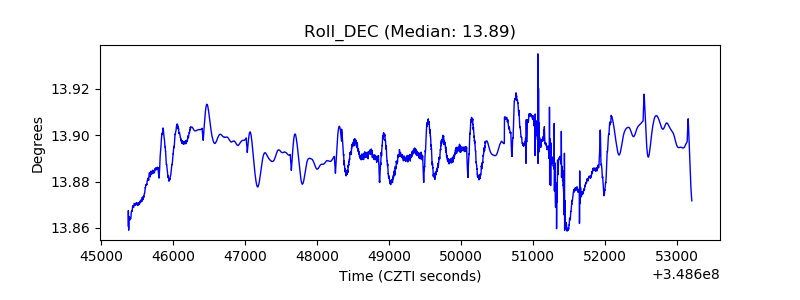 |
| _Roll_RA | 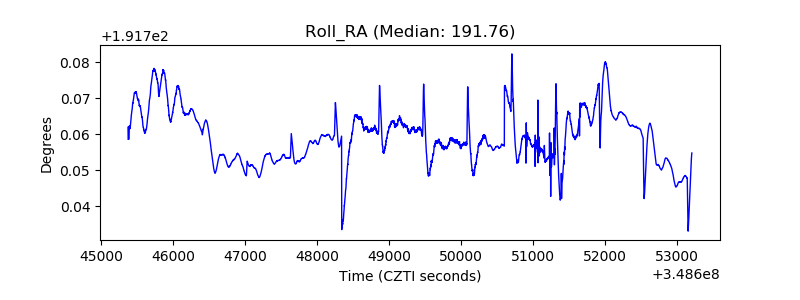 |
| Veto Counter | 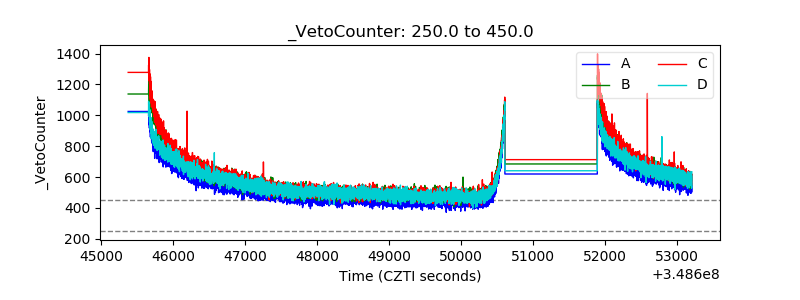 |