| Param | Original file | Final file |
|---|---|---|
| Filename | modeM0/AS1A10_021T08_9000004118_28704cztM0_level2.evt | modeM0/AS1A10_021T08_9000004118_28704cztM0_level2_quad_clean.evt |
| Size (bytes) | 604,512,000 | 95,736,960 |
| Size | 576.5 MB | 91.3 MB |
| Events in quadrant A | 3,491,411 | 637,027 |
| Events in quadrant B | 3,583,393 | 644,949 |
| Events in quadrant C | 3,594,791 | 617,673 |
| Events in quadrant D | 7,214,466 | 562,732 |
| Mode M9 | |||
|---|---|---|---|
| Quadrant | BADHDUFLAG | Total packets | Discarded packets |
| A | 0 | 15 | 0 |
| B | 0 | 16 | 0 |
| C | 0 | 16 | 0 |
| D | 0 | 16 | 0 |
| Mode M0 | |||
|---|---|---|---|
| Quadrant | BADHDUFLAG | Total packets | Discarded packets |
| A | 0 | 13905 | 2 |
| B | 0 | 14351 | 2 |
| C | 0 | 14358 | 2 |
| D | 0 | 25997 | 2 |
| Mode SS | |||
|---|---|---|---|
| Quadrant | BADHDUFLAG | Total packets | Discarded packets |
| A | 0 | 126 | 0 |
| B | 0 | 126 | 0 |
| C | 0 | 126 | 0 |
| D | 0 | 126 | 0 |
| Quadrant | Total seconds | Saturated seconds | Saturation percentage |
|---|---|---|---|
| A | 6260 | 122 | 1.948882% |
| B | 6260 | 131 | 2.092652% |
| C | 6260 | 226 | 3.610224% |
| D | 6260 | 1354 | 21.629393% |
Noise dominated data is calculated using 1-second bins in cleaned event files. If a bin has >2000 counts, and if more than 50% of those come from <1% of pixels, then it is considered to be noise-dominated and hence unusable.
| Quadrant | # 1 sec bins | Bins with >0 counts | Bins with >2000 counts | High rate bins dominated by noise | Noise dominated (total time) | Noise dominated (detector-on time) | Marked lightcurve |
|---|---|---|---|---|---|---|---|
| A | 7555 | 6260 | 0 | 0 | 0.00% | 0.00% | 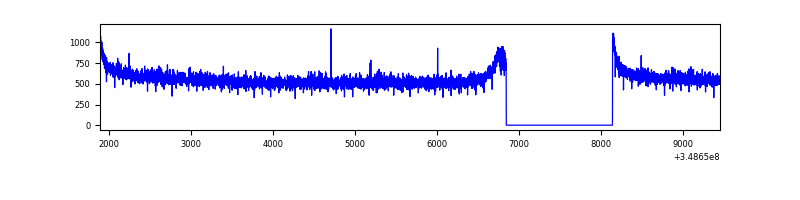 |
| B | 7555 | 6260 | 1 | 1 | 0.01% | 0.02% | 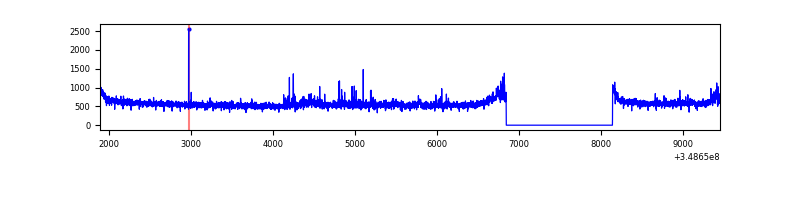 |
| C | 7555 | 6260 | 4 | 4 | 0.05% | 0.06% | 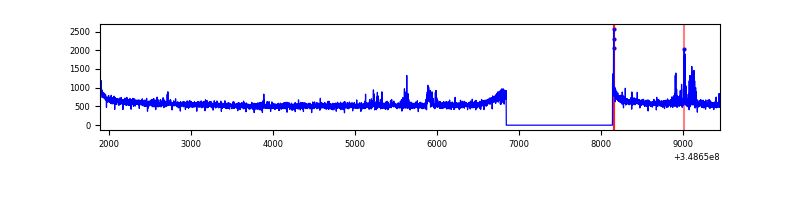 |
| D | 7555 | 6260 | 1249 | 1249 | 16.53% | 19.95% | 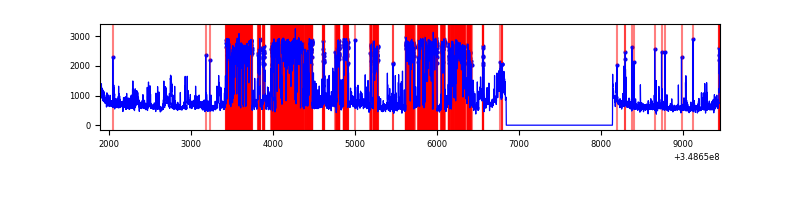 |
Top three noisy pixels from each quadrant. If the there are fewer than three noisy pixels in the level2.evt file, extra rows are filled as -1
| Pixel properties | Quadrant properties | ||||||
|---|---|---|---|---|---|---|---|
| Quadrant | DetID | PixID | Counts | Sigma | Mean | Median | Sigma |
| A | 13 | 254 | 11810 | 61.03 | 902 | 887 | 179.0 |
| A | 14 | 239 | 8113 | 40.38 | 902 | 887 | 179.0 |
| A | 3 | 137 | 7871 | 39.02 | 902 | 887 | 179.0 |
| B | 10 | 245 | 97670 | 588.59 | 878 | 858 | 164.5 |
| B | 15 | 33 | 28706 | 169.31 | 878 | 858 | 164.5 |
| B | 12 | 111 | 19449 | 113.03 | 878 | 858 | 164.5 |
| C | 14 | 238 | 160692 | 811.31 | 857 | 867 | 197.0 |
| C | 10 | 22 | 51325 | 256.14 | 857 | 867 | 197.0 |
| C | 14 | 254 | 29917 | 147.47 | 857 | 867 | 197.0 |
| D | 1 | 52 | 3811477 | 20328.98 | 794 | 774 | 187.5 |
| D | 8 | 195 | 254171 | 1351.8 | 794 | 774 | 187.5 |
| D | 12 | 79 | 52008 | 273.32 | 794 | 774 | 187.5 |
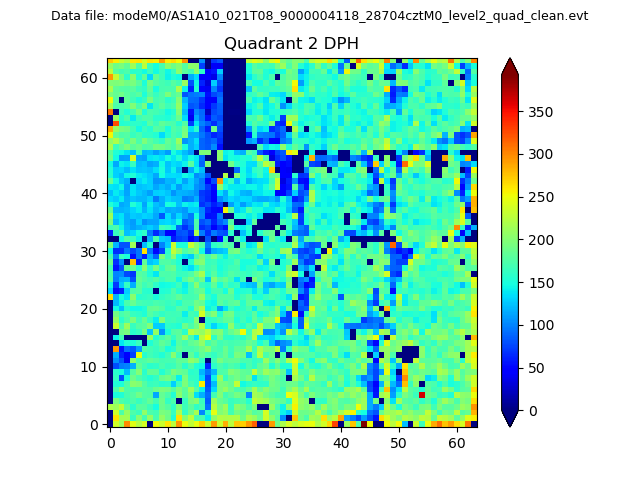
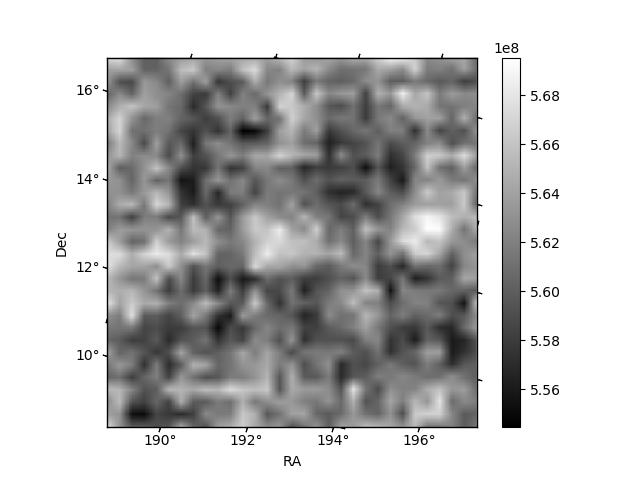
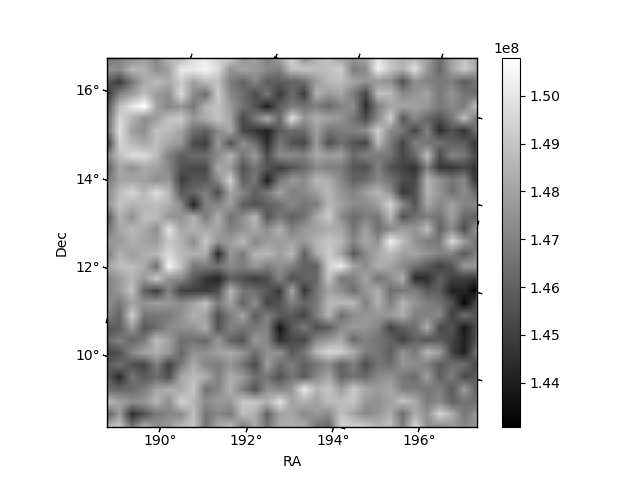
Histogram calculated using DETX and DETY for each event in the final _common_clean file
| Quadrant A | 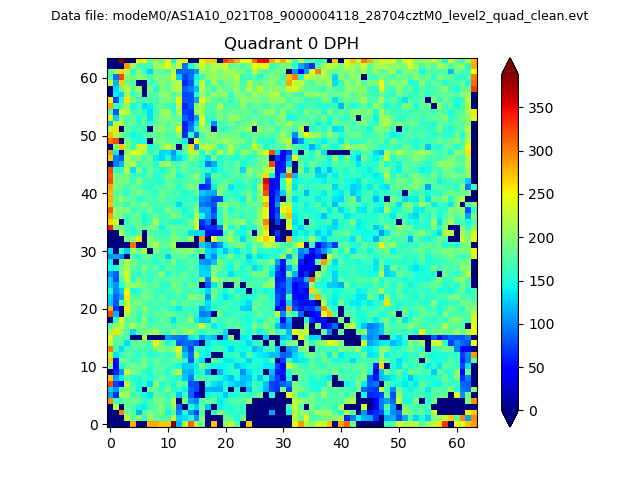 |
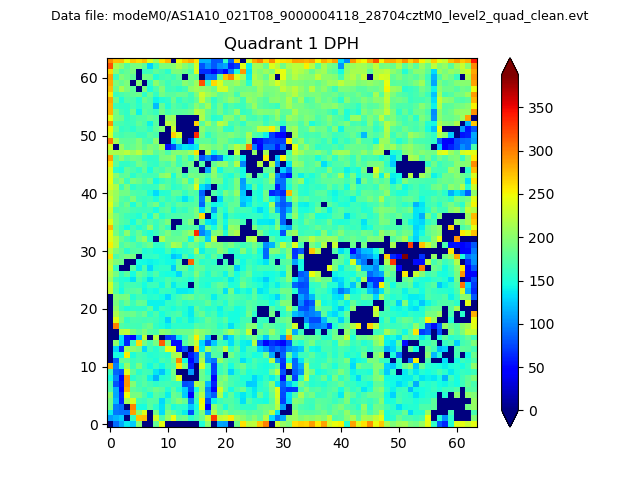 |
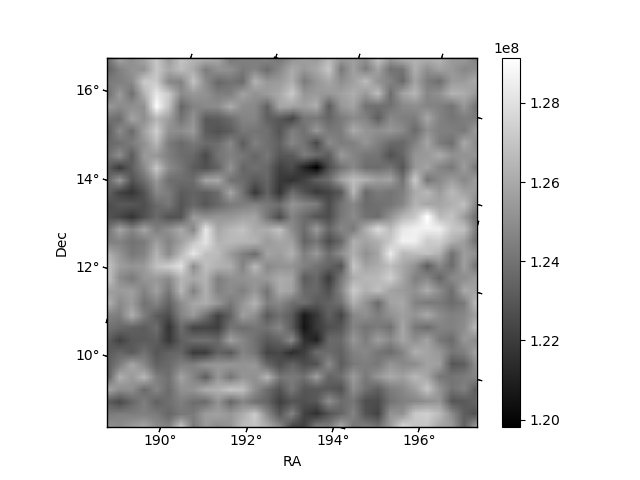
Quadrant B |
|---|---|---|---|
| Quadrant D | 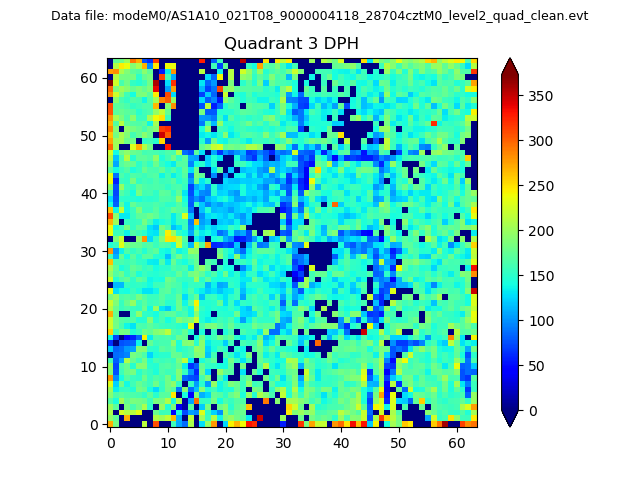 |
 |
Quadrant C |
| Plot type | Count rate plots | Images |
|---|---|---|
| Comparison with Poisson distribution Blue bars denote a histogram of data divided into 1 sec bins. Red curve is a Poisson curve with rate = median count rate of data. |
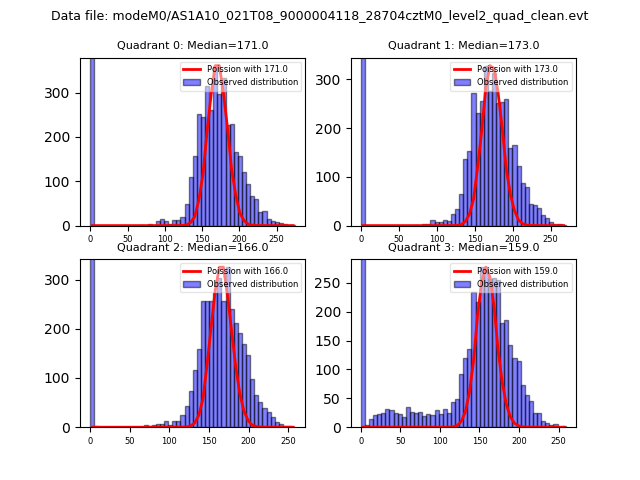 |
 |
| Quadrant-wise count rates Data is divided into 100 sec bins |
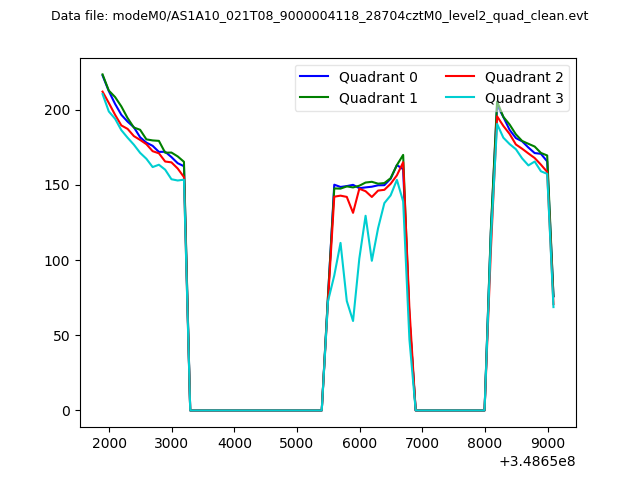 |
|
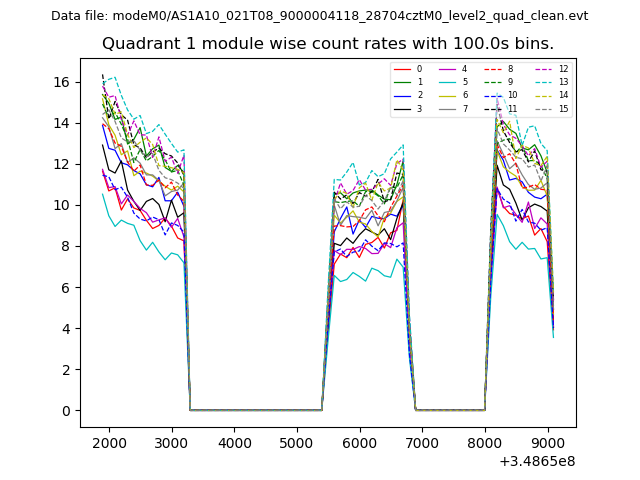
| Module-wise count rates for Quadrant A Data is divided into 100 sec bins |
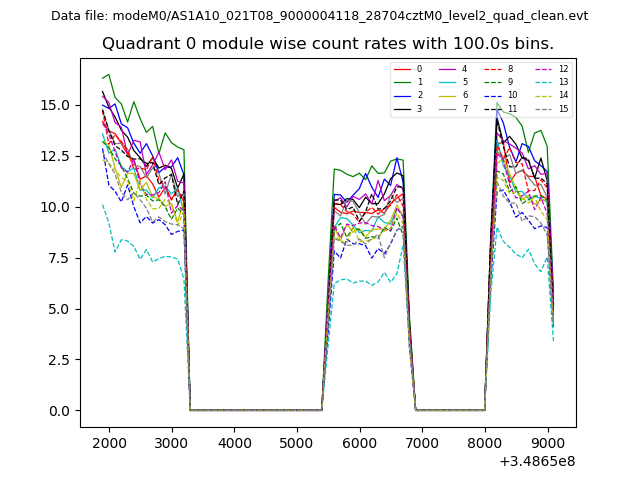 |
 |
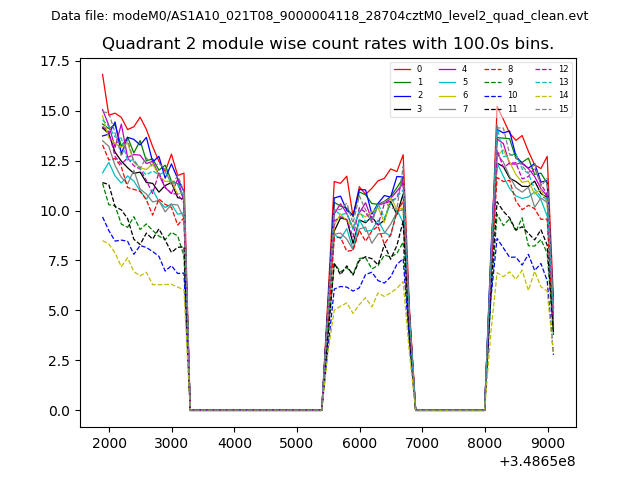
| Module-wise count rates for Quadrant B Data is divided into 100 sec bins |
 |
 |
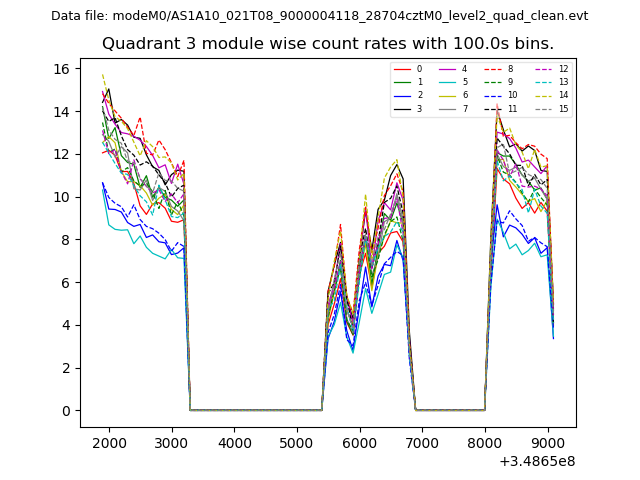
| Module-wise count rates for Quadrant C Data is divided into 100 sec bins |
 |
 |
| Module-wise count rates for Quadrant D Data is divided into 100 sec bins |
 |
 |
| Parameter | Plot |
|---|---|
| CZT HV Monitor | 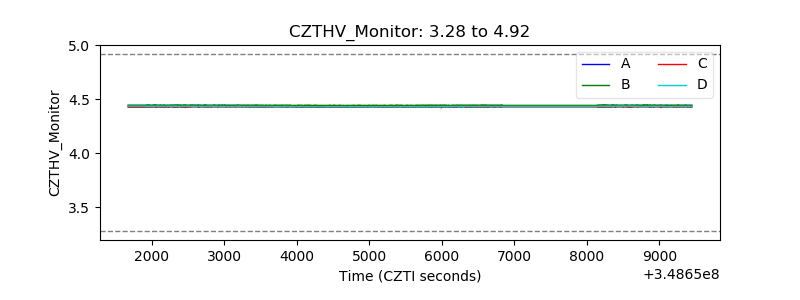 |
| D_VDD | 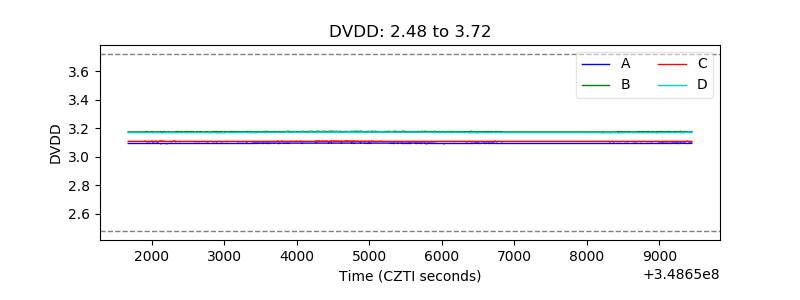 |
| Temperature 1 | 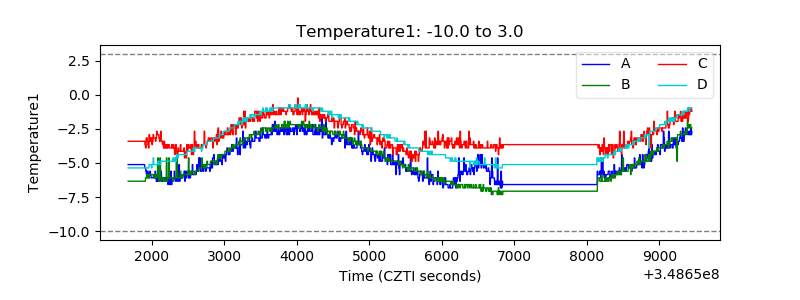 |
| Veto HV Monitor | 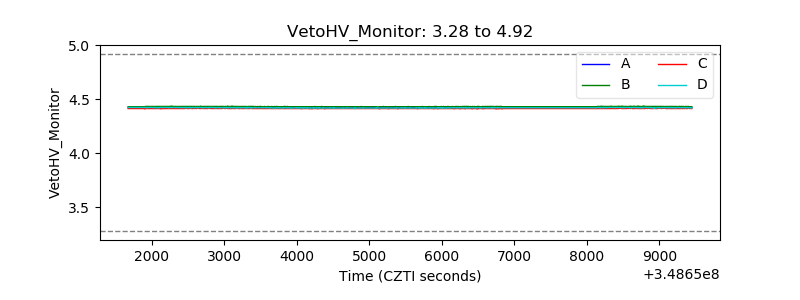 |
| Veto LLD | 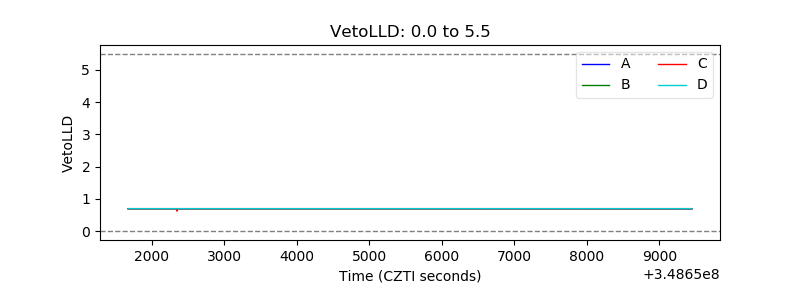 |
| Alpha Counter | 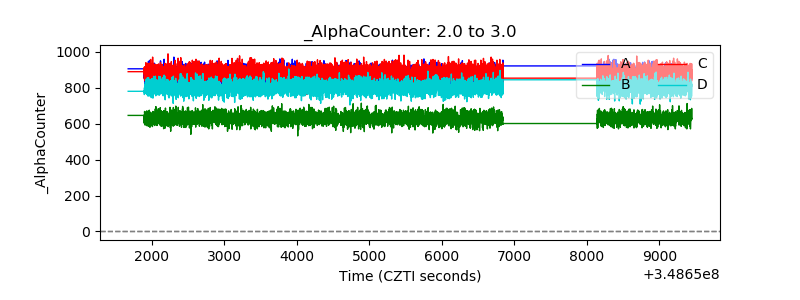 |
| _CPM_Rate | 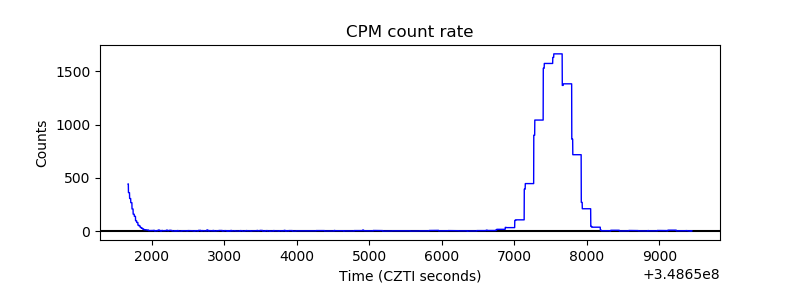 |
| CZT Counter | 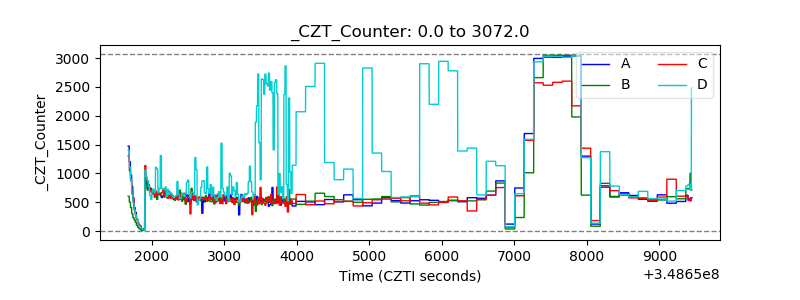 |
| +2.5 Volts monitor |  |
| +5 Volts monitor |  |
| _ROLL_ROT | 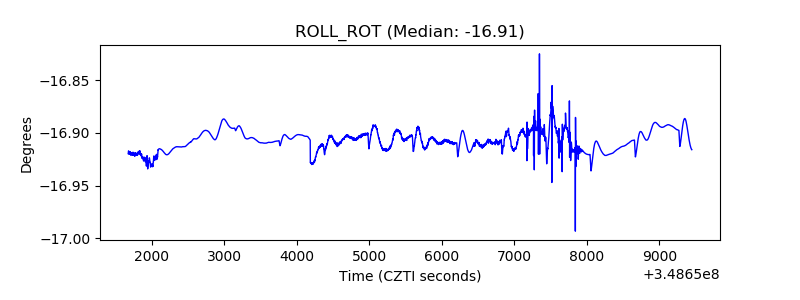 |
| _Roll_DEC | 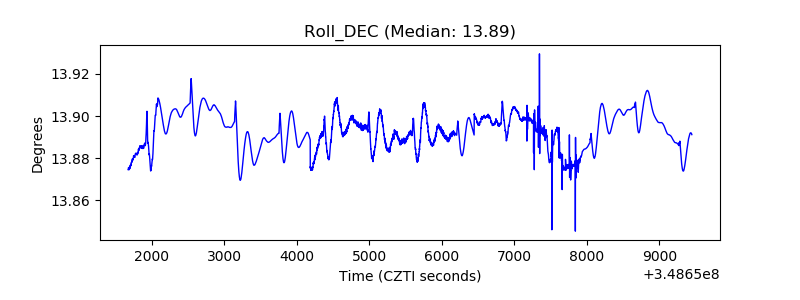 |
| _Roll_RA | 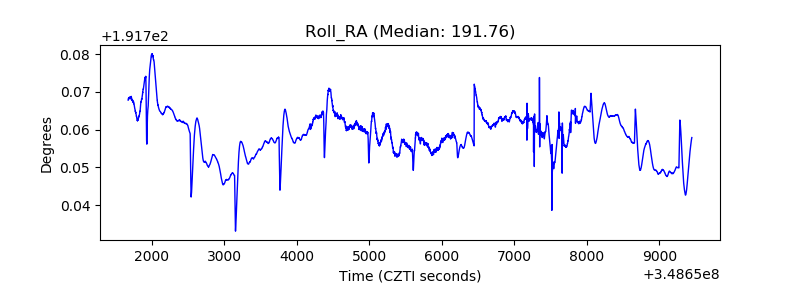 |
| Veto Counter | 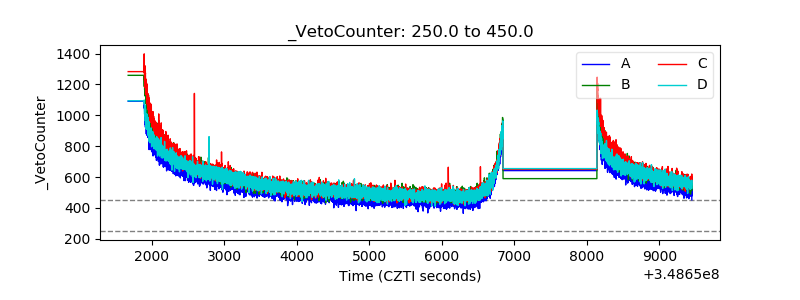 |