| Param | Original file | Final file |
|---|---|---|
| Filename | modeM0/AS1A10_021T08_9000004118_28705cztM0_level2.evt | modeM0/AS1A10_021T08_9000004118_28705cztM0_level2_quad_clean.evt |
| Size (bytes) | 520,292,160 | 84,026,880 |
| Size | 496.2 MB | 80.1 MB |
| Events in quadrant A | 3,409,813 | 537,343 |
| Events in quadrant B | 3,654,017 | 541,985 |
| Events in quadrant C | 3,560,799 | 519,388 |
| Events in quadrant D | 4,706,036 | 506,519 |
| Mode M9 | |||
|---|---|---|---|
| Quadrant | BADHDUFLAG | Total packets | Discarded packets |
| A | 0 | 13 | 0 |
| B | 0 | 13 | 0 |
| C | 0 | 13 | 0 |
| D | 0 | 13 | 0 |
| Mode M0 | |||
|---|---|---|---|
| Quadrant | BADHDUFLAG | Total packets | Discarded packets |
| A | 0 | 13681 | 2 |
| B | 0 | 14563 | 2 |
| C | 0 | 14190 | 2 |
| D | 0 | 18193 | 2 |
| Mode SS | |||
|---|---|---|---|
| Quadrant | BADHDUFLAG | Total packets | Discarded packets |
| A | 0 | 128 | 0 |
| B | 0 | 128 | 0 |
| C | 0 | 128 | 0 |
| D | 0 | 128 | 0 |
| Quadrant | Total seconds | Saturated seconds | Saturation percentage |
|---|---|---|---|
| A | 6291 | 99 | 1.573677% |
| B | 6292 | 117 | 1.859504% |
| C | 6292 | 174 | 2.765416% |
| D | 6292 | 279 | 4.434202% |
Noise dominated data is calculated using 1-second bins in cleaned event files. If a bin has >2000 counts, and if more than 50% of those come from <1% of pixels, then it is considered to be noise-dominated and hence unusable.
| Quadrant | # 1 sec bins | Bins with >0 counts | Bins with >2000 counts | High rate bins dominated by noise | Noise dominated (total time) | Noise dominated (detector-on time) | Marked lightcurve |
|---|---|---|---|---|---|---|---|
| A | 7556 | 6291 | 0 | 0 | 0.00% | 0.00% | 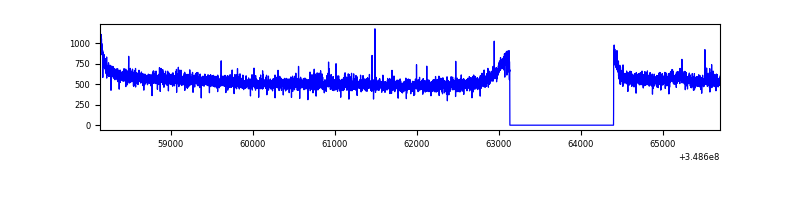 |
| B | 7557 | 6292 | 7 | 7 | 0.09% | 0.11% | 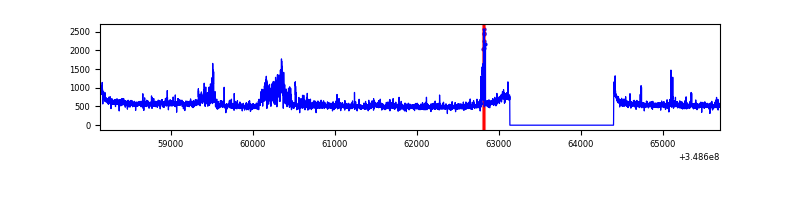 |
| C | 7557 | 6292 | 5 | 5 | 0.07% | 0.08% | 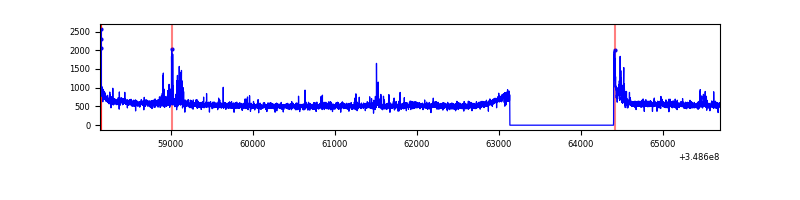 |
| D | 7557 | 6292 | 205 | 205 | 2.71% | 3.26% | 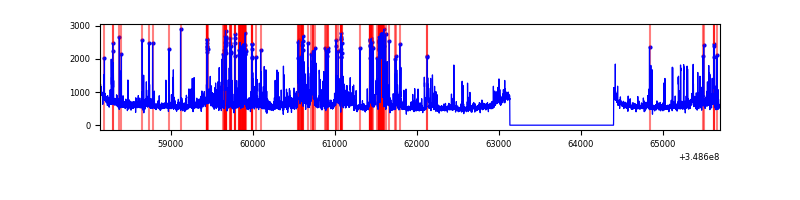 |
Top three noisy pixels from each quadrant. If the there are fewer than three noisy pixels in the level2.evt file, extra rows are filled as -1
| Pixel properties | Quadrant properties | ||||||
|---|---|---|---|---|---|---|---|
| Quadrant | DetID | PixID | Counts | Sigma | Mean | Median | Sigma |
| A | 13 | 6 | 14908 | 80.6 | 876 | 861 | 174.3 |
| A | 13 | 254 | 12009 | 63.96 | 876 | 861 | 174.3 |
| A | 14 | 239 | 8607 | 44.44 | 876 | 861 | 174.3 |
| B | 15 | 33 | 138582 | 862.44 | 854 | 836 | 159.7 |
| B | 10 | 245 | 106810 | 663.51 | 854 | 836 | 159.7 |
| B | 4 | 80 | 29870 | 181.78 | 854 | 836 | 159.7 |
| C | 14 | 238 | 154733 | 800.85 | 834 | 841 | 192.2 |
| C | 3 | 233 | 70190 | 360.89 | 834 | 841 | 192.2 |
| C | 10 | 22 | 57620 | 295.48 | 834 | 841 | 192.2 |
| D | 1 | 52 | 990952 | 4950.75 | 843 | 824 | 200.0 |
| D | 8 | 195 | 279896 | 1395.39 | 843 | 824 | 200.0 |
| D | 7 | 80 | 117869 | 585.24 | 843 | 824 | 200.0 |
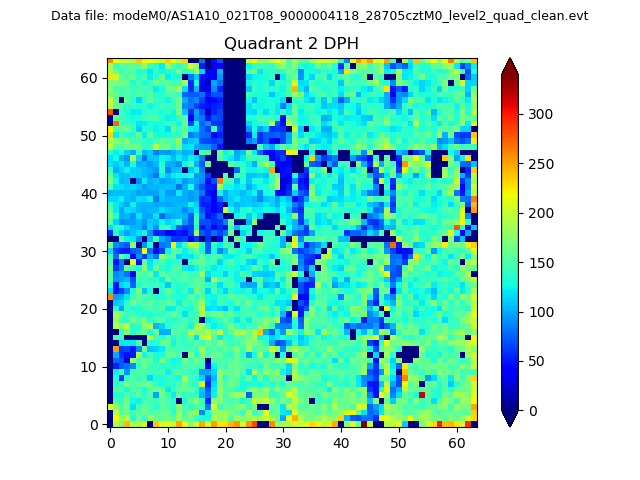
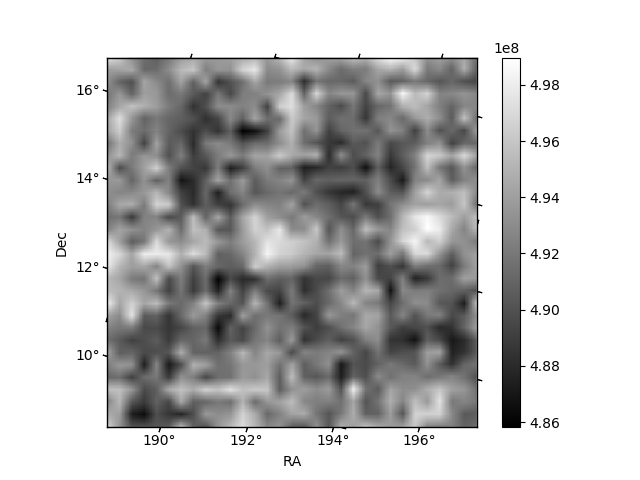
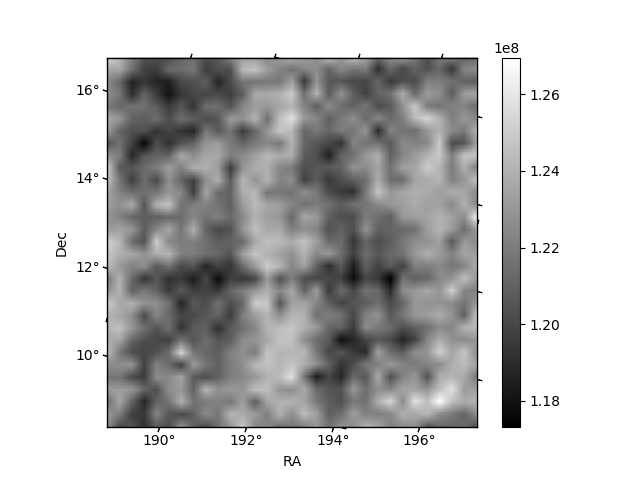
Histogram calculated using DETX and DETY for each event in the final _common_clean file
| Quadrant A | 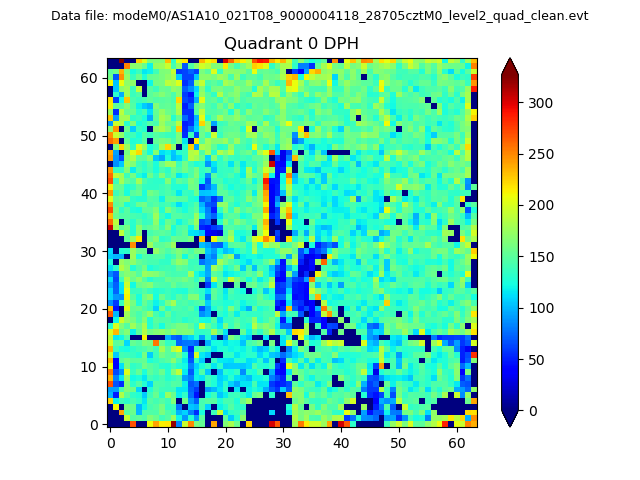 |
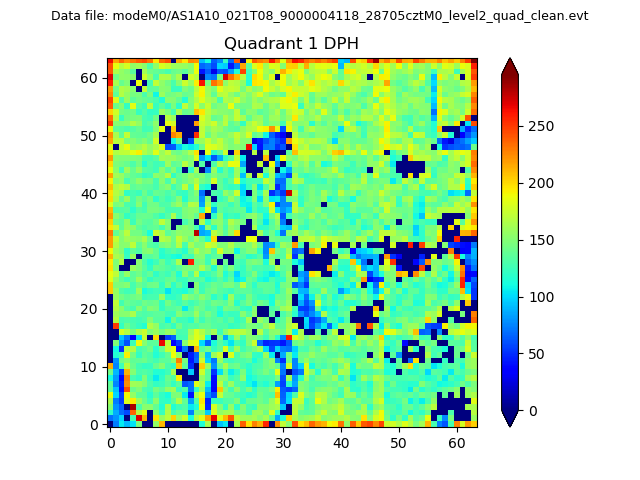 |
Quadrant B |
|---|---|---|---|
| Quadrant D | 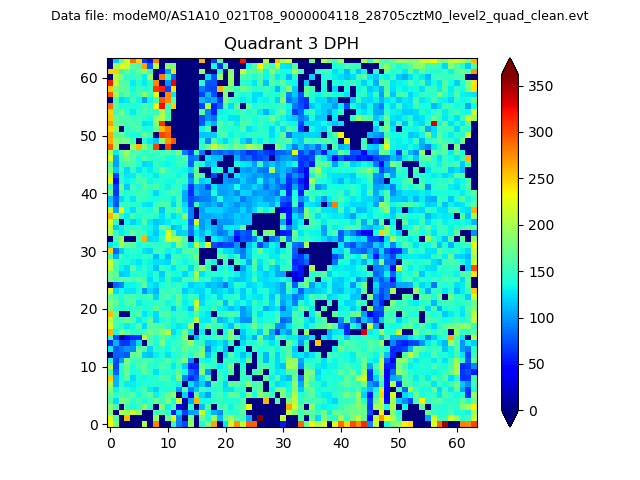 |
 |
Quadrant C |
| Plot type | Count rate plots | Images |
|---|---|---|
| Comparison with Poisson distribution Blue bars denote a histogram of data divided into 1 sec bins. Red curve is a Poisson curve with rate = median count rate of data. |
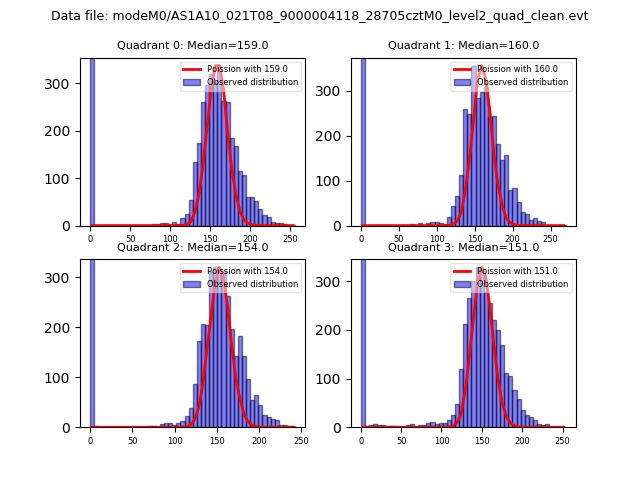 |
 |
| Quadrant-wise count rates Data is divided into 100 sec bins |
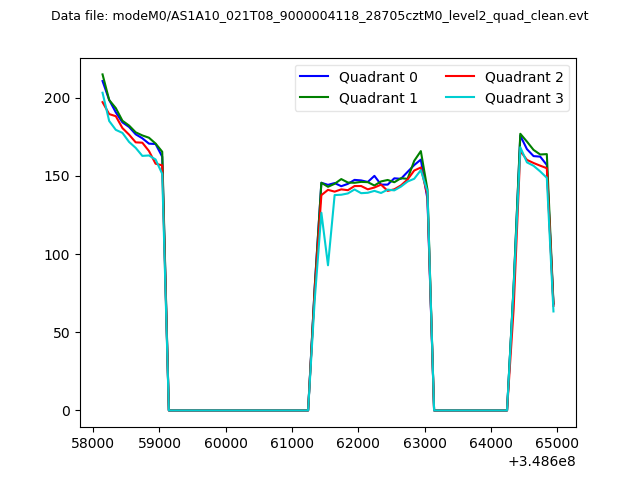 |
|
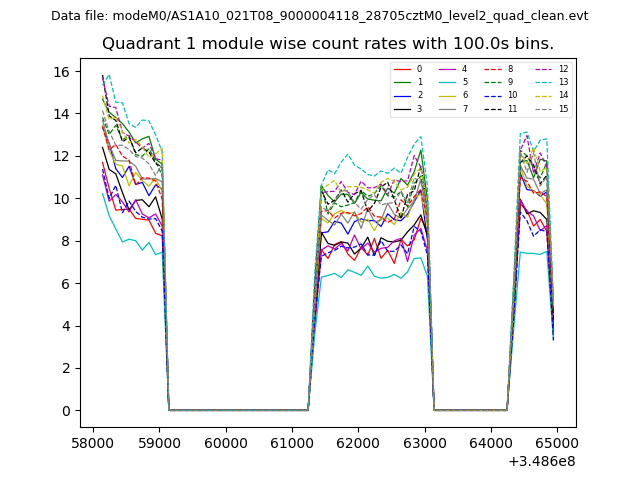
| Module-wise count rates for Quadrant A Data is divided into 100 sec bins |
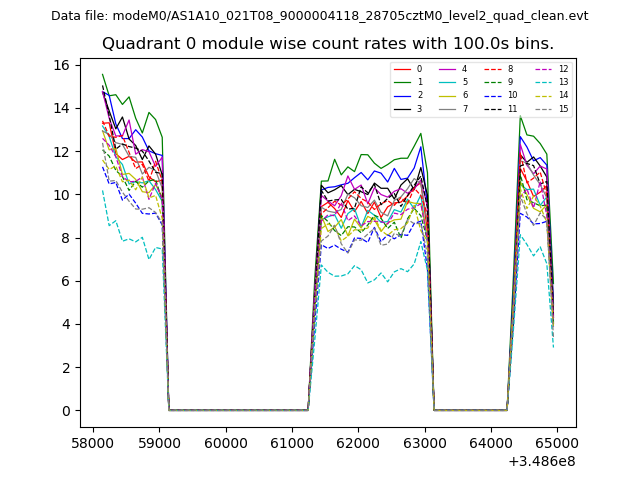 |
 |
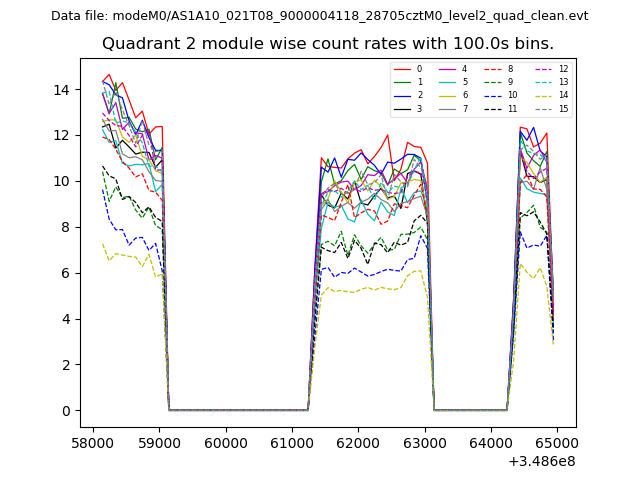
| Module-wise count rates for Quadrant B Data is divided into 100 sec bins |
 |
 |
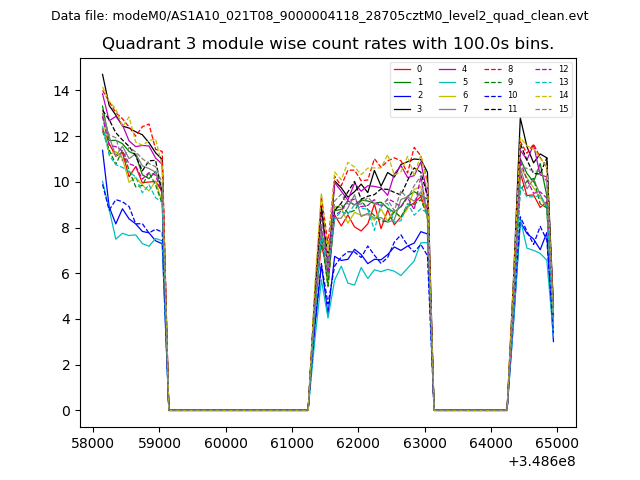
| Module-wise count rates for Quadrant C Data is divided into 100 sec bins |
 |
 |
| Module-wise count rates for Quadrant D Data is divided into 100 sec bins |
 |
 |
| Parameter | Plot |
|---|---|
| CZT HV Monitor | 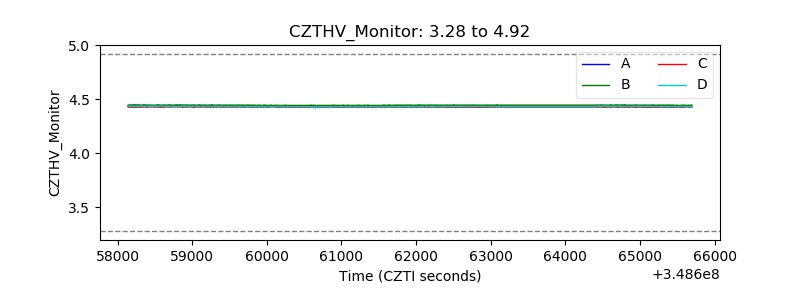 |
| D_VDD |  |
| Temperature 1 | 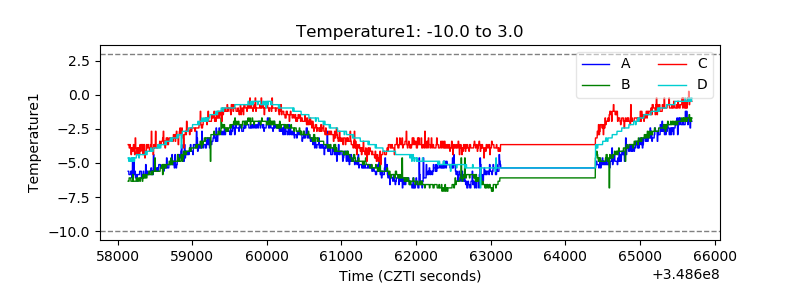 |
| Veto HV Monitor | 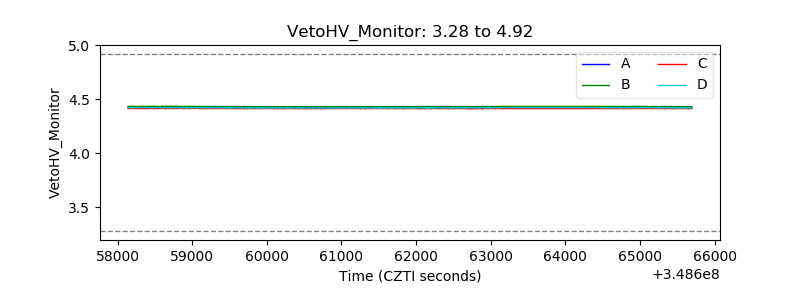 |
| Veto LLD | 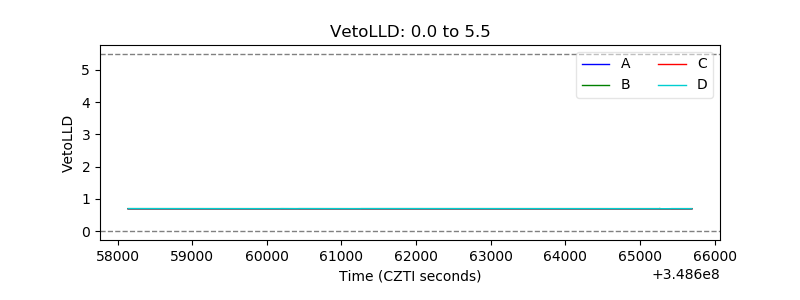 |
| Alpha Counter | 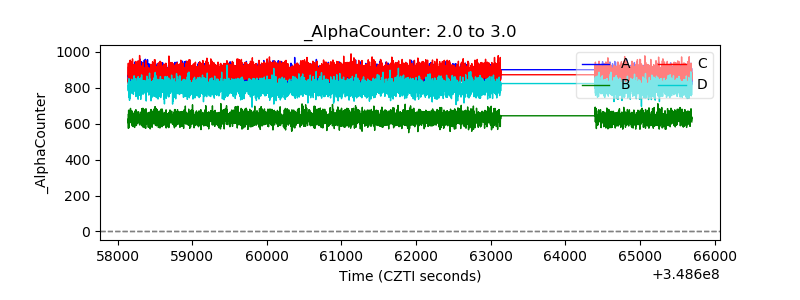 |
| _CPM_Rate | 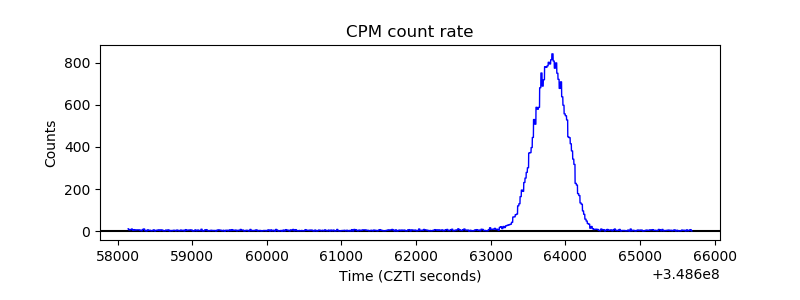 |
| CZT Counter | 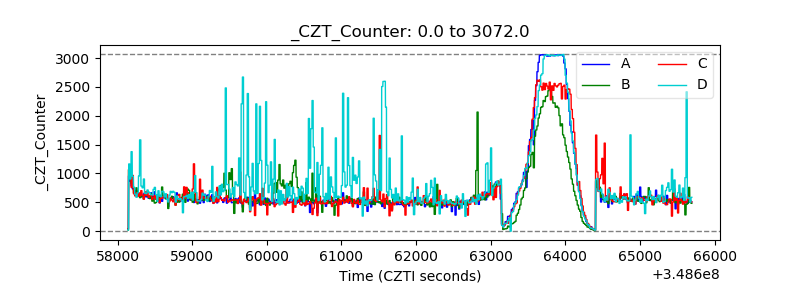 |
| +2.5 Volts monitor | 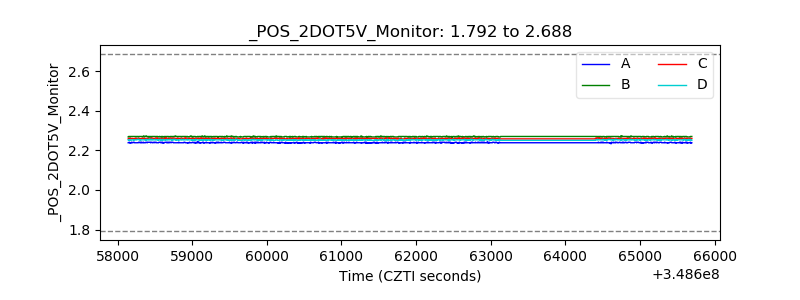 |
| +5 Volts monitor |  |
| _ROLL_ROT |  |
| _Roll_DEC |  |
| _Roll_RA | 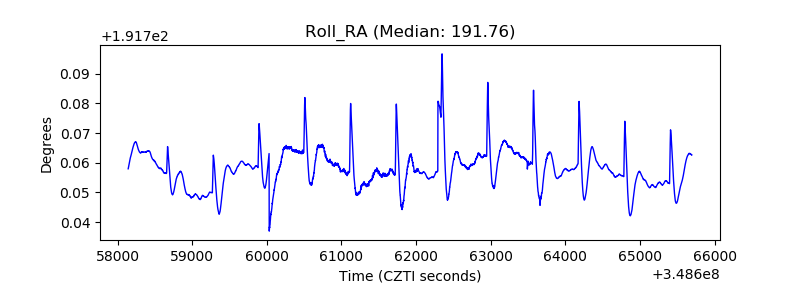 |
| Veto Counter |  |