| Param | Original file | Final file |
|---|---|---|
| Filename | modeM0/AS1A10_021T08_9000004118_28706cztM0_level2.evt | modeM0/AS1A10_021T08_9000004118_28706cztM0_level2_quad_clean.evt |
| Size (bytes) | 535,786,560 | 76,608,000 |
| Size | 511.0 MB | 73.1 MB |
| Events in quadrant A | 3,715,839 | 470,565 |
| Events in quadrant B | 3,789,836 | 475,720 |
| Events in quadrant C | 3,589,407 | 460,113 |
| Events in quadrant D | 4,679,861 | 449,205 |
| Mode M9 | |||
|---|---|---|---|
| Quadrant | BADHDUFLAG | Total packets | Discarded packets |
| A | 0 | 11 | 0 |
| B | 0 | 12 | 0 |
| C | 0 | 12 | 0 |
| D | 0 | 12 | 0 |
| Mode M0 | |||
|---|---|---|---|
| Quadrant | BADHDUFLAG | Total packets | Discarded packets |
| A | 0 | 14962 | 2 |
| B | 0 | 15169 | 2 |
| C | 0 | 14430 | 3 |
| D | 0 | 18313 | 2 |
| Mode SS | |||
|---|---|---|---|
| Quadrant | BADHDUFLAG | Total packets | Discarded packets |
| A | 0 | 134 | 0 |
| B | 0 | 134 | 0 |
| C | 0 | 134 | 0 |
| D | 0 | 134 | 0 |
| Quadrant | Total seconds | Saturated seconds | Saturation percentage |
|---|---|---|---|
| A | 6660 | 142 | 2.132132% |
| B | 6660 | 227 | 3.408408% |
| C | 6659 | 194 | 2.913350% |
| D | 6659 | 219 | 3.288782% |
Noise dominated data is calculated using 1-second bins in cleaned event files. If a bin has >2000 counts, and if more than 50% of those come from <1% of pixels, then it is considered to be noise-dominated and hence unusable.
| Quadrant | # 1 sec bins | Bins with >0 counts | Bins with >2000 counts | High rate bins dominated by noise | Noise dominated (total time) | Noise dominated (detector-on time) | Marked lightcurve |
|---|---|---|---|---|---|---|---|
| A | 7610 | 6660 | 21 | 21 | 0.28% | 0.32% | 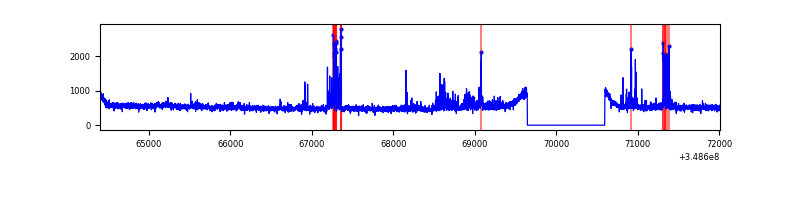 |
| B | 7610 | 6660 | 103 | 103 | 1.35% | 1.55% | 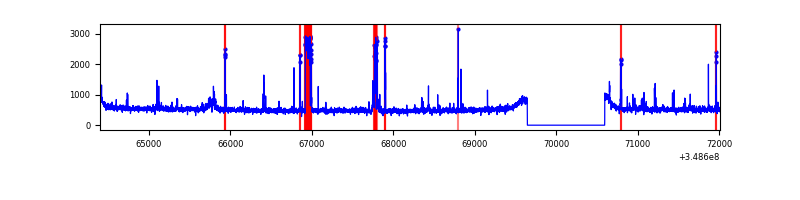 |
| C | 7609 | 6659 | 1 | 1 | 0.01% | 0.02% | 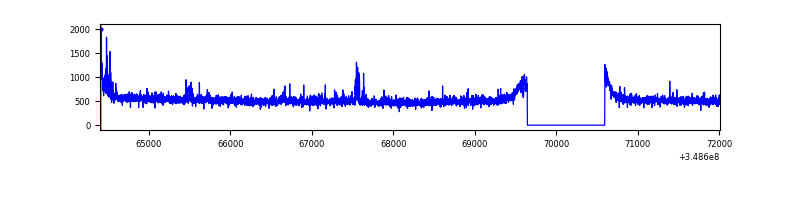 |
| D | 7609 | 6659 | 120 | 120 | 1.58% | 1.80% | 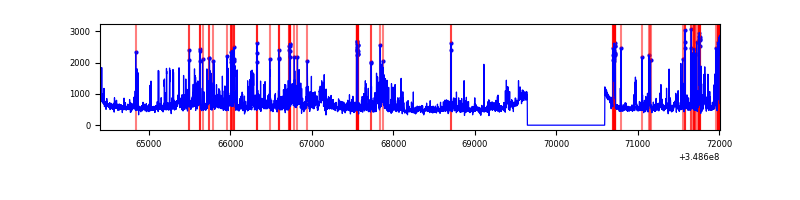 |
Top three noisy pixels from each quadrant. If the there are fewer than three noisy pixels in the level2.evt file, extra rows are filled as -1
| Pixel properties | Quadrant properties | ||||||
|---|---|---|---|---|---|---|---|
| Quadrant | DetID | PixID | Counts | Sigma | Mean | Median | Sigma |
| A | 14 | 254 | 166891 | 940.2 | 885 | 867 | 176.6 |
| A | 4 | 2 | 83546 | 468.21 | 885 | 867 | 176.6 |
| A | 13 | 6 | 30397 | 167.23 | 885 | 867 | 176.6 |
| B | 4 | 80 | 327841 | 1979.75 | 862 | 843 | 165.2 |
| B | 15 | 33 | 31459 | 185.36 | 862 | 843 | 165.2 |
| B | 0 | 190 | 21664 | 126.06 | 862 | 843 | 165.2 |
| C | 14 | 238 | 150464 | 752.08 | 850 | 855 | 198.9 |
| C | 3 | 233 | 76819 | 381.87 | 850 | 855 | 198.9 |
| C | 14 | 254 | 24362 | 118.17 | 850 | 855 | 198.9 |
| D | 1 | 52 | 786089 | 3855.87 | 856 | 832 | 203.7 |
| D | 8 | 195 | 358263 | 1755.1 | 856 | 832 | 203.7 |
| D | 2 | 250 | 89460 | 435.19 | 856 | 832 | 203.7 |
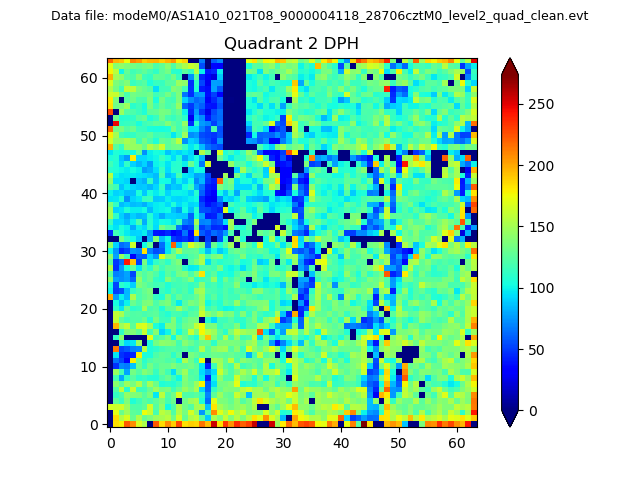
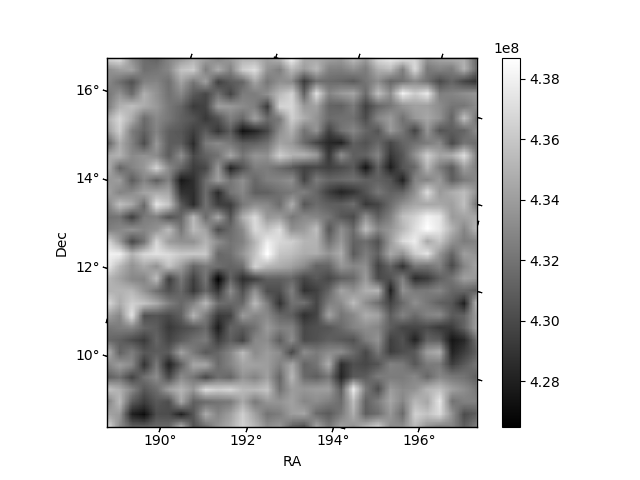
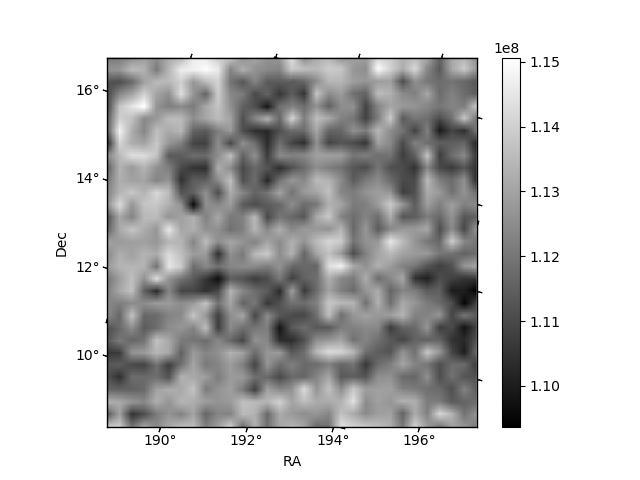
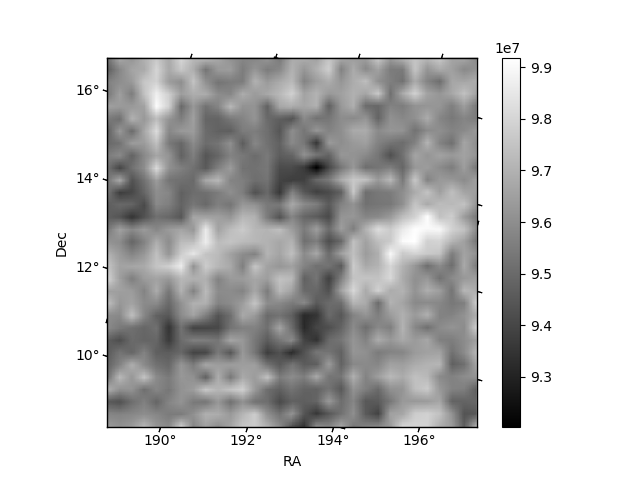
Histogram calculated using DETX and DETY for each event in the final _common_clean file
| Quadrant A | 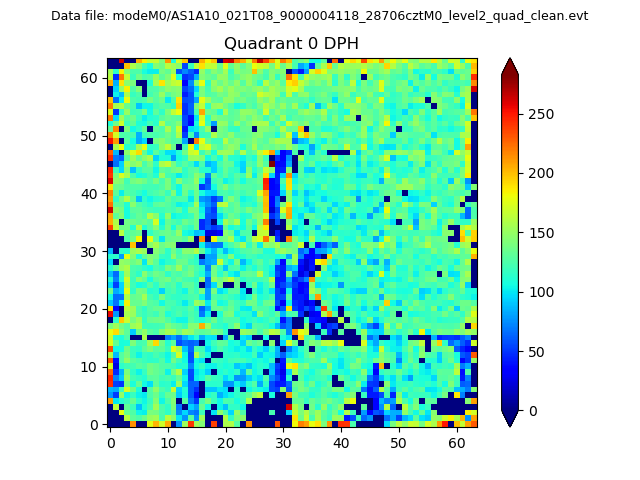 |
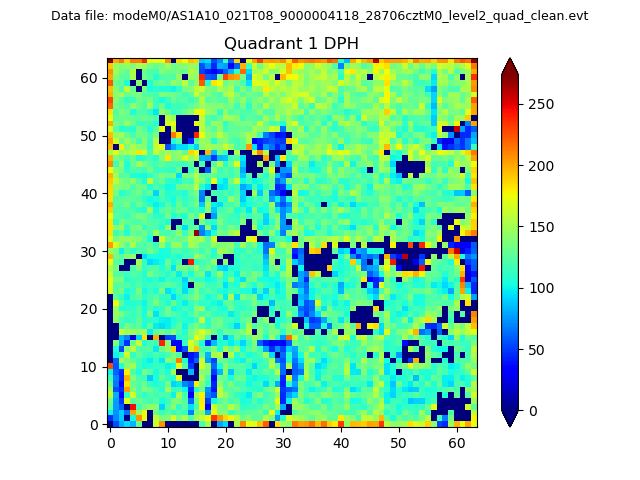 |
Quadrant B |
|---|---|---|---|
| Quadrant D | 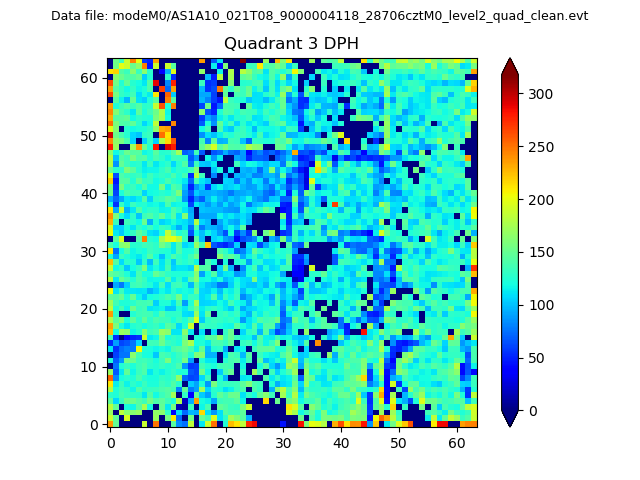 |
 |
Quadrant C |
| Plot type | Count rate plots | Images |
|---|---|---|
| Comparison with Poisson distribution Blue bars denote a histogram of data divided into 1 sec bins. Red curve is a Poisson curve with rate = median count rate of data. |
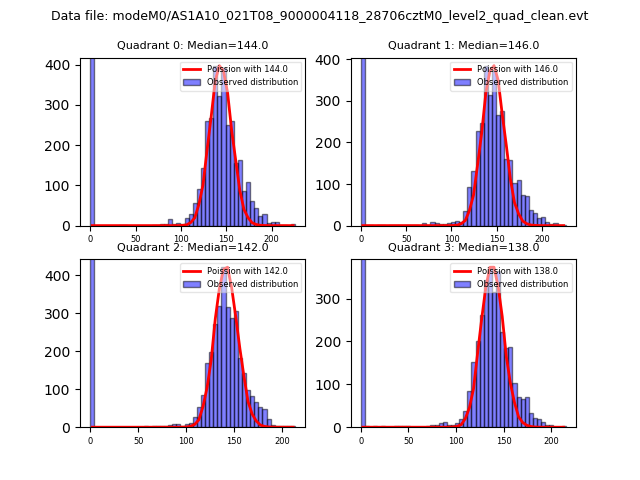 |
 |
| Quadrant-wise count rates Data is divided into 100 sec bins |
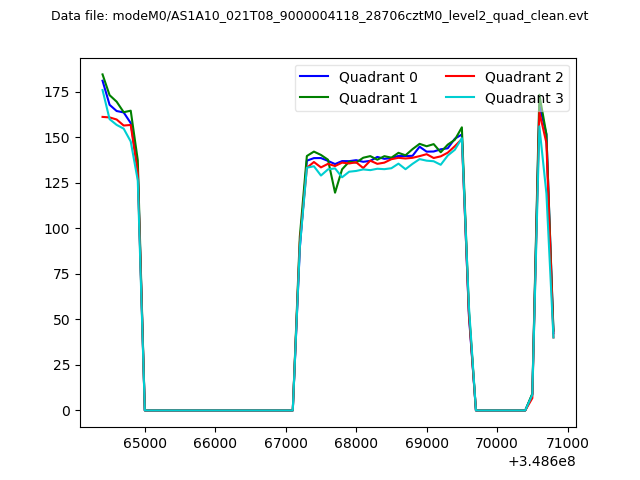 |
|
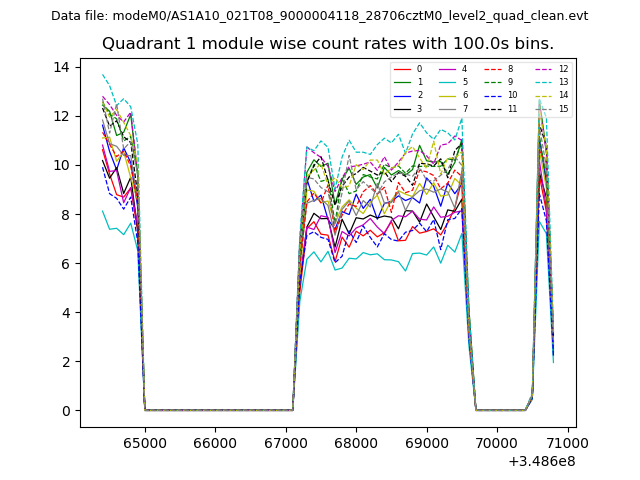
| Module-wise count rates for Quadrant A Data is divided into 100 sec bins |
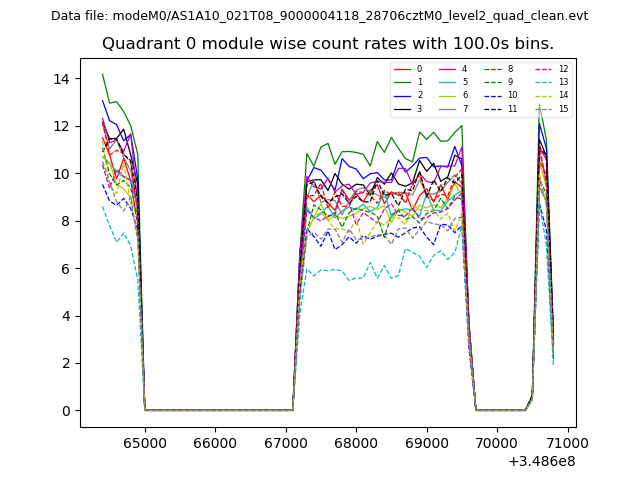 |
 |
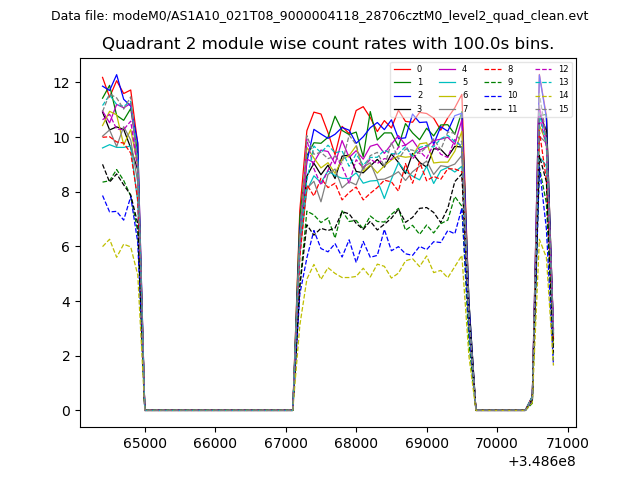
| Module-wise count rates for Quadrant B Data is divided into 100 sec bins |
 |
 |
| Module-wise count rates for Quadrant C Data is divided into 100 sec bins |
 |
 |
| Module-wise count rates for Quadrant D Data is divided into 100 sec bins |
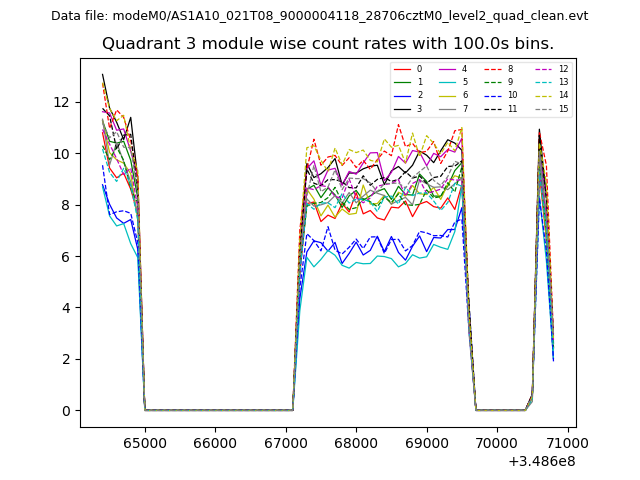 |
 |
| Parameter | Plot |
|---|---|
| CZT HV Monitor | 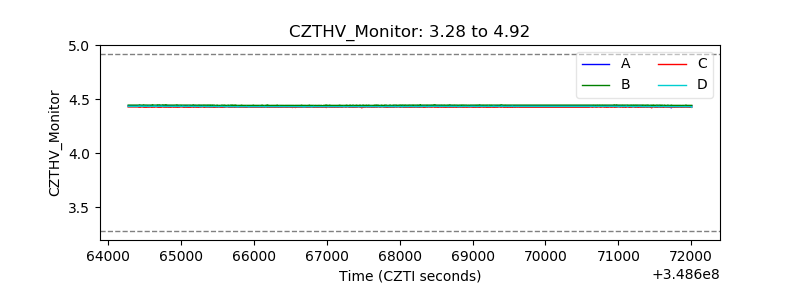 |
| D_VDD |  |
| Temperature 1 | 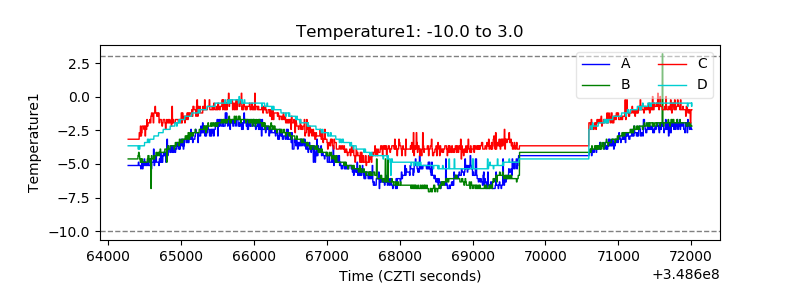 |
| Veto HV Monitor | 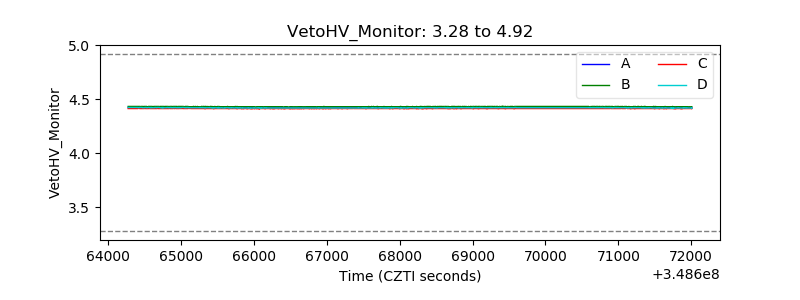 |
| Veto LLD | 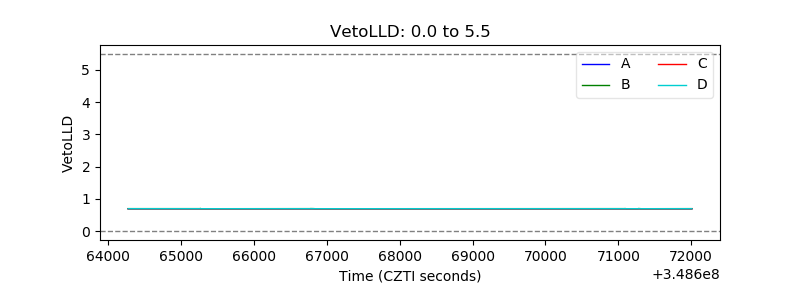 |
| Alpha Counter | 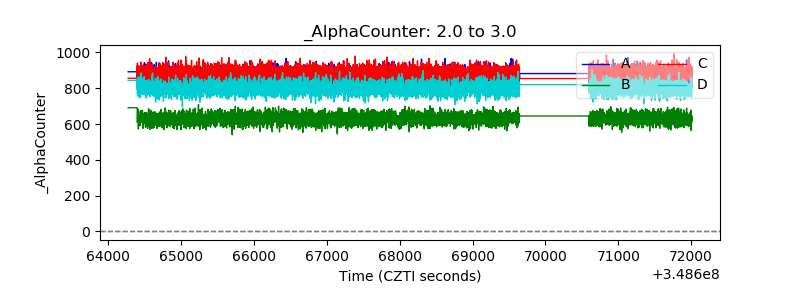 |
| _CPM_Rate | 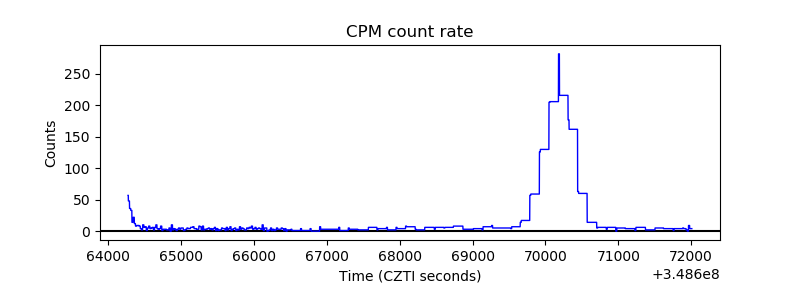 |
| CZT Counter | 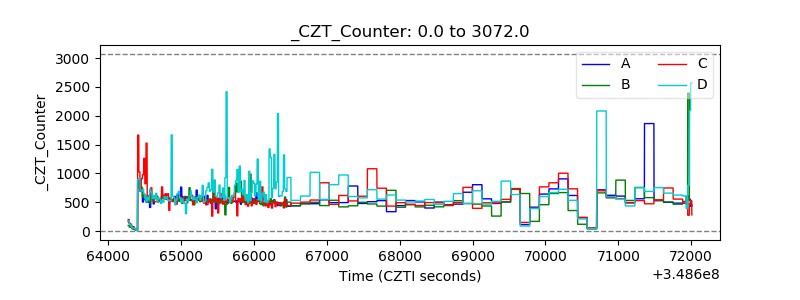 |
| +2.5 Volts monitor |  |
| +5 Volts monitor |  |
| _ROLL_ROT | 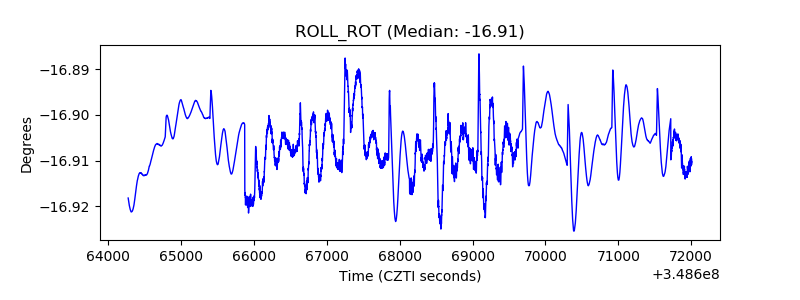 |
| _Roll_DEC | 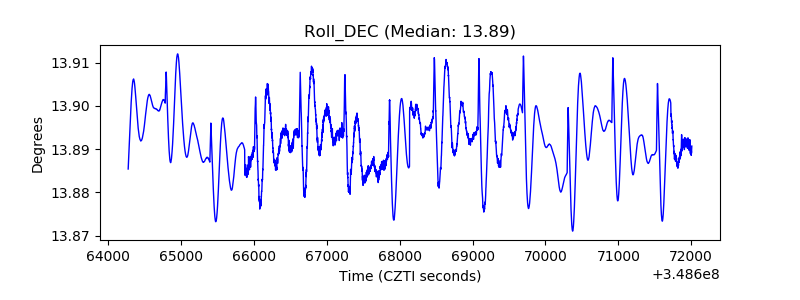 |
| _Roll_RA | 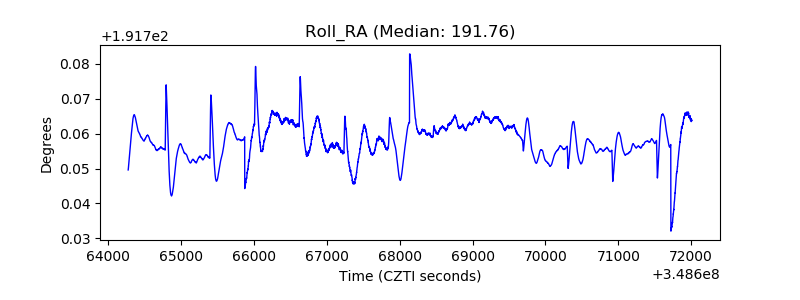 |
| Veto Counter | 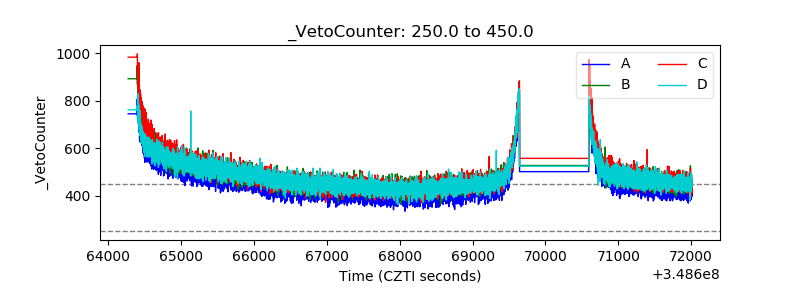 |