| Param | Original file | Final file |
|---|---|---|
| Filename | modeM0/AS1A10_021T08_9000004118_28707cztM0_level2.evt | modeM0/AS1A10_021T08_9000004118_28707cztM0_level2_quad_clean.evt |
| Size (bytes) | 268,770,240 | 24,618,240 |
| Size | 256.3 MB | 23.5 MB |
| Events in quadrant A | 1,668,780 | 132,639 |
| Events in quadrant B | 1,701,853 | 134,527 |
| Events in quadrant C | 1,644,115 | 129,556 |
| Events in quadrant D | 2,905,157 | 119,495 |
| Mode M9 | |||
|---|---|---|---|
| Quadrant | BADHDUFLAG | Total packets | Discarded packets |
| A | 0 | 4 | 0 |
| B | 0 | 5 | 0 |
| C | 0 | 5 | 0 |
| D | 0 | 5 | 0 |
| Mode M0 | |||
|---|---|---|---|
| Quadrant | BADHDUFLAG | Total packets | Discarded packets |
| A | 0 | 6910 | 1 |
| B | 0 | 6999 | 1 |
| C | 0 | 6741 | 1 |
| D | 0 | 10862 | 1 |
| Mode SS | |||
|---|---|---|---|
| Quadrant | BADHDUFLAG | Total packets | Discarded packets |
| A | 0 | 64 | 0 |
| B | 0 | 64 | 0 |
| C | 0 | 64 | 0 |
| D | 0 | 64 | 0 |
| Quadrant | Total seconds | Saturated seconds | Saturation percentage |
|---|---|---|---|
| A | 3215 | 38 | 1.181960% |
| B | 3215 | 58 | 1.804044% |
| C | 3215 | 55 | 1.710731% |
| D | 3215 | 287 | 8.926905% |
Noise dominated data is calculated using 1-second bins in cleaned event files. If a bin has >2000 counts, and if more than 50% of those come from <1% of pixels, then it is considered to be noise-dominated and hence unusable.
| Quadrant | # 1 sec bins | Bins with >0 counts | Bins with >2000 counts | High rate bins dominated by noise | Noise dominated (total time) | Noise dominated (detector-on time) | Marked lightcurve |
|---|---|---|---|---|---|---|---|
| A | 3215 | 3215 | 8 | 8 | 0.25% | 0.25% | 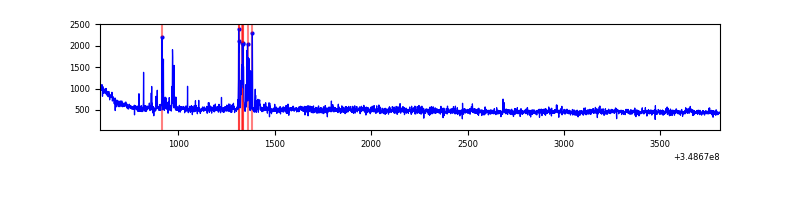 |
| B | 3215 | 3215 | 16 | 16 | 0.50% | 0.50% | 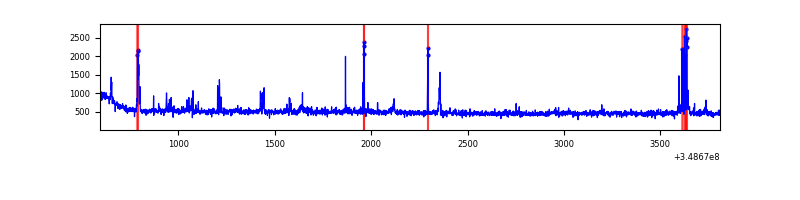 |
| C | 3215 | 3215 | 0 | 0 | 0.00% | 0.00% | 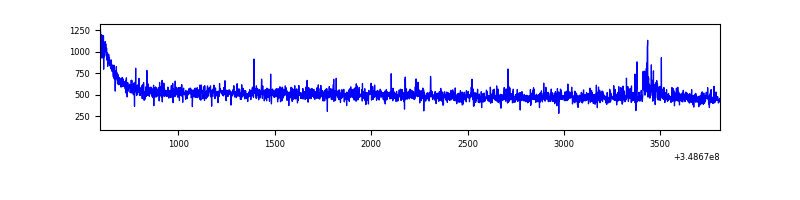 |
| D | 3215 | 3215 | 259 | 259 | 8.06% | 8.06% | 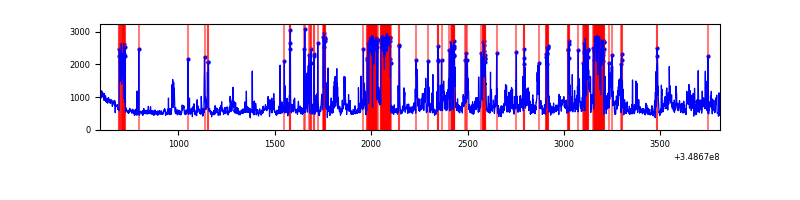 |
Top three noisy pixels from each quadrant. If the there are fewer than three noisy pixels in the level2.evt file, extra rows are filled as -1
| Pixel properties | Quadrant properties | ||||||
|---|---|---|---|---|---|---|---|
| Quadrant | DetID | PixID | Counts | Sigma | Mean | Median | Sigma |
| A | 14 | 254 | 72114 | 856.46 | 410 | 402 | 83.7 |
| A | 13 | 254 | 5786 | 64.3 | 410 | 402 | 83.7 |
| A | 13 | 6 | 4546 | 49.49 | 410 | 402 | 83.7 |
| B | 4 | 80 | 99256 | 1261.97 | 404 | 395 | 78.3 |
| B | 0 | 190 | 11991 | 148.02 | 404 | 395 | 78.3 |
| B | 12 | 111 | 9402 | 114.98 | 404 | 395 | 78.3 |
| C | 14 | 238 | 67451 | 714.61 | 394 | 397 | 93.8 |
| C | 10 | 22 | 16323 | 169.73 | 394 | 397 | 93.8 |
| C | 3 | 233 | 15082 | 156.5 | 394 | 397 | 93.8 |
| D | 1 | 52 | 1018972 | 10926.55 | 384 | 374 | 93.2 |
| D | 8 | 195 | 221914 | 2376.47 | 384 | 374 | 93.2 |
| D | 12 | 233 | 84334 | 900.64 | 384 | 374 | 93.2 |
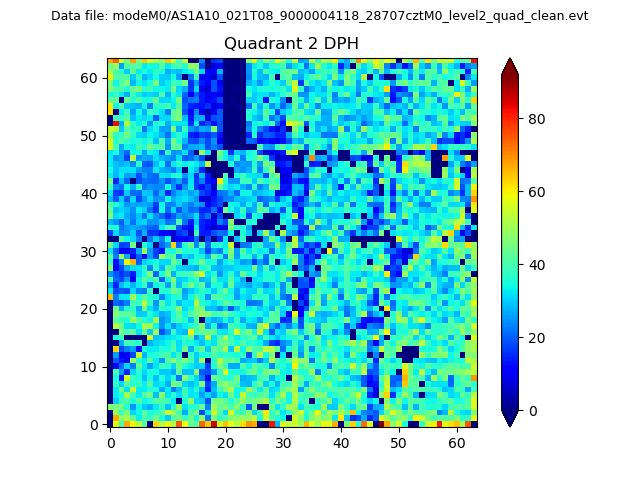
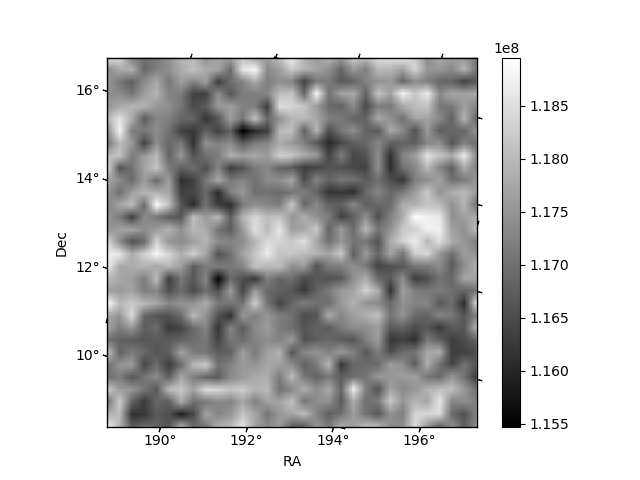
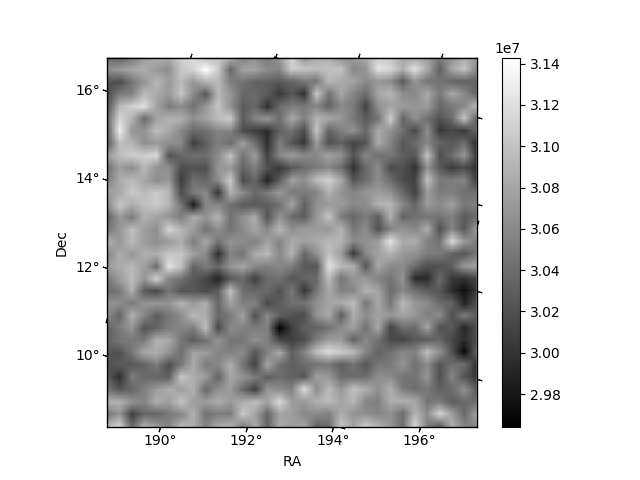
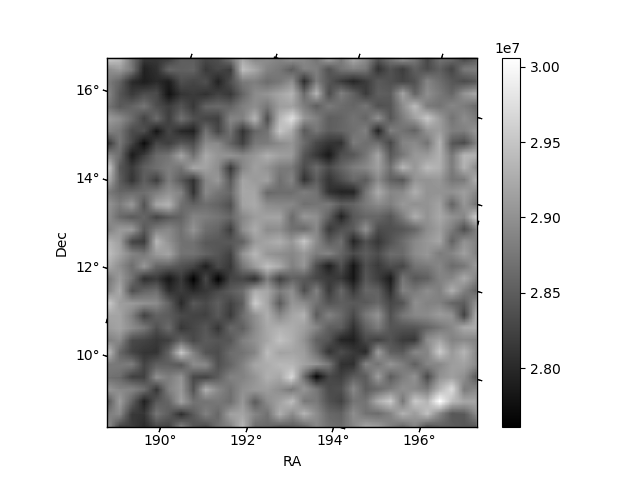
Histogram calculated using DETX and DETY for each event in the final _common_clean file
| Quadrant A | 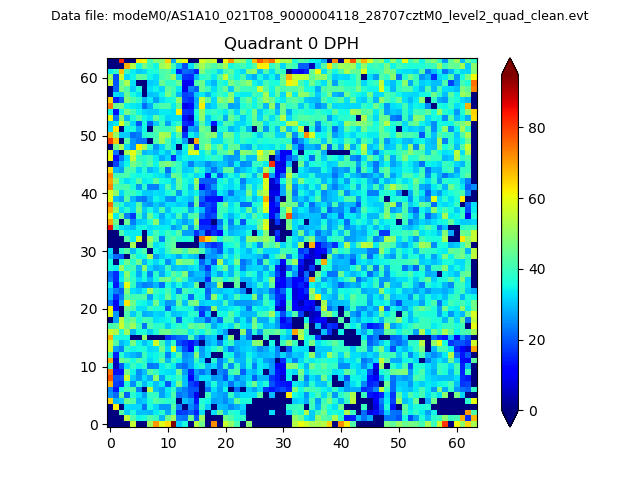 |
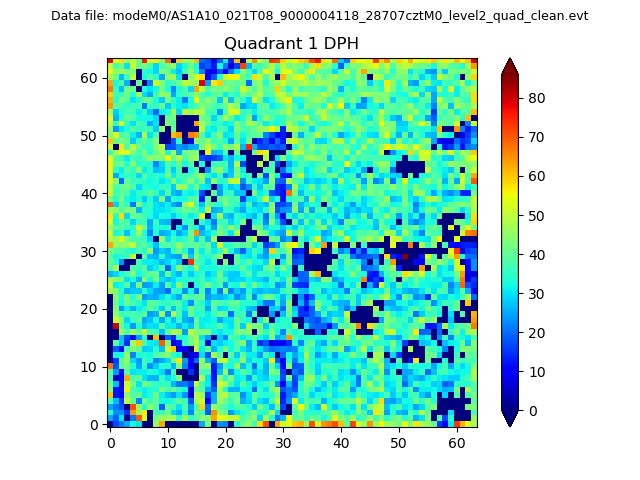 |
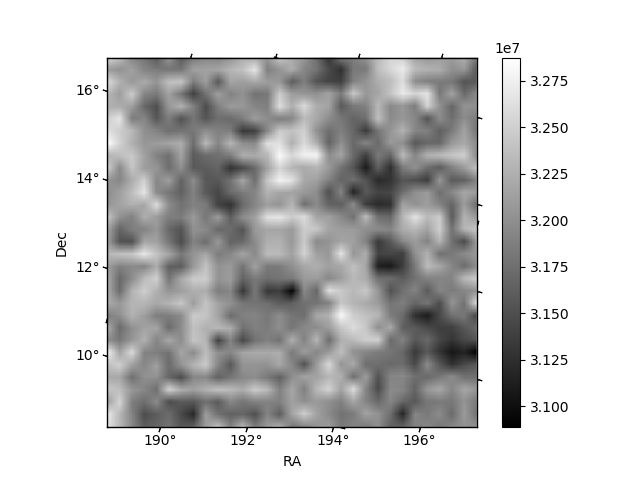
Quadrant B |
|---|---|---|---|
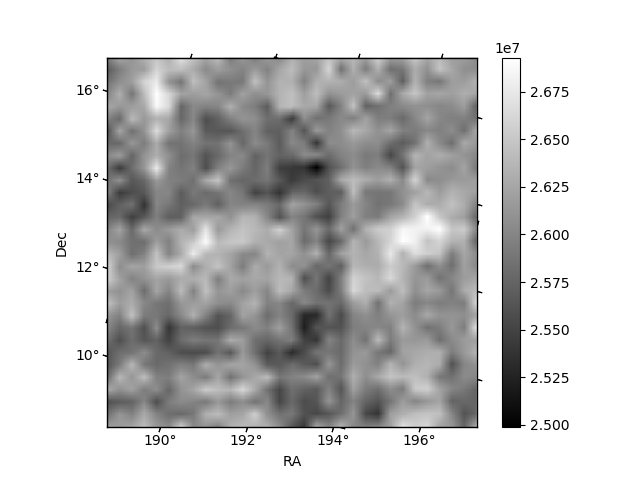
| Quadrant D | 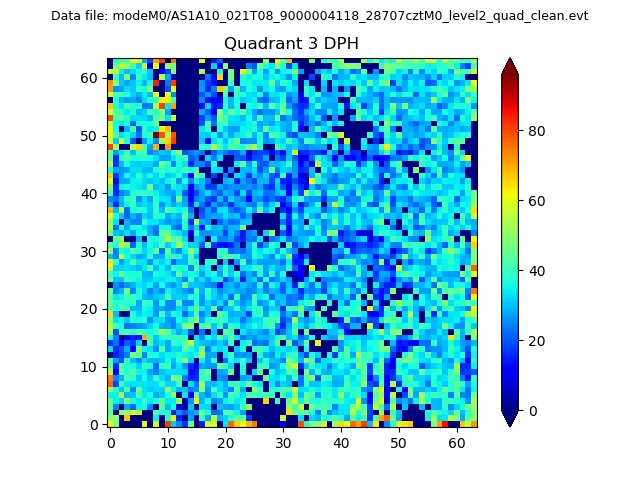 |
 |
Quadrant C |
| Plot type | Count rate plots | Images |
|---|---|---|
| Comparison with Poisson distribution Blue bars denote a histogram of data divided into 1 sec bins. Red curve is a Poisson curve with rate = median count rate of data. |
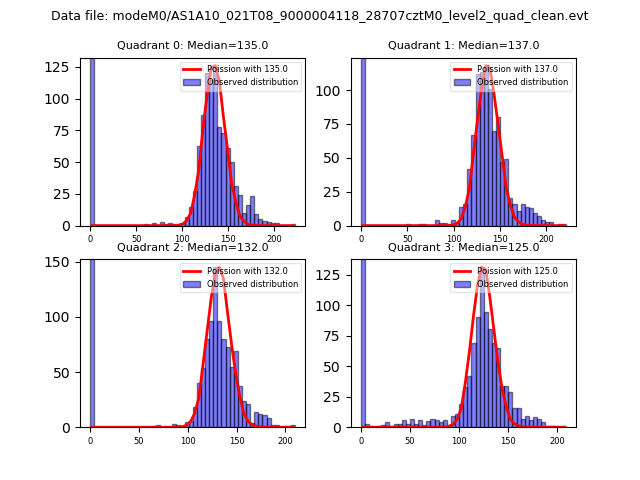 |
 |
| Quadrant-wise count rates Data is divided into 100 sec bins |
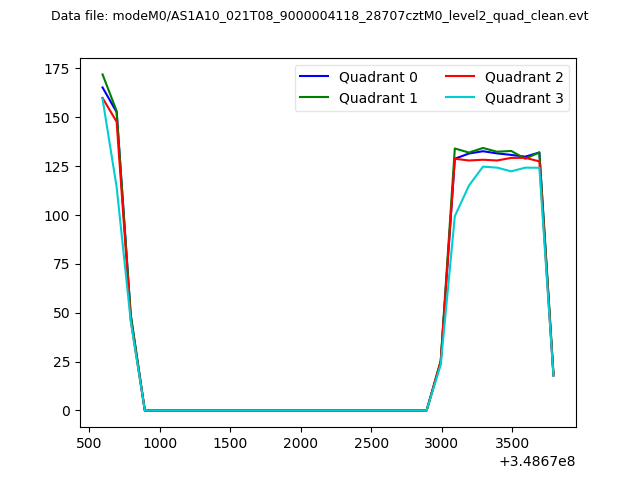 |
|
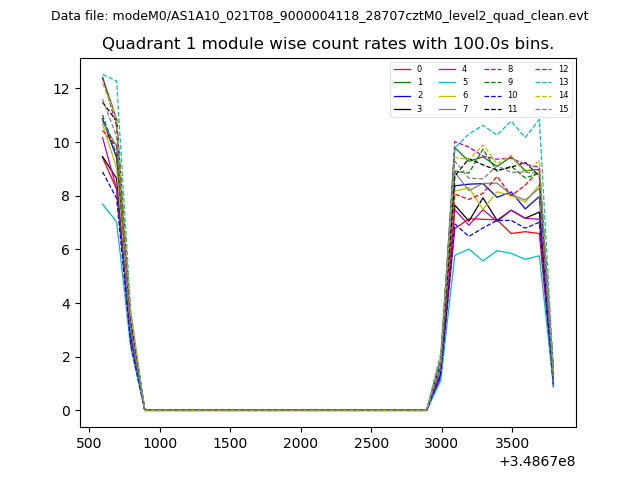
| Module-wise count rates for Quadrant A Data is divided into 100 sec bins |
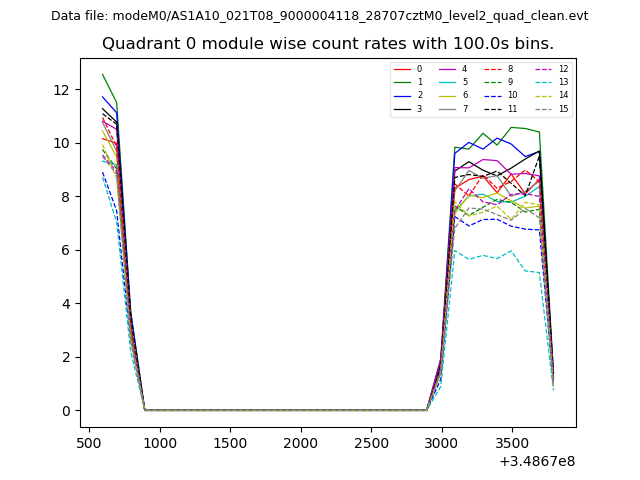 |
 |
| Module-wise count rates for Quadrant B Data is divided into 100 sec bins |
 |
 |
| Module-wise count rates for Quadrant C Data is divided into 100 sec bins |
 |
 |
| Module-wise count rates for Quadrant D Data is divided into 100 sec bins |
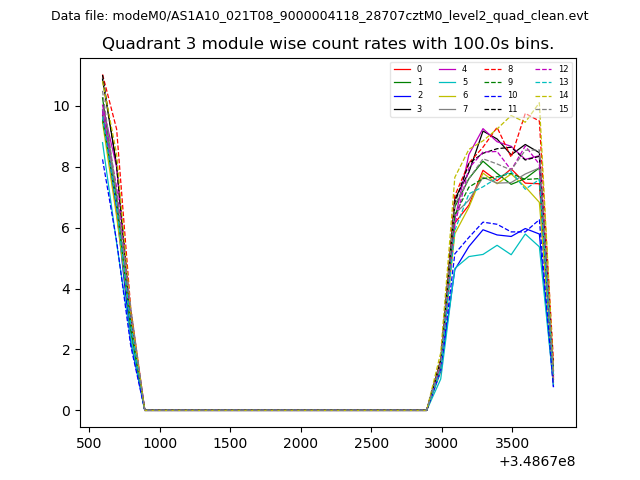 |
 |
| Parameter | Plot |
|---|---|
| CZT HV Monitor | 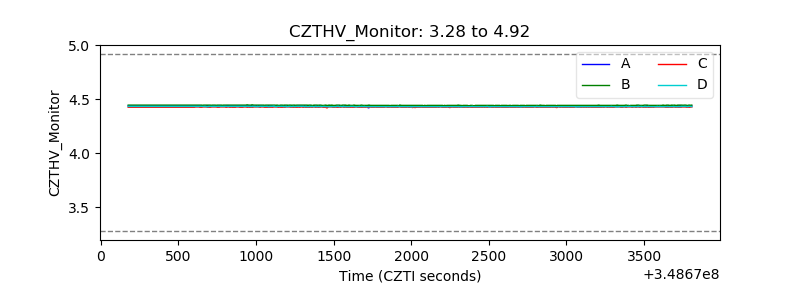 |
| D_VDD | 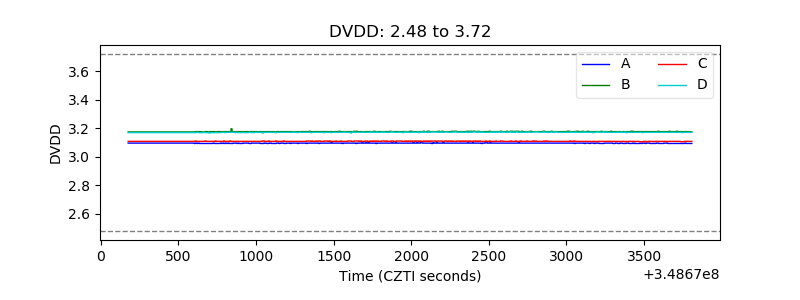 |
| Temperature 1 | 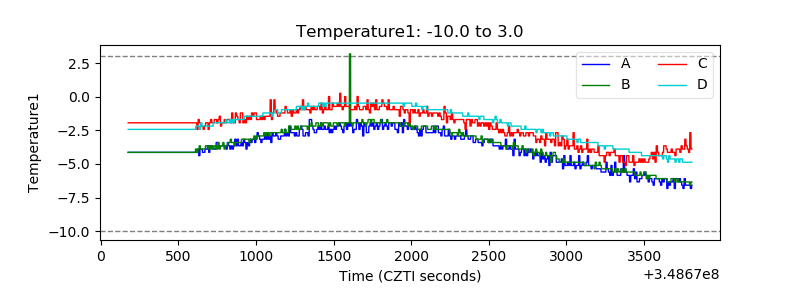 |
| Veto HV Monitor | 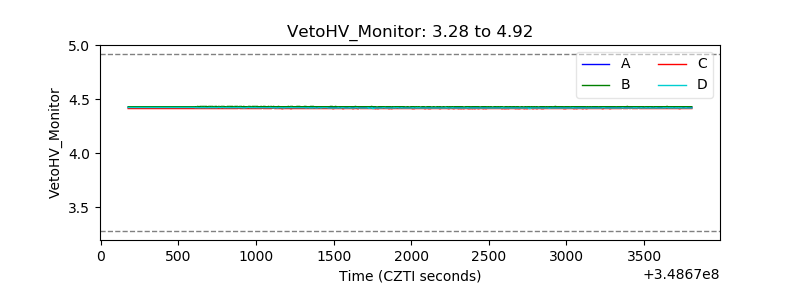 |
| Veto LLD | 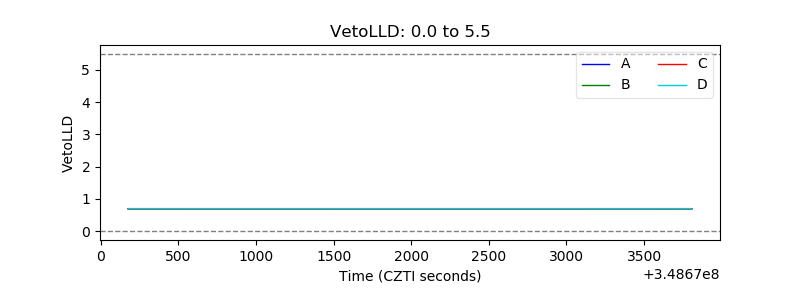 |
| Alpha Counter | 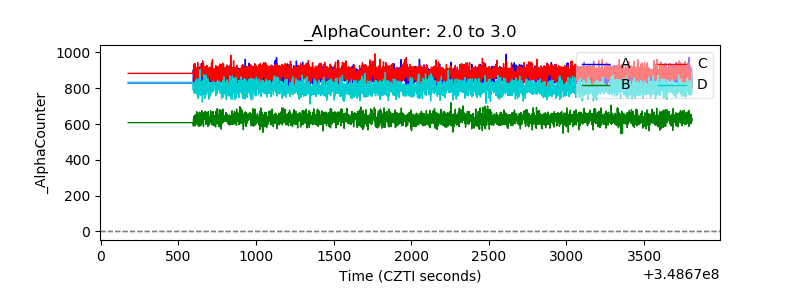 |
| _CPM_Rate | 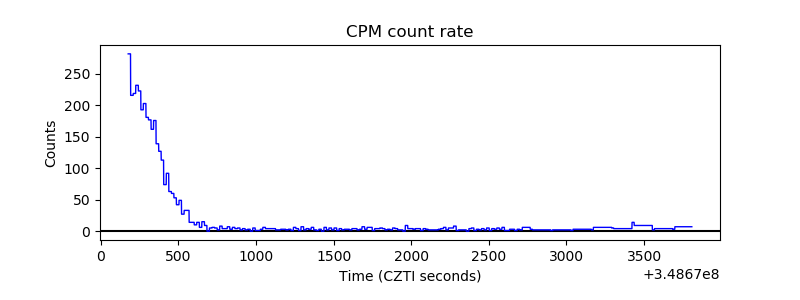 |
| CZT Counter | 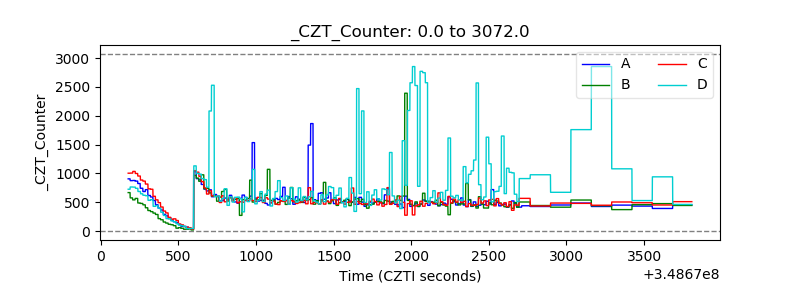 |
| +2.5 Volts monitor |  |
| +5 Volts monitor |  |
| _ROLL_ROT | 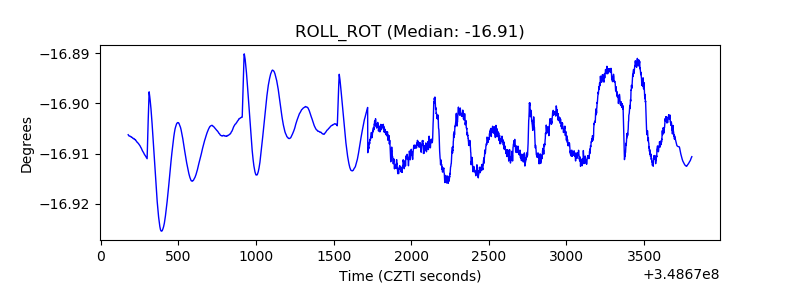 |
| _Roll_DEC | 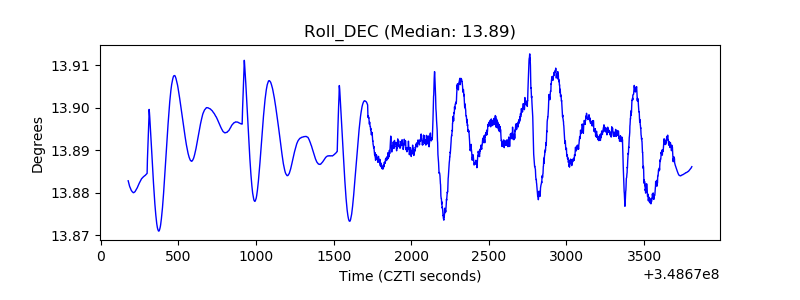 |
| _Roll_RA | 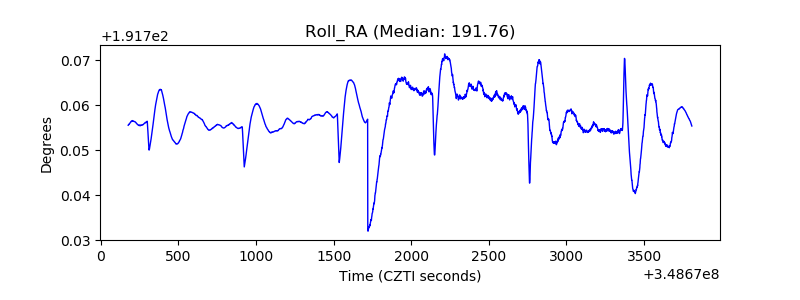 |
| Veto Counter | 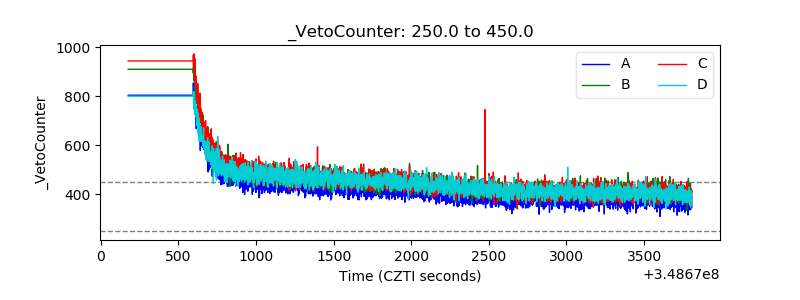 |