| Param | Original file | Final file |
|---|---|---|
| Filename | modeM0/AS1A10_123T03_9000004120cztM0_level2.fits | modeM0/AS1A10_123T03_9000004120cztM0_level2_quad_clean.evt |
| Size (bytes) | 603,466,560 | 460,028,160 |
| Size | 575.5 MB | 438.7 MB |
| Events in quadrant A | 3,773,276 | 2,545,678 |
| Events in quadrant B | 3,580,166 | 2,569,709 |
| Events in quadrant C | 3,644,256 | 2,440,164 |
| Events in quadrant D | 3,142,956 | 2,240,624 |
| Mode M0 | |||
|---|---|---|---|
| Quadrant | BADHDUFLAG | Total packets | Discarded packets |
| A | 0 | 128949 | 0 |
| B | 0 | 127294 | 0 |
| C | 0 | 131075 | 0 |
| D | 0 | 169852 | 0 |
| Mode SS | |||
|---|---|---|---|
| Quadrant | BADHDUFLAG | Total packets | Discarded packets |
| A | 0 | 1230 | 0 |
| B | 0 | 1230 | 0 |
| C | 0 | 1230 | 0 |
| D | 0 | 1230 | 0 |
| Mode M9 | |||
|---|---|---|---|
| Quadrant | BADHDUFLAG | Total packets | Discarded packets |
| A | 0 | 88 | 0 |
| B | 0 | 88 | 0 |
| C | 0 | 88 | 0 |
| D | 0 | 88 | 0 |
| Quadrant | Total seconds | Saturated seconds | Saturation percentage |
|---|---|---|---|
| A | 60276 | 892 | 1.479859% |
| B | 60276 | 775 | 1.285752% |
| C | 60276 | 1491 | 2.473621% |
| D | 60276 | 3469 | 5.755193% |
Noise dominated data is calculated using 1-second bins in cleaned event files. If a bin has >2000 counts, and if more than 50% of those come from <1% of pixels, then it is considered to be noise-dominated and hence unusable.
| Quadrant | # 1 sec bins | Bins with >0 counts | Bins with >2000 counts | High rate bins dominated by noise | Noise dominated (total time) | Noise dominated (detector-on time) | Marked lightcurve |
|---|---|---|---|---|---|---|---|
| A | 69007 | 60266 | 0 | 0 | 0.00% | 0.00% | 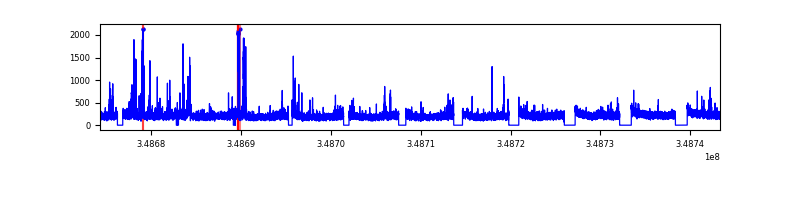 |
| B | 69007 | 60264 | 0 | 0 | 0.00% | 0.00% | 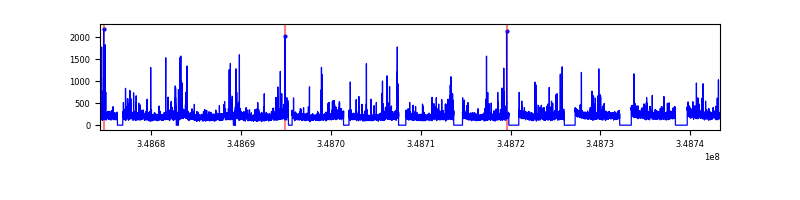 |
| C | 69007 | 60250 | 0 | 0 | 0.00% | 0.00% | 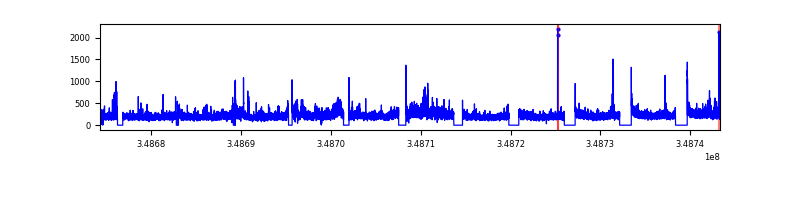 |
| D | 69006 | 60244 | 0 | 0 | 0.00% | 0.00% | 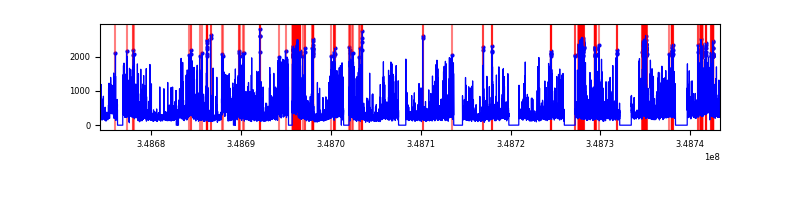 |
Top three noisy pixels from each quadrant. If the there are fewer than three noisy pixels in the level2.evt file, extra rows are filled as -1
| Pixel properties | Quadrant properties | ||||||
|---|---|---|---|---|---|---|---|
| Quadrant | DetID | PixID | Counts | Sigma | Mean | Median | Sigma |
| A | 0 | 29 | 3544 | 11.01 | 983 | 927 | 237.7 |
| A | 7 | 110 | 2930 | 8.43 | 983 | 927 | 237.7 |
| A | 9 | 19 | 2766 | 7.74 | 983 | 927 | 237.7 |
| B | 2 | 9 | 2956 | 11.16 | 947 | 906 | 183.7 |
| B | 5 | 232 | 2386 | 8.06 | 947 | 906 | 183.7 |
| B | 2 | 8 | 2377 | 8.01 | 947 | 906 | 183.7 |
| C | 1 | 80 | 2793 | 7.72 | 963 | 903 | 244.9 |
| C | 1 | 81 | 2735 | 7.48 | 963 | 903 | 244.9 |
| C | 3 | 187 | 2486 | 6.46 | 963 | 903 | 244.9 |
| D | 15 | 46 | 2402 | 6.64 | 899 | 822 | 238.0 |
| D | 7 | 3 | 2291 | 6.17 | 899 | 822 | 238.0 |
| D | 6 | 67 | 2238 | 5.95 | 899 | 822 | 238.0 |
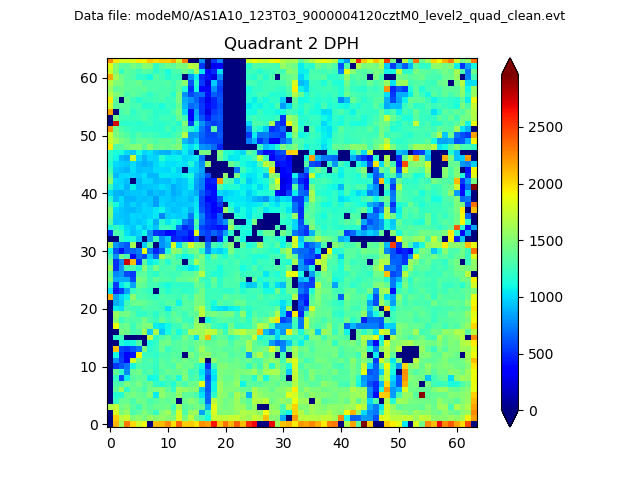
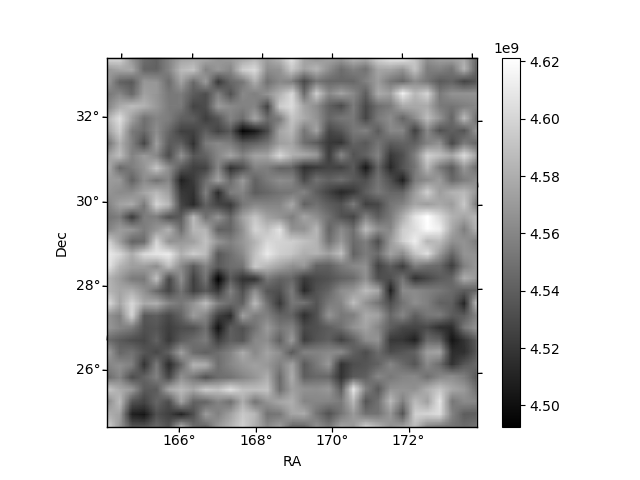
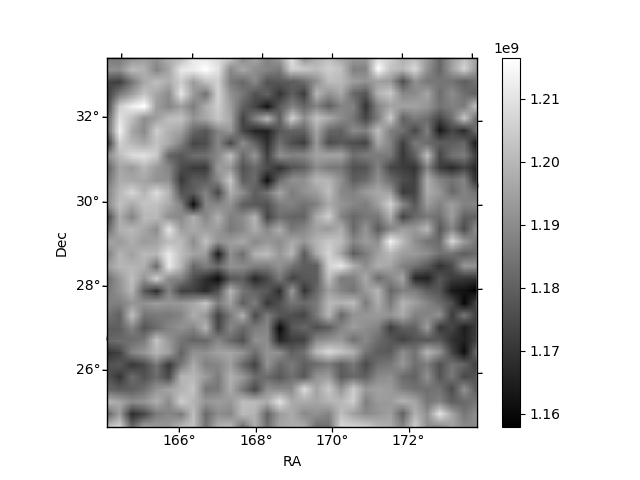
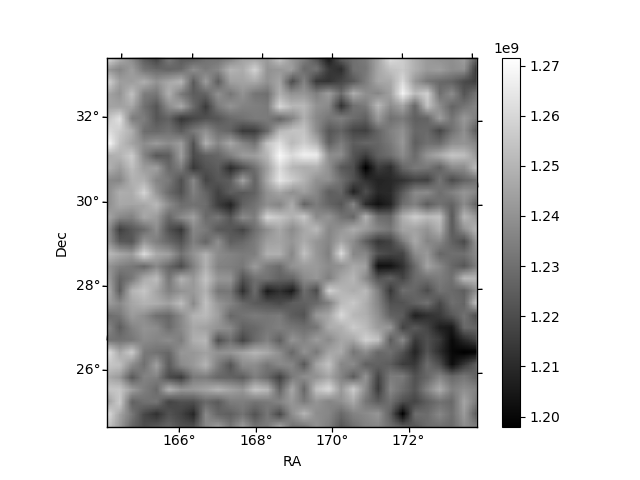
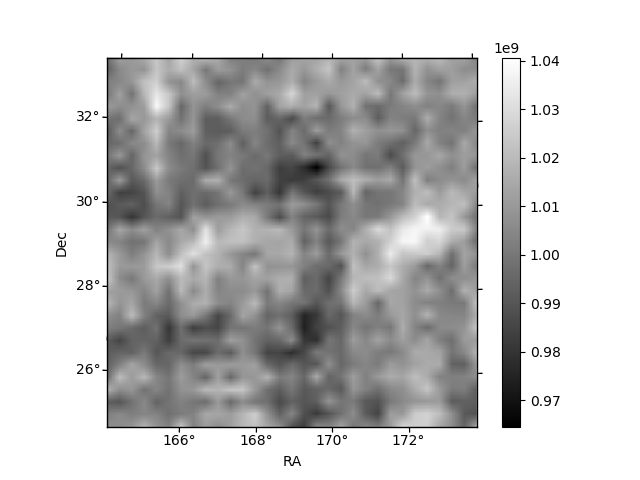
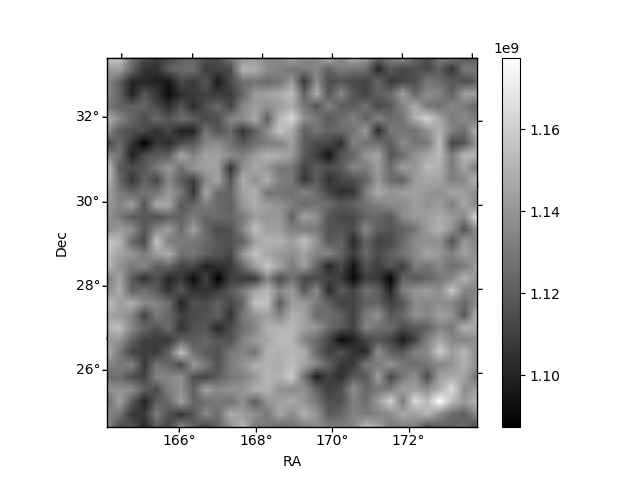
Histogram calculated using DETX and DETY for each event in the final _common_clean file
| Quadrant A | 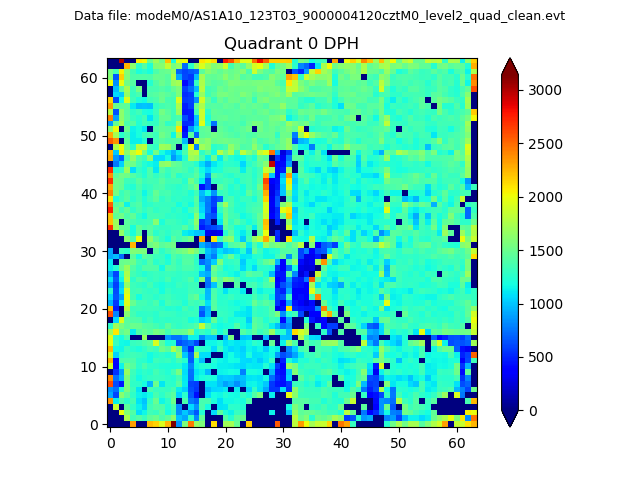 |
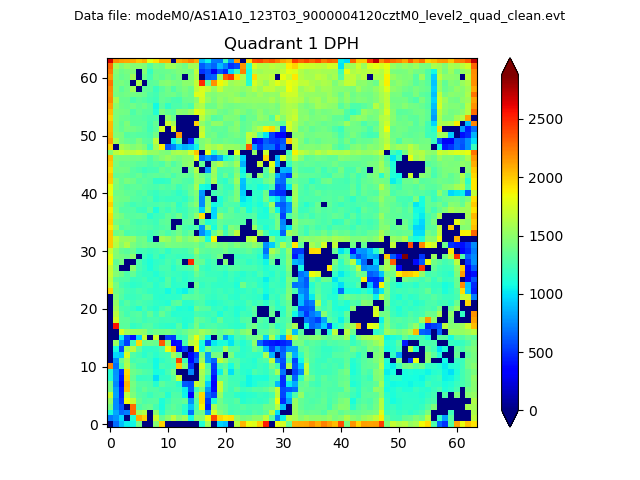 |
Quadrant B |
|---|---|---|---|
| Quadrant D | 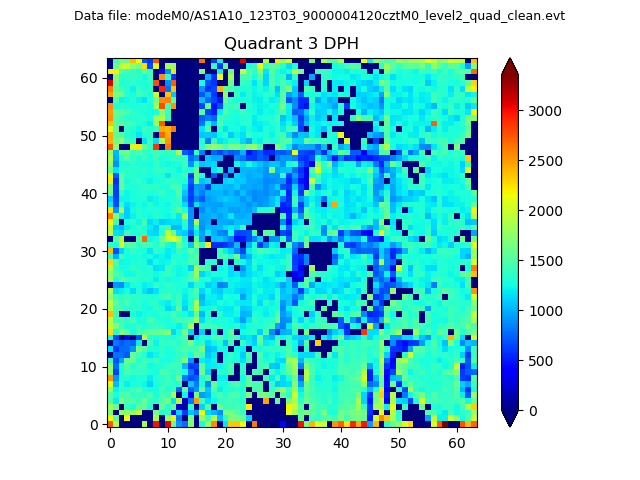 |
 |
Quadrant C |
| Plot type | Count rate plots | Images |
|---|---|---|
| Comparison with Poisson distribution Blue bars denote a histogram of data divided into 1 sec bins. Red curve is a Poisson curve with rate = median count rate of data. |
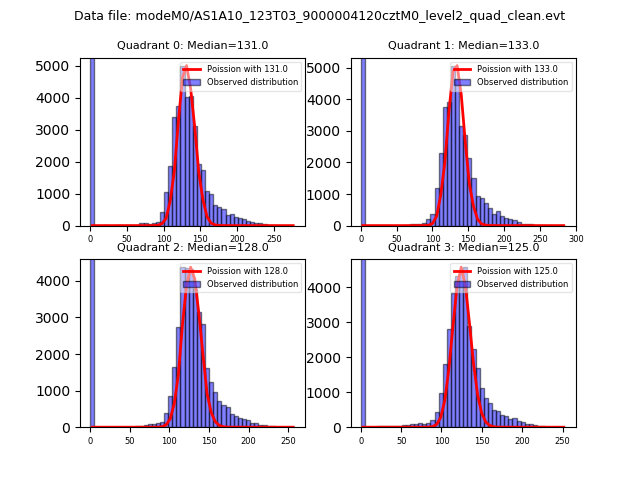 |
 |
| Quadrant-wise count rates Data is divided into 100 sec bins |
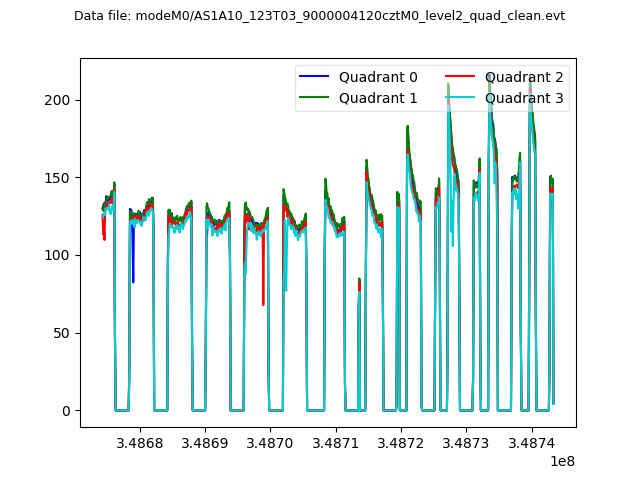 |
|
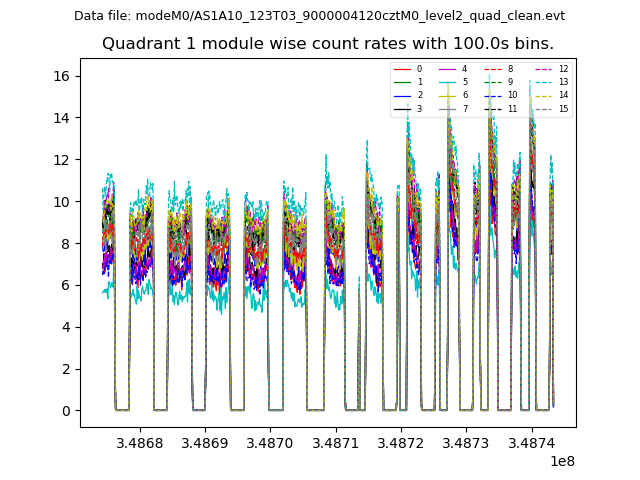
| Module-wise count rates for Quadrant A Data is divided into 100 sec bins |
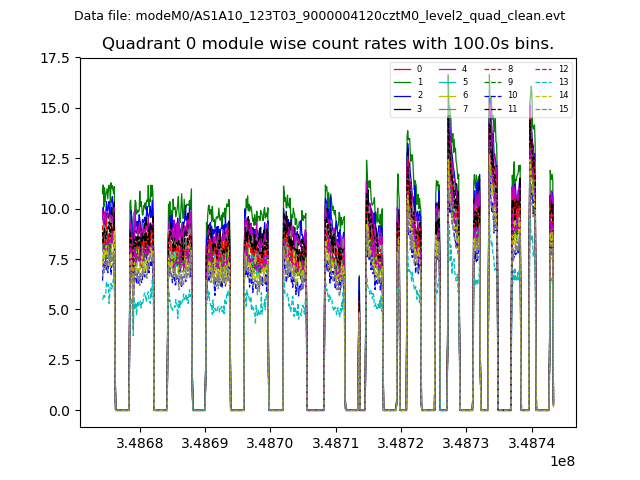 |
 |
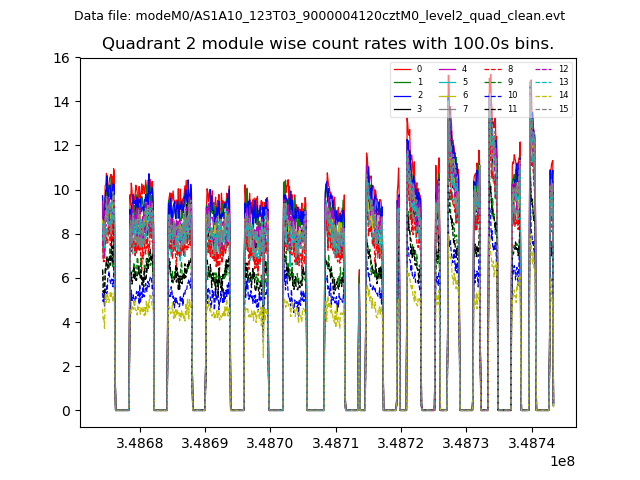
| Module-wise count rates for Quadrant B Data is divided into 100 sec bins |
 |
 |
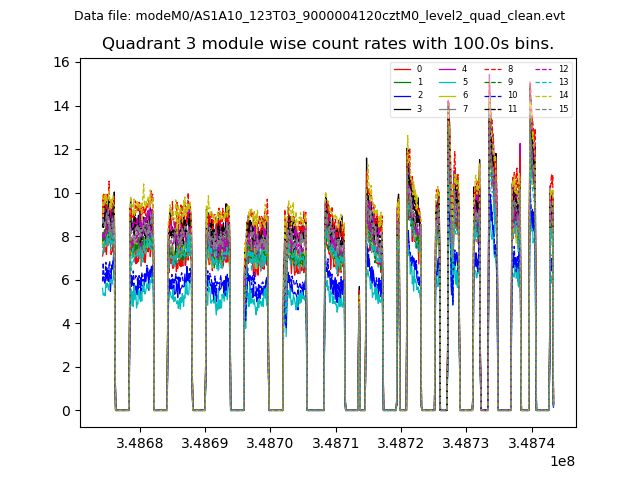
| Module-wise count rates for Quadrant C Data is divided into 100 sec bins |
 |
 |
| Module-wise count rates for Quadrant D Data is divided into 100 sec bins |
 |
 |
| Parameter | Plot |
|---|---|
| CZT HV Monitor | 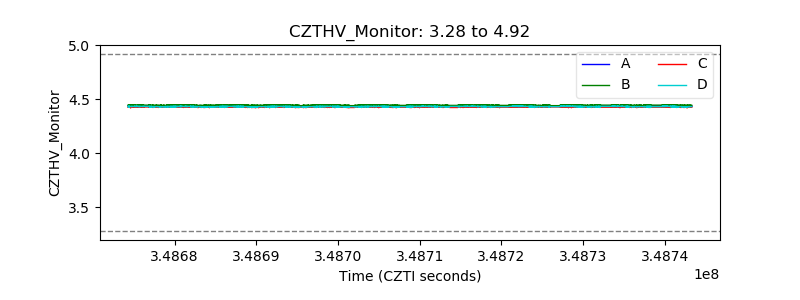 |
| D_VDD | 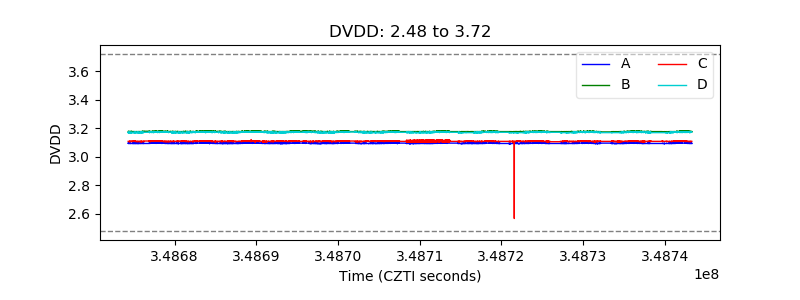 |
| Temperature 1 | 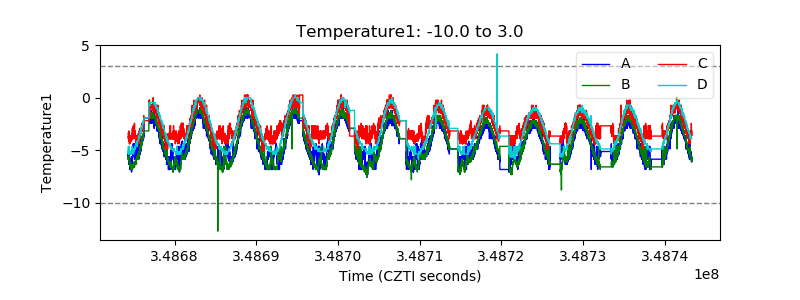 |
| Veto HV Monitor | 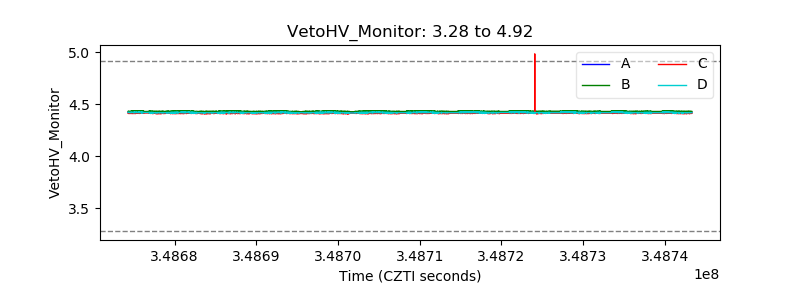 |
| Veto LLD | 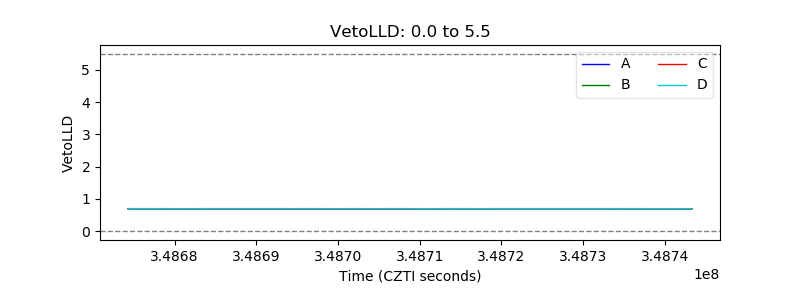 |
| Alpha Counter | 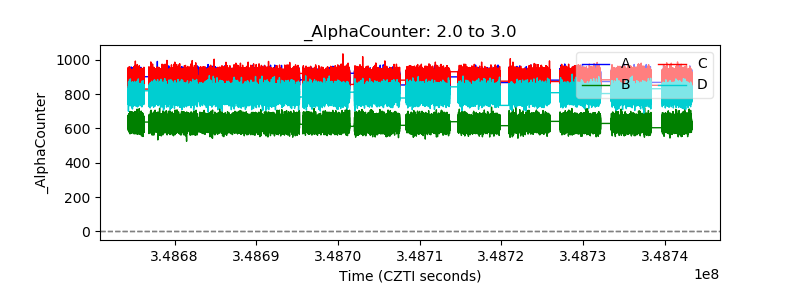 |
| _CPM_Rate | 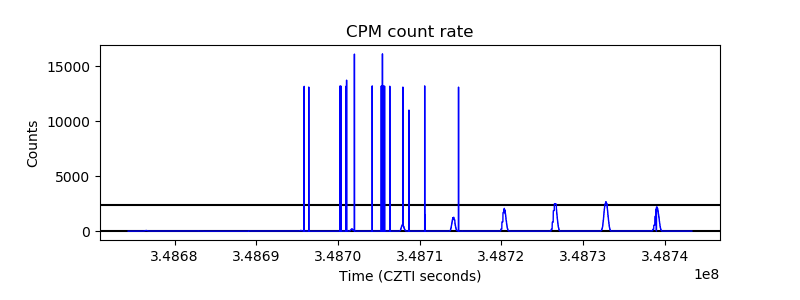 |
| CZT Counter | 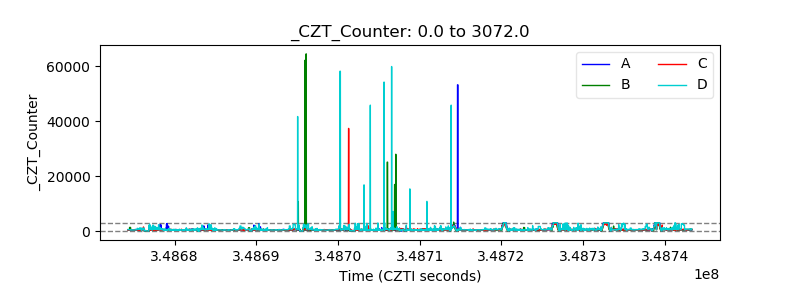 |
| +2.5 Volts monitor | 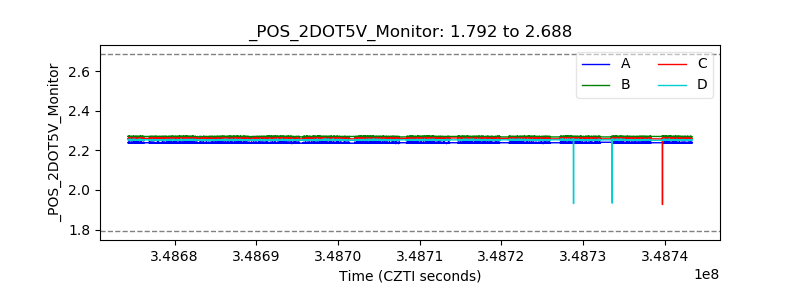 |
| +5 Volts monitor | 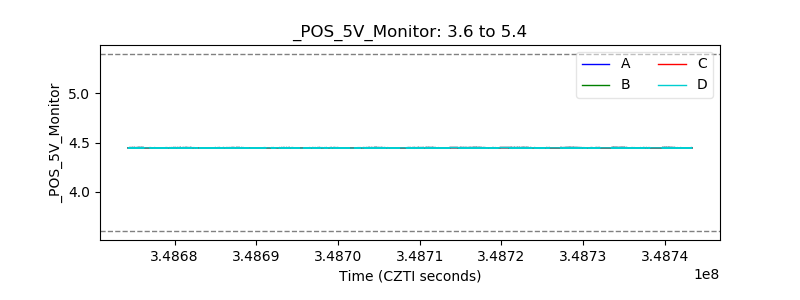 |
| _ROLL_ROT | 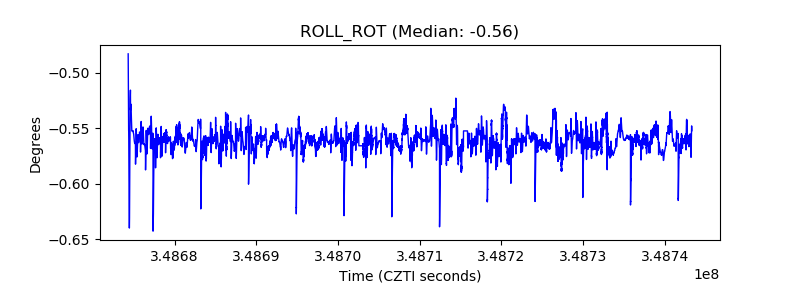 |
| _Roll_DEC | 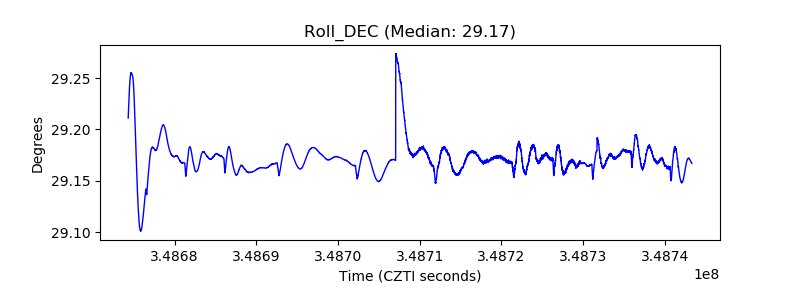 |
| _Roll_RA | 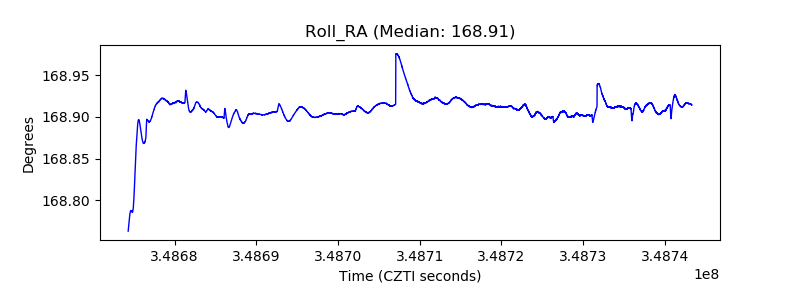 |
| Veto Counter | 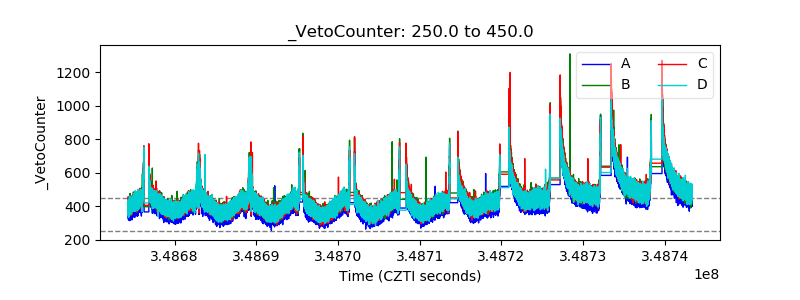 |