| Param | Original file | Final file |
|---|---|---|
| Filename | modeM0/AS1A10_123T03_9000004120_28707cztM0_level2.evt | modeM0/AS1A10_123T03_9000004120_28707cztM0_level2_quad_clean.evt |
| Size (bytes) | 276,229,440 | 42,062,400 |
| Size | 263.4 MB | 40.1 MB |
| Events in quadrant A | 1,875,698 | 263,693 |
| Events in quadrant B | 1,796,251 | 264,602 |
| Events in quadrant C | 1,804,103 | 251,938 |
| Events in quadrant D | 2,657,540 | 252,442 |
| Mode M0 | |||
|---|---|---|---|
| Quadrant | BADHDUFLAG | Total packets | Discarded packets |
| A | 0 | 7655 | 1 |
| B | 0 | 7367 | 1 |
| C | 0 | 7368 | 1 |
| D | 0 | 10279 | 1 |
| Mode SS | |||
|---|---|---|---|
| Quadrant | BADHDUFLAG | Total packets | Discarded packets |
| A | 0 | 70 | 0 |
| B | 0 | 70 | 0 |
| C | 0 | 70 | 0 |
| D | 0 | 70 | 0 |
| Mode M9 | |||
|---|---|---|---|
| Quadrant | BADHDUFLAG | Total packets | Discarded packets |
| A | 0 | 6 | 0 |
| B | 0 | 6 | 0 |
| C | 0 | 6 | 0 |
| D | 0 | 6 | 0 |
| Quadrant | Total seconds | Saturated seconds | Saturation percentage |
|---|---|---|---|
| A | 3393 | 108 | 3.183024% |
| B | 3393 | 100 | 2.947244% |
| C | 3393 | 186 | 5.481874% |
| D | 3393 | 185 | 5.452402% |
Noise dominated data is calculated using 1-second bins in cleaned event files. If a bin has >2000 counts, and if more than 50% of those come from <1% of pixels, then it is considered to be noise-dominated and hence unusable.
| Quadrant | # 1 sec bins | Bins with >0 counts | Bins with >2000 counts | High rate bins dominated by noise | Noise dominated (total time) | Noise dominated (detector-on time) | Marked lightcurve |
|---|---|---|---|---|---|---|---|
| A | 3982 | 3392 | 23 | 23 | 0.58% | 0.68% | 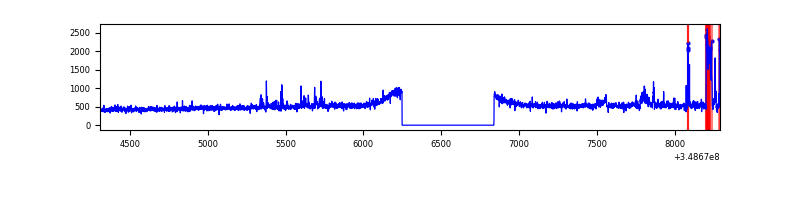 |
| B | 3983 | 3393 | 9 | 9 | 0.23% | 0.27% | 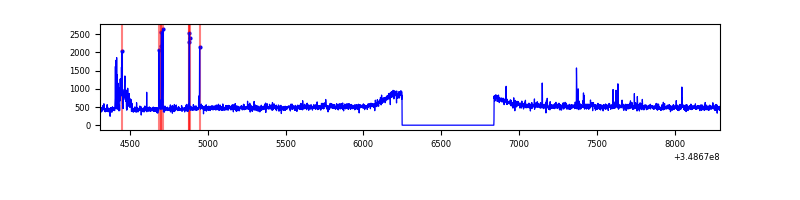 |
| C | 3983 | 3393 | 0 | 0 | 0.00% | 0.00% |  |
| D | 3983 | 3393 | 63 | 63 | 1.58% | 1.86% | 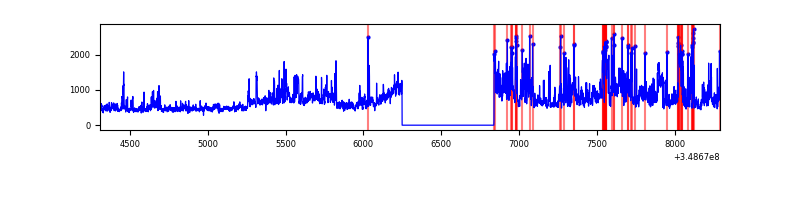 |
Top three noisy pixels from each quadrant. If the there are fewer than three noisy pixels in the level2.evt file, extra rows are filled as -1
| Pixel properties | Quadrant properties | ||||||
|---|---|---|---|---|---|---|---|
| Quadrant | DetID | PixID | Counts | Sigma | Mean | Median | Sigma |
| A | 15 | 174 | 135884 | 1498.41 | 444 | 435 | 90.4 |
| A | 5 | 98 | 19396 | 209.76 | 444 | 435 | 90.4 |
| A | 13 | 254 | 6042 | 62.03 | 444 | 435 | 90.4 |
| B | 4 | 80 | 72563 | 833.16 | 437 | 425 | 86.6 |
| B | 12 | 111 | 10612 | 117.65 | 437 | 425 | 86.6 |
| B | 11 | 111 | 9713 | 107.27 | 437 | 425 | 86.6 |
| C | 14 | 238 | 91477 | 918.45 | 419 | 422 | 99.1 |
| C | 14 | 254 | 38186 | 380.91 | 419 | 422 | 99.1 |
| C | 10 | 22 | 35917 | 358.03 | 419 | 422 | 99.1 |
| D | 1 | 52 | 512284 | 4994.9 | 423 | 410 | 102.5 |
| D | 8 | 195 | 369108 | 3597.78 | 423 | 410 | 102.5 |
| D | 12 | 233 | 75405 | 731.81 | 423 | 410 | 102.5 |
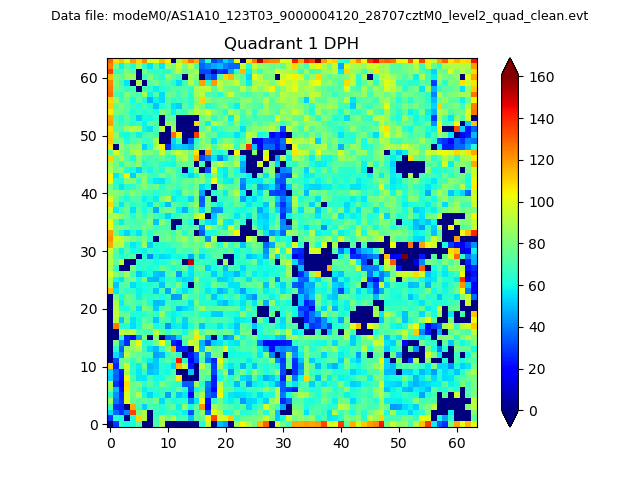
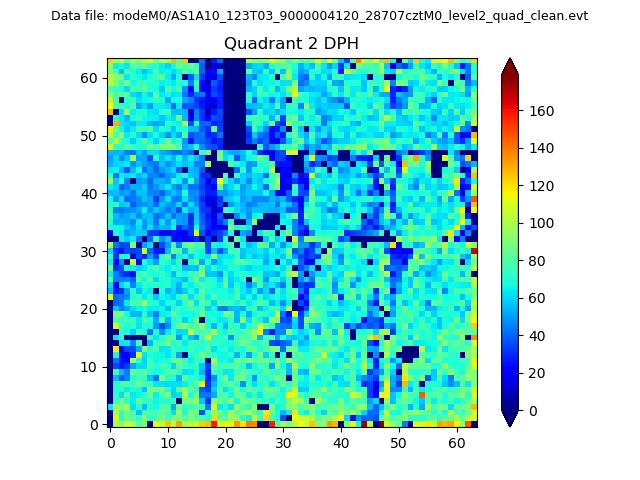
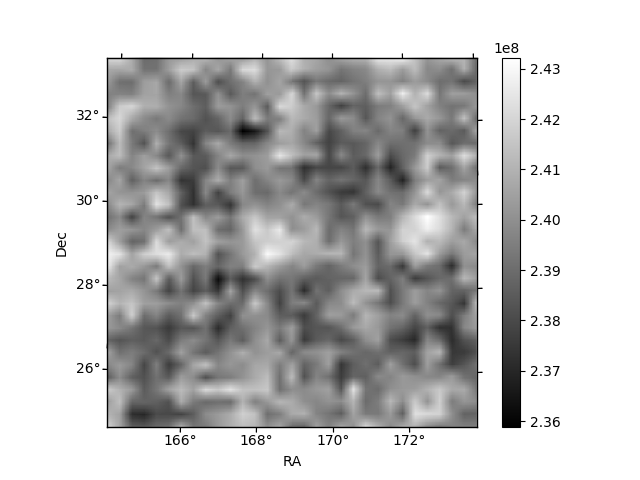
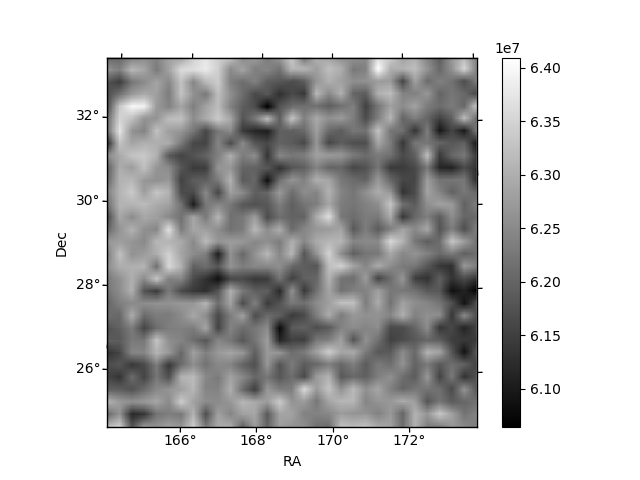
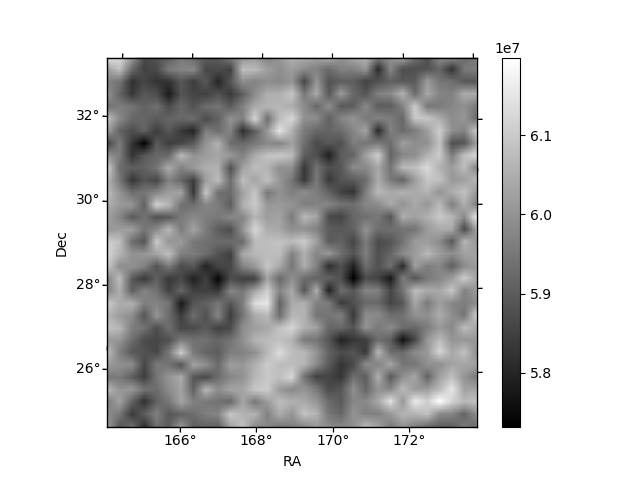
Histogram calculated using DETX and DETY for each event in the final _common_clean file
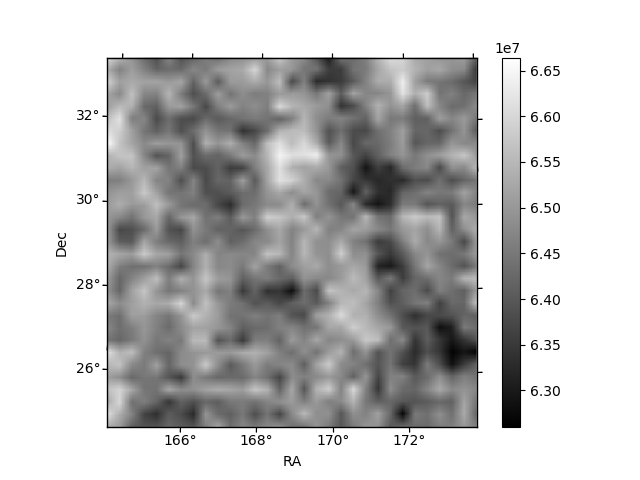
| Quadrant A | 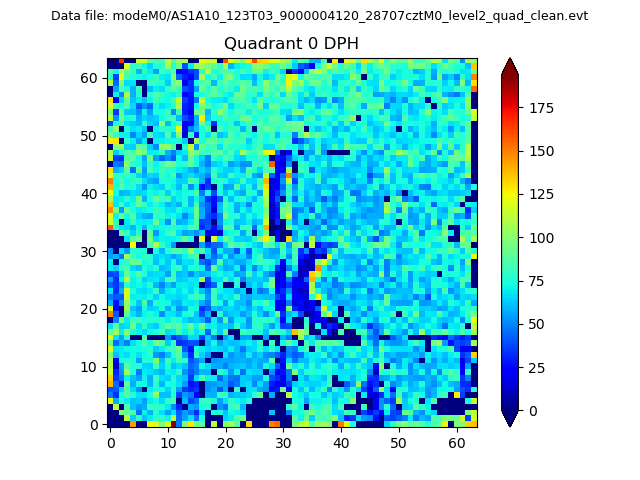 |
 |
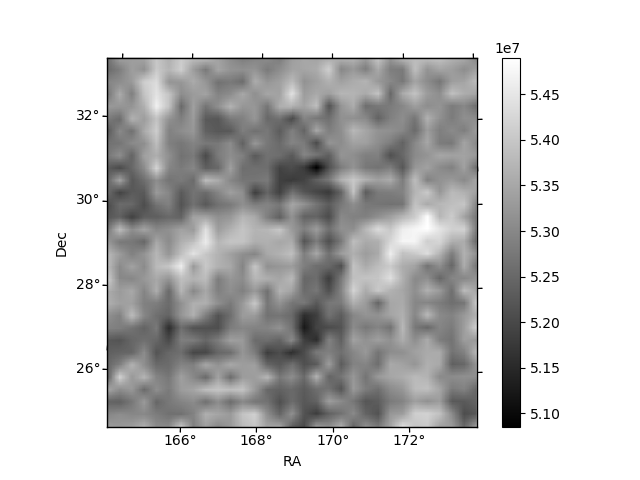
Quadrant B |
|---|---|---|---|
| Quadrant D | 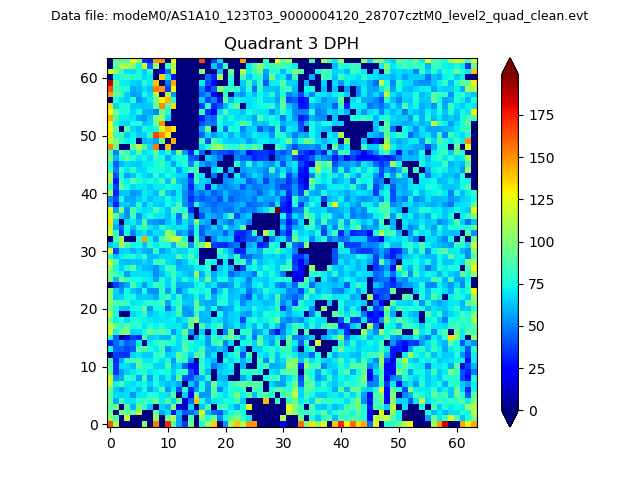 |
 |
Quadrant C |
| Plot type | Count rate plots | Images |
|---|---|---|
| Comparison with Poisson distribution Blue bars denote a histogram of data divided into 1 sec bins. Red curve is a Poisson curve with rate = median count rate of data. |
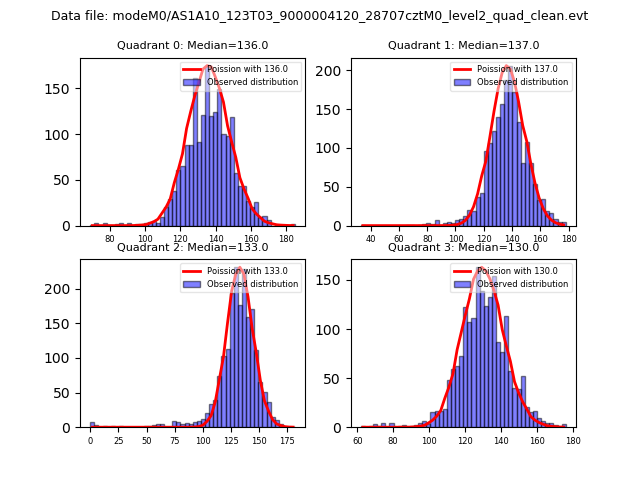 |
 |
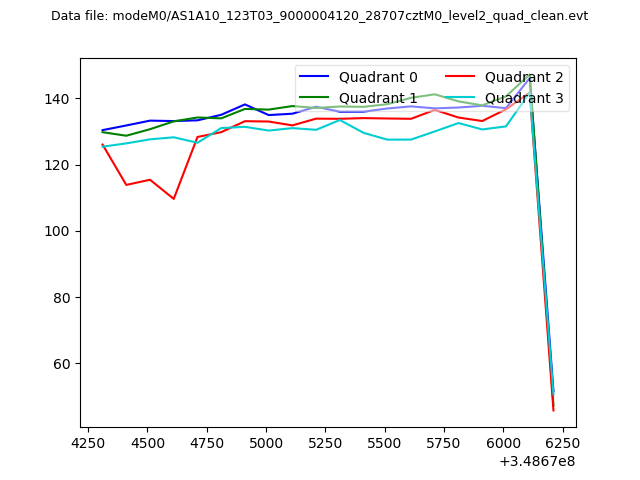
| Quadrant-wise count rates Data is divided into 100 sec bins |
 |
|
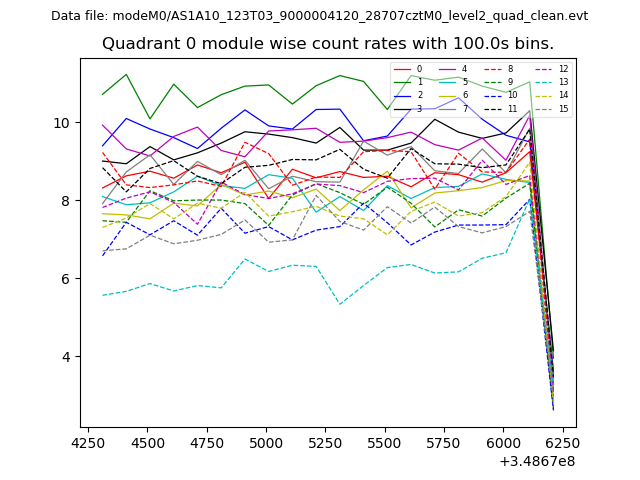
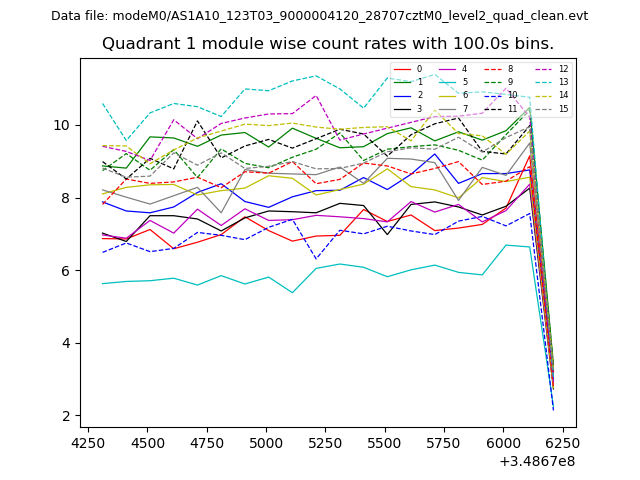
| Module-wise count rates for Quadrant A Data is divided into 100 sec bins |
 |
 |
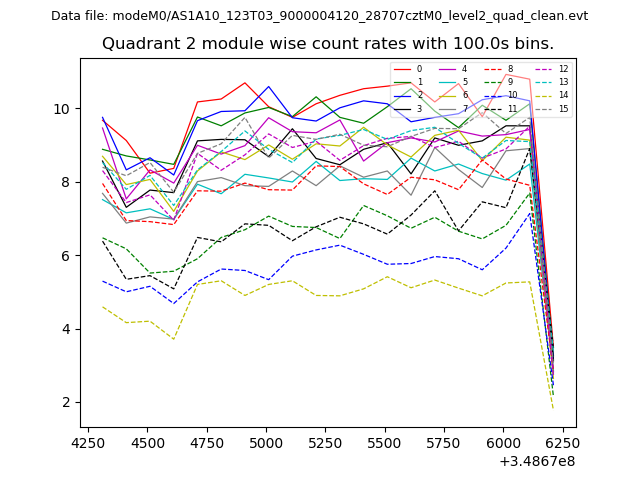
| Module-wise count rates for Quadrant B Data is divided into 100 sec bins |
 |
 |
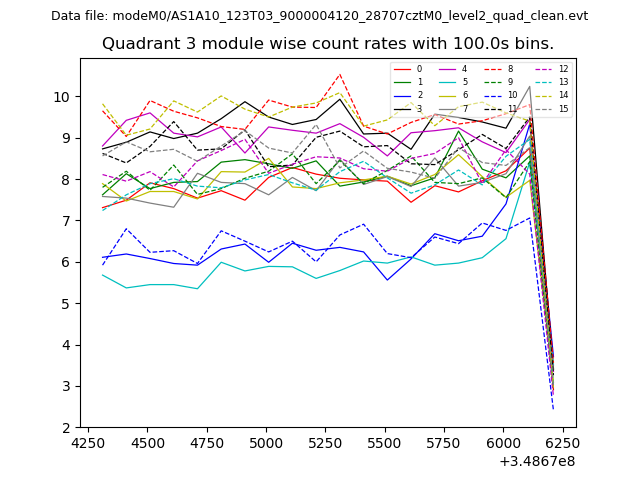
| Module-wise count rates for Quadrant C Data is divided into 100 sec bins |
 |
 |
| Module-wise count rates for Quadrant D Data is divided into 100 sec bins |
 |
 |
| Parameter | Plot |
|---|---|
| CZT HV Monitor | 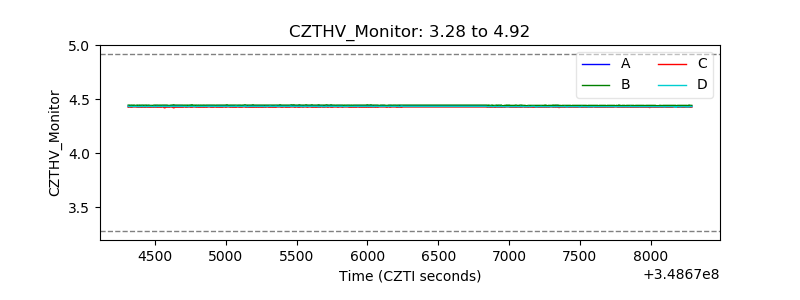 |
| D_VDD | 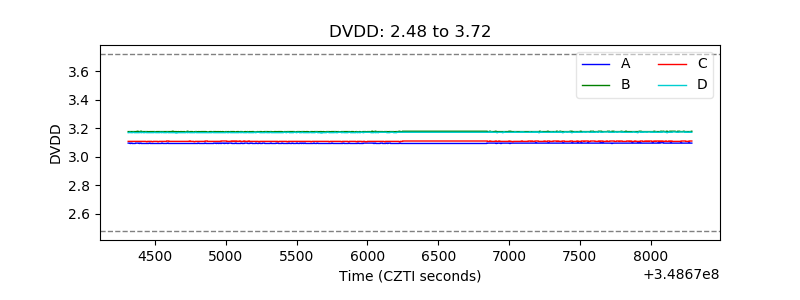 |
| Temperature 1 | 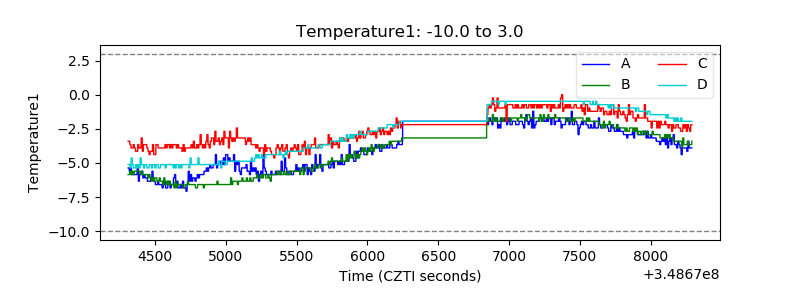 |
| Veto HV Monitor | 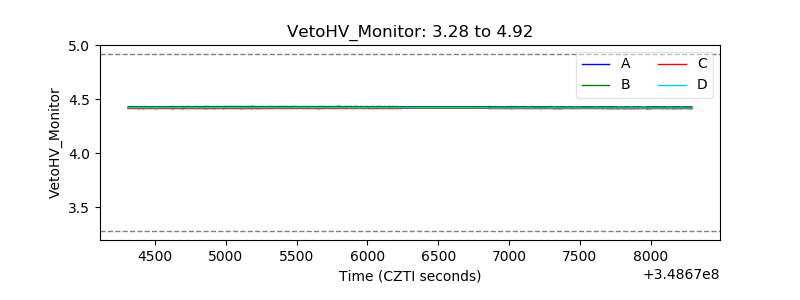 |
| Veto LLD | 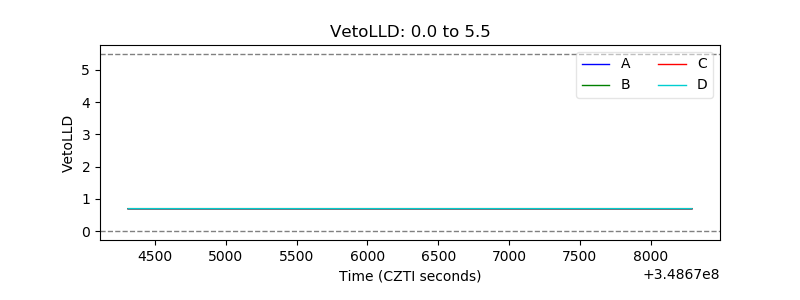 |
| Alpha Counter | 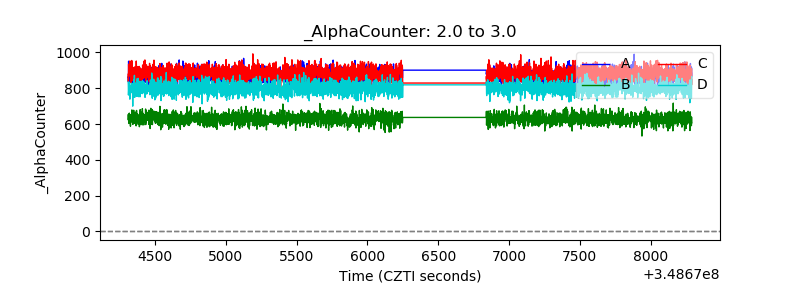 |
| _CPM_Rate | 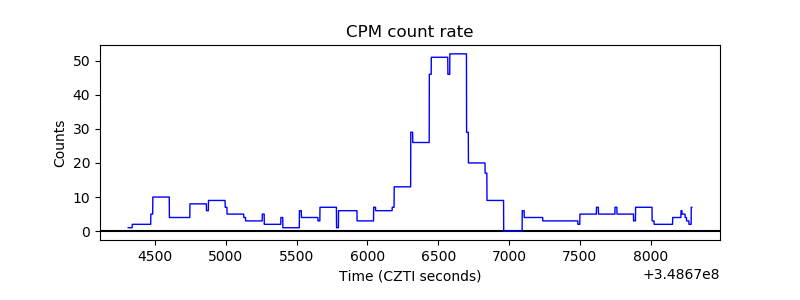 |
| CZT Counter | 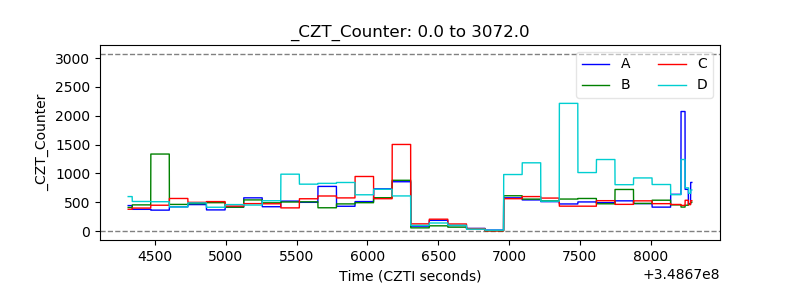 |
| +2.5 Volts monitor |  |
| +5 Volts monitor |  |
| _ROLL_ROT |  |
| _Roll_DEC |  |
| _Roll_RA | 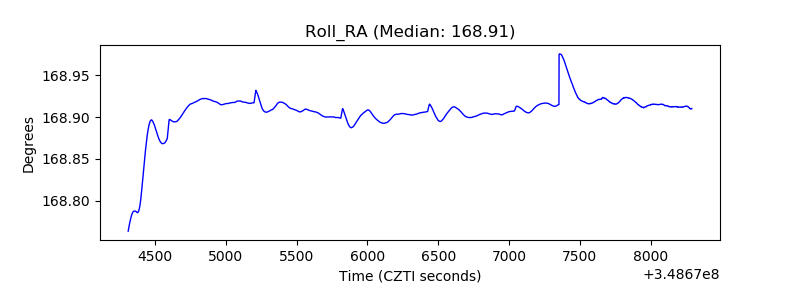 |
| Veto Counter | 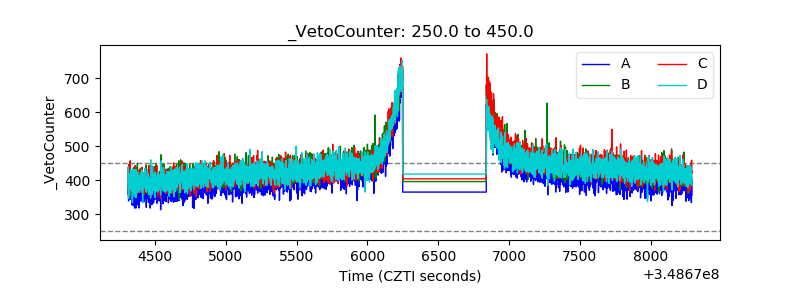 |