| Param | Original file | Final file |
|---|---|---|
| Filename | modeM0/AS1A10_123T03_9000004120_28709cztM0_level2.evt | modeM0/AS1A10_123T03_9000004120_28709cztM0_level2_quad_clean.evt |
| Size (bytes) | 649,722,240 | 94,616,640 |
| Size | 619.6 MB | 90.2 MB |
| Events in quadrant A | 4,636,093 | 576,539 |
| Events in quadrant B | 4,280,110 | 583,927 |
| Events in quadrant C | 4,396,263 | 565,666 |
| Events in quadrant D | 5,791,453 | 551,967 |
| Mode M0 | |||
|---|---|---|---|
| Quadrant | BADHDUFLAG | Total packets | Discarded packets |
| A | 0 | 19279 | 1 |
| B | 0 | 18131 | 1 |
| C | 0 | 18287 | 1 |
| D | 0 | 23001 | 1 |
| Mode SS | |||
|---|---|---|---|
| Quadrant | BADHDUFLAG | Total packets | Discarded packets |
| A | 0 | 174 | 0 |
| B | 0 | 174 | 0 |
| C | 0 | 174 | 0 |
| D | 0 | 176 | 0 |
| Mode M9 | |||
|---|---|---|---|
| Quadrant | BADHDUFLAG | Total packets | Discarded packets |
| A | 0 | 5 | 0 |
| B | 0 | 5 | 0 |
| C | 0 | 5 | 0 |
| D | 0 | 5 | 0 |
| Quadrant | Total seconds | Saturated seconds | Saturation percentage |
|---|---|---|---|
| A | 8463 | 316 | 3.733901% |
| B | 8463 | 250 | 2.954035% |
| C | 8463 | 392 | 4.631927% |
| D | 8463 | 358 | 4.230178% |
Noise dominated data is calculated using 1-second bins in cleaned event files. If a bin has >2000 counts, and if more than 50% of those come from <1% of pixels, then it is considered to be noise-dominated and hence unusable.
| Quadrant | # 1 sec bins | Bins with >0 counts | Bins with >2000 counts | High rate bins dominated by noise | Noise dominated (total time) | Noise dominated (detector-on time) | Marked lightcurve |
|---|---|---|---|---|---|---|---|
| A | 8873 | 8466 | 132 | 132 | 1.49% | 1.56% | 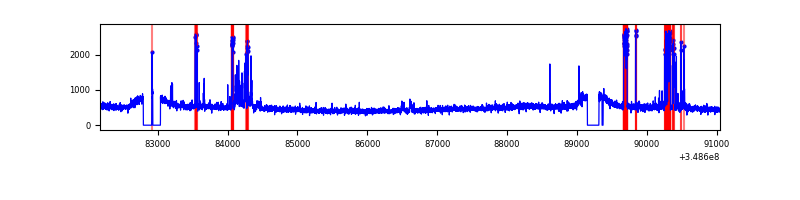 |
| B | 8873 | 8465 | 11 | 11 | 0.12% | 0.13% | 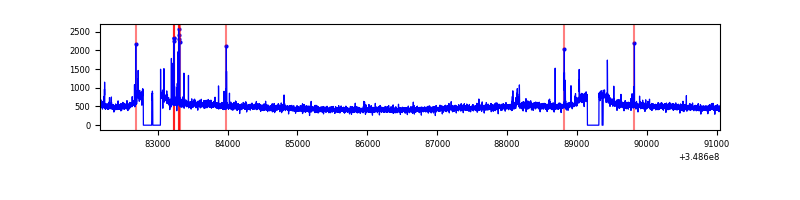 |
| C | 8873 | 8463 | 0 | 0 | 0.00% | 0.00% | 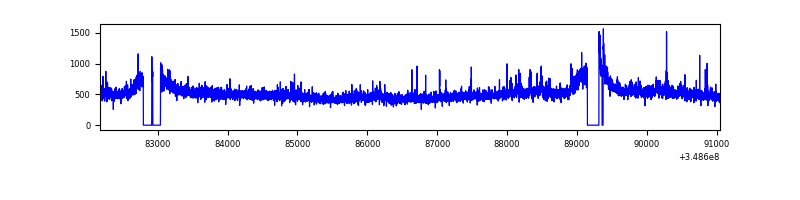 |
| D | 8873 | 8464 | 184 | 184 | 2.07% | 2.17% | 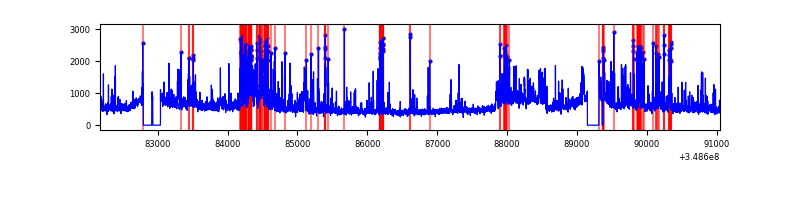 |
Top three noisy pixels from each quadrant. If the there are fewer than three noisy pixels in the level2.evt file, extra rows are filled as -1
| Pixel properties | Quadrant properties | ||||||
|---|---|---|---|---|---|---|---|
| Quadrant | DetID | PixID | Counts | Sigma | Mean | Median | Sigma |
| A | 15 | 174 | 460227 | 2151.87 | 1057 | 1031 | 213.4 |
| A | 14 | 239 | 87646 | 405.89 | 1057 | 1031 | 213.4 |
| A | 13 | 254 | 16288 | 71.5 | 1057 | 1031 | 213.4 |
| B | 0 | 156 | 55063 | 267.54 | 1053 | 1025 | 202.0 |
| B | 0 | 230 | 30619 | 146.52 | 1053 | 1025 | 202.0 |
| B | 12 | 111 | 24861 | 118.01 | 1053 | 1025 | 202.0 |
| C | 14 | 238 | 195477 | 817.04 | 1014 | 1018 | 238.0 |
| C | 3 | 233 | 192136 | 803.0 | 1014 | 1018 | 238.0 |
| C | 14 | 254 | 50081 | 206.14 | 1014 | 1018 | 238.0 |
| D | 8 | 195 | 648642 | 2639.05 | 1026 | 996 | 245.4 |
| D | 7 | 80 | 647159 | 2633.0 | 1026 | 996 | 245.4 |
| D | 1 | 52 | 280146 | 1137.49 | 1026 | 996 | 245.4 |
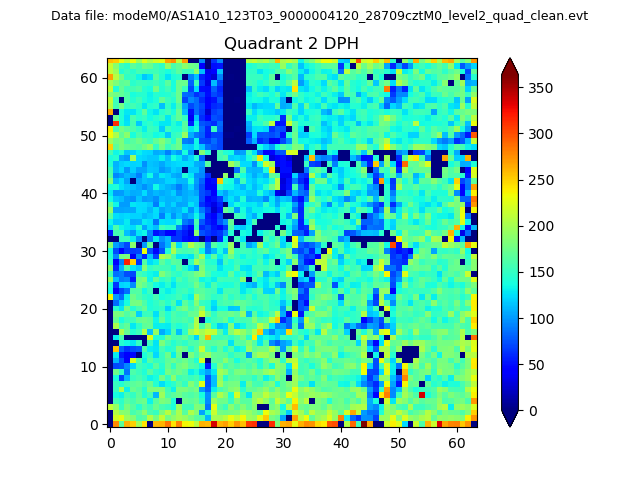
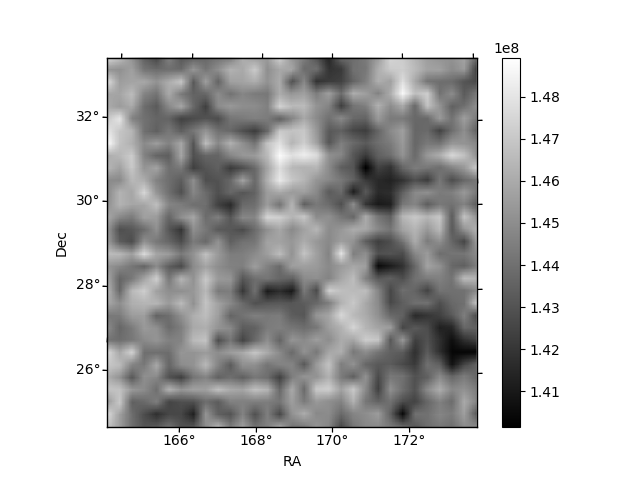
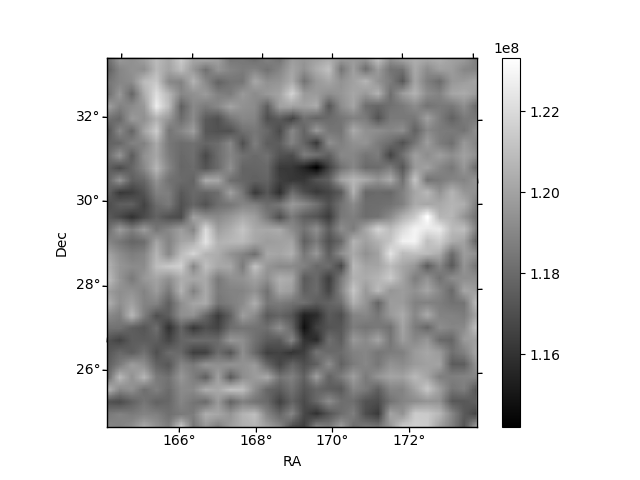
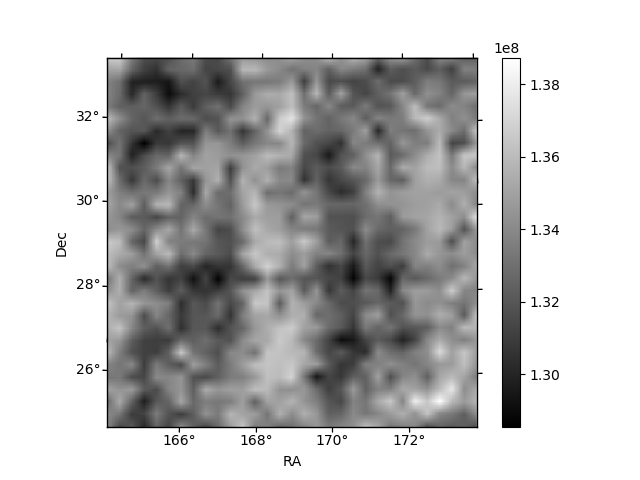
Histogram calculated using DETX and DETY for each event in the final _common_clean file
| Quadrant A | 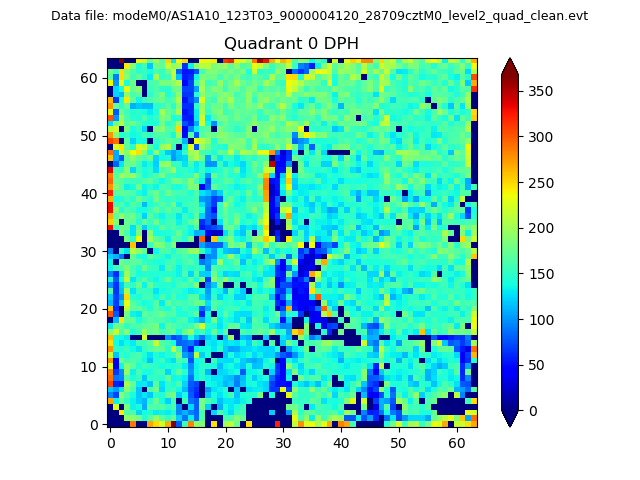 |
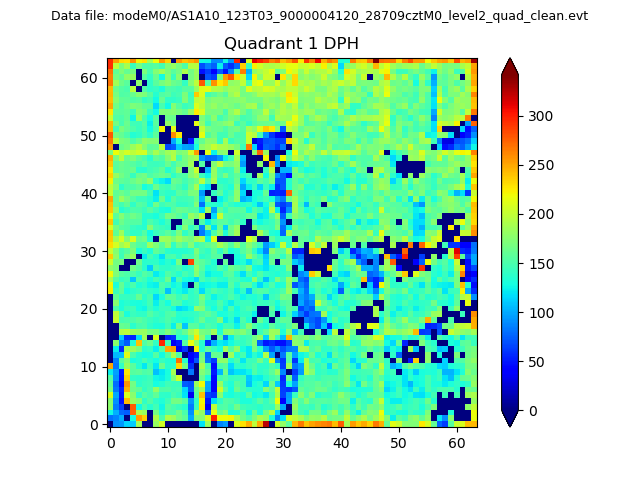 |
Quadrant B |
|---|---|---|---|
| Quadrant D | 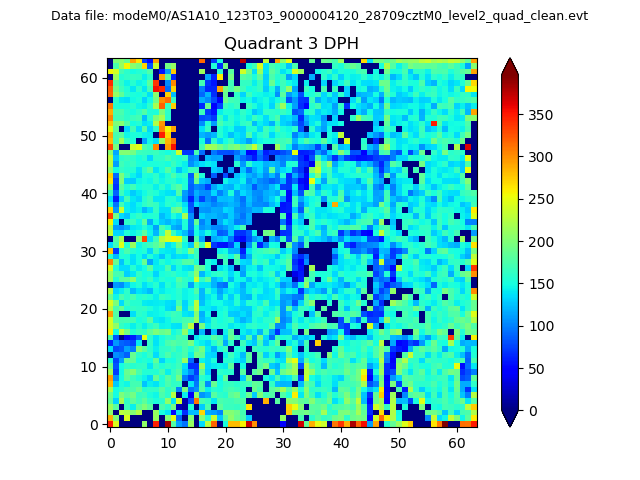 |
 |
Quadrant C |
| Plot type | Count rate plots | Images |
|---|---|---|
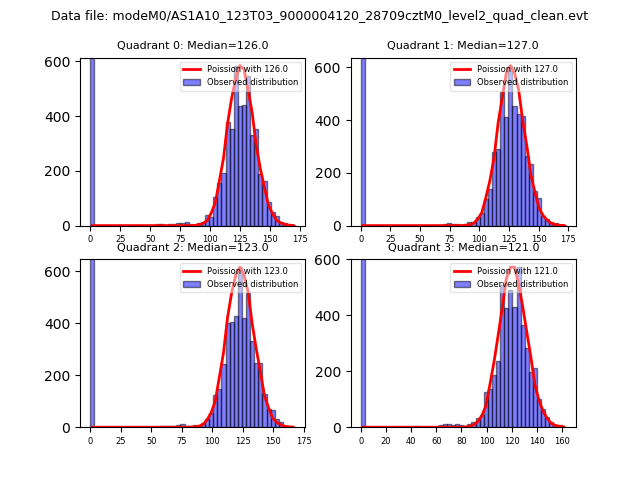
| Comparison with Poisson distribution Blue bars denote a histogram of data divided into 1 sec bins. Red curve is a Poisson curve with rate = median count rate of data. |
 |
 |
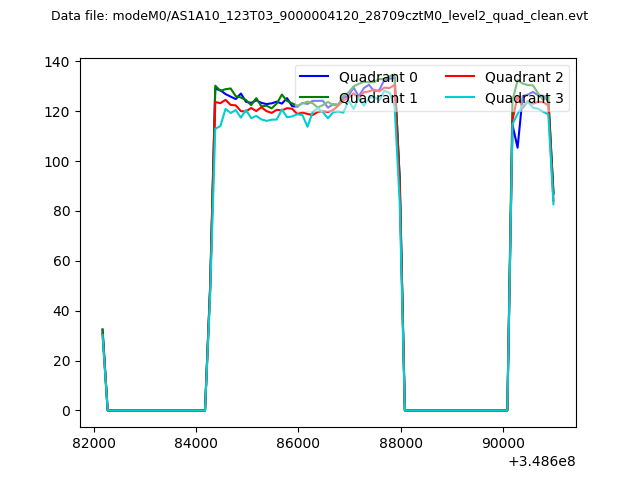
| Quadrant-wise count rates Data is divided into 100 sec bins |
 |
|
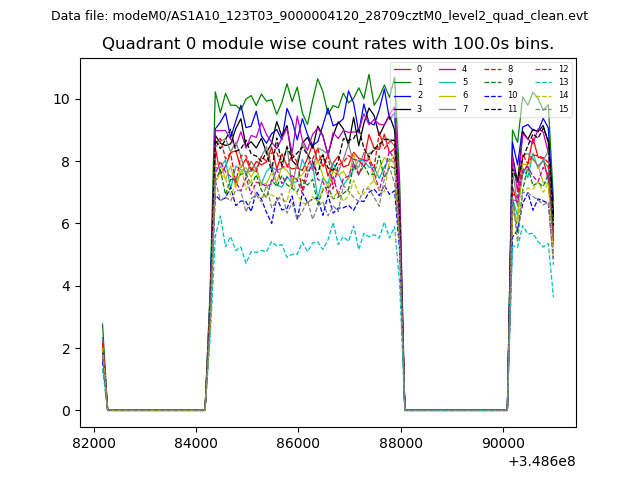
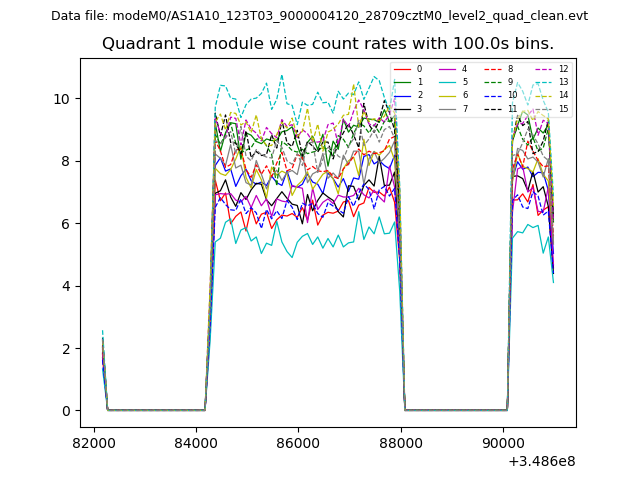
| Module-wise count rates for Quadrant A Data is divided into 100 sec bins |
 |
 |
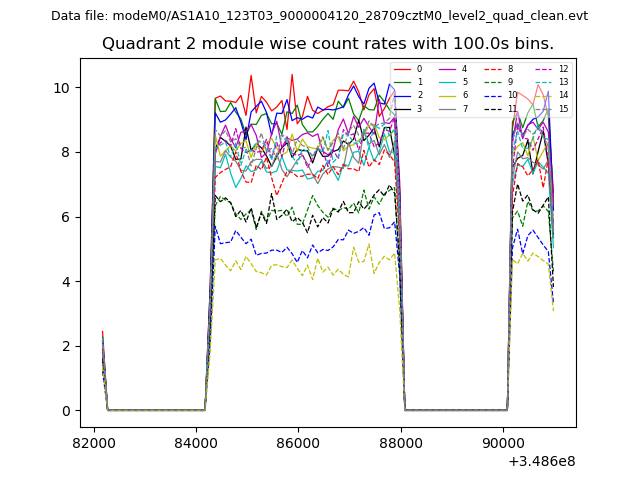
| Module-wise count rates for Quadrant B Data is divided into 100 sec bins |
 |
 |
| Module-wise count rates for Quadrant C Data is divided into 100 sec bins |
 |
 |
| Module-wise count rates for Quadrant D Data is divided into 100 sec bins |
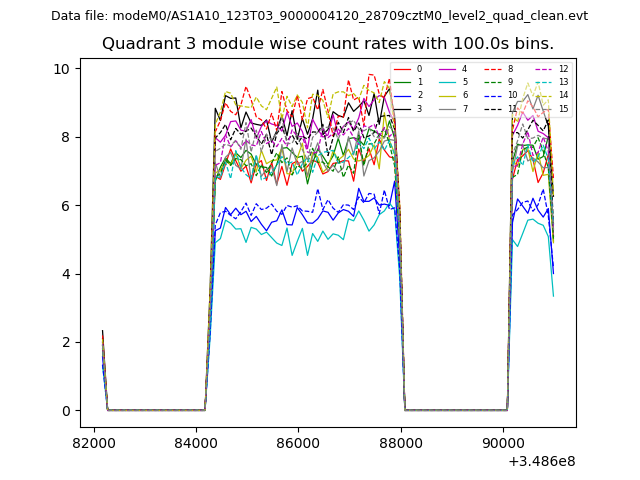 |
 |
| Parameter | Plot |
|---|---|
| CZT HV Monitor | 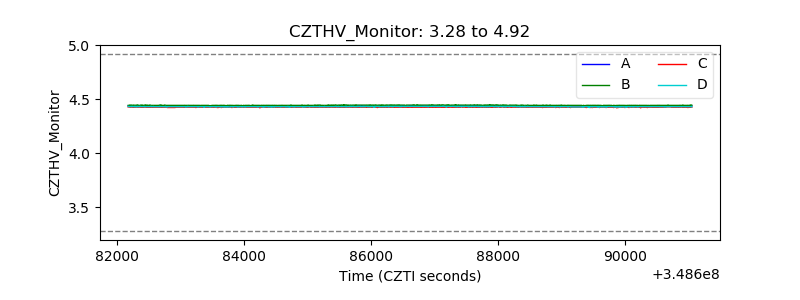 |
| D_VDD |  |
| Temperature 1 | 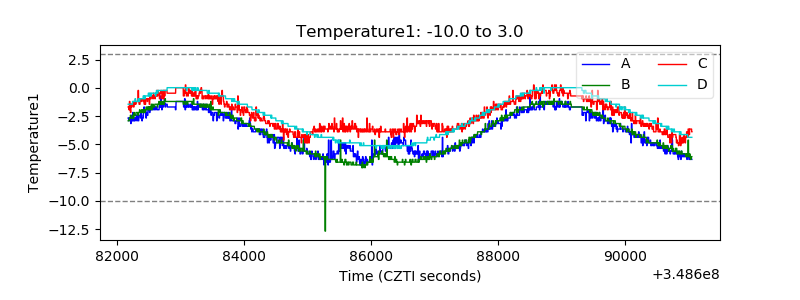 |
| Veto HV Monitor | 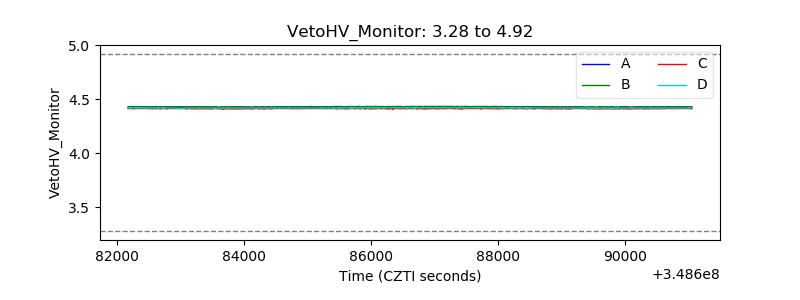 |
| Veto LLD | 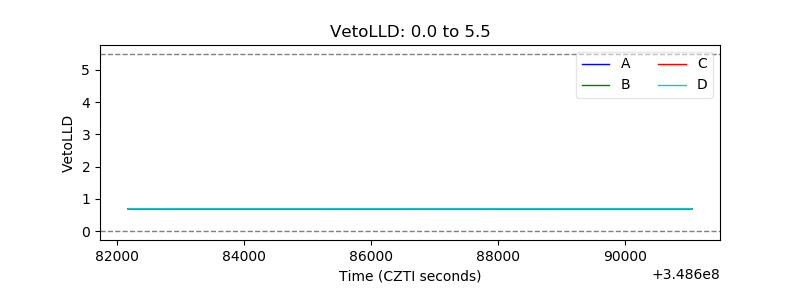 |
| Alpha Counter | 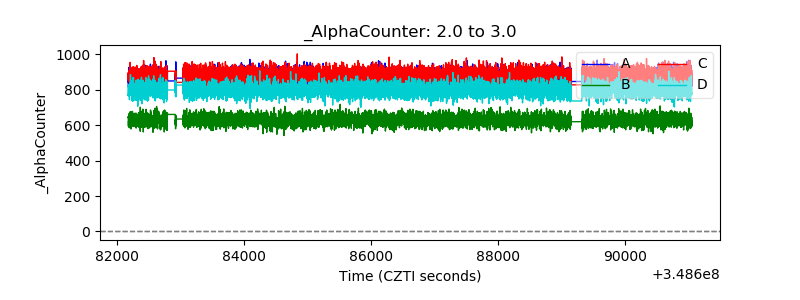 |
| _CPM_Rate |  |
| CZT Counter | 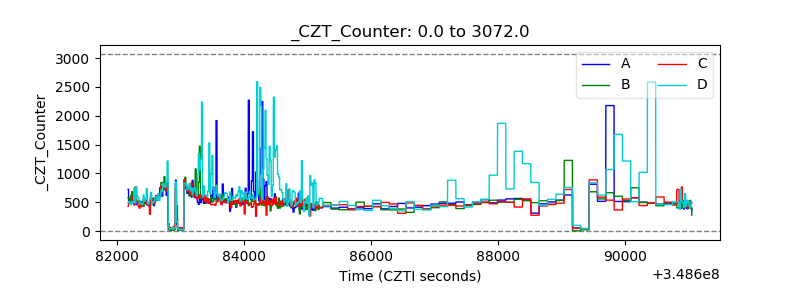 |
| +2.5 Volts monitor |  |
| +5 Volts monitor |  |
| _ROLL_ROT | 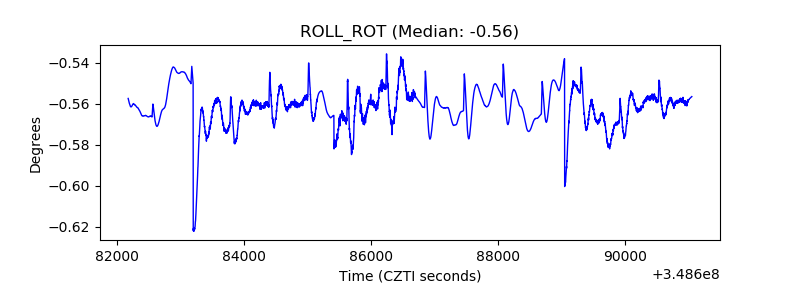 |
| _Roll_DEC | 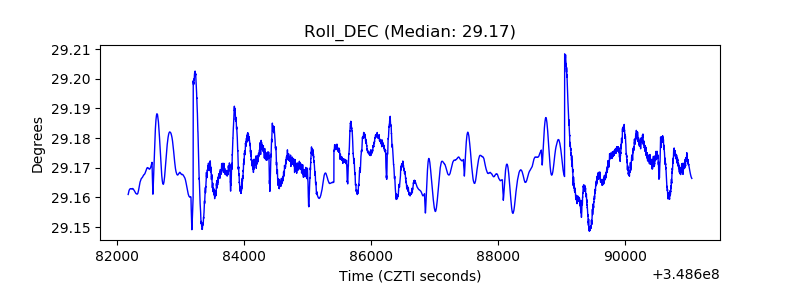 |
| _Roll_RA |  |
| Veto Counter | 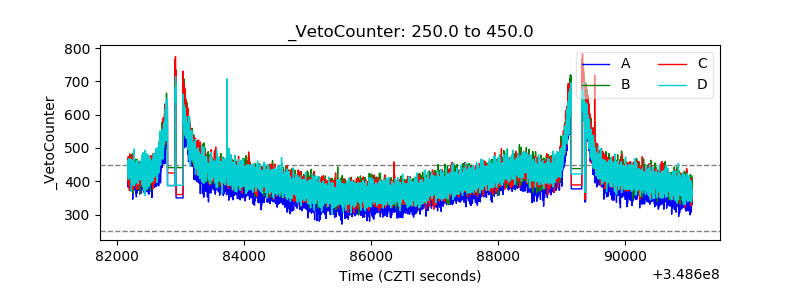 |