| Param | Original file | Final file |
|---|---|---|
| Filename | modeM0/AS1A10_123T03_9000004120_28715cztM0_level2.evt | modeM0/AS1A10_123T03_9000004120_28715cztM0_level2_quad_clean.evt |
| Size (bytes) | 2,074,204,800 | 373,703,040 |
| Size | 1.9 GB | 356.4 MB |
| Events in quadrant A | 13,507,106 | 2,380,699 |
| Events in quadrant B | 13,604,433 | 2,426,607 |
| Events in quadrant C | 14,679,376 | 2,314,018 |
| Events in quadrant D | 19,113,817 | 2,249,786 |
| Mode M0 | |||
|---|---|---|---|
| Quadrant | BADHDUFLAG | Total packets | Discarded packets |
| A | 0 | 58934 | 5 |
| B | 0 | 59116 | 5 |
| C | 0 | 61717 | 5 |
| D | 0 | 76388 | 5 |
| Mode SS | |||
|---|---|---|---|
| Quadrant | BADHDUFLAG | Total packets | Discarded packets |
| A | 0 | 578 | 0 |
| B | 0 | 578 | 0 |
| C | 0 | 578 | 0 |
| D | 0 | 578 | 0 |
| Mode M9 | |||
|---|---|---|---|
| Quadrant | BADHDUFLAG | Total packets | Discarded packets |
| A | 0 | 39 | 0 |
| B | 0 | 39 | 0 |
| C | 0 | 39 | 0 |
| D | 0 | 39 | 0 |
| Quadrant | Total seconds | Saturated seconds | Saturation percentage |
|---|---|---|---|
| A | 28330 | 191 | 0.674197% |
| B | 28331 | 209 | 0.737708% |
| C | 28331 | 579 | 2.043698% |
| D | 28331 | 1566 | 5.527514% |
Noise dominated data is calculated using 1-second bins in cleaned event files. If a bin has >2000 counts, and if more than 50% of those come from <1% of pixels, then it is considered to be noise-dominated and hence unusable.
| Quadrant | # 1 sec bins | Bins with >0 counts | Bins with >2000 counts | High rate bins dominated by noise | Noise dominated (total time) | Noise dominated (detector-on time) | Marked lightcurve |
|---|---|---|---|---|---|---|---|
| A | 32245 | 28331 | 60 | 60 | 0.19% | 0.21% | 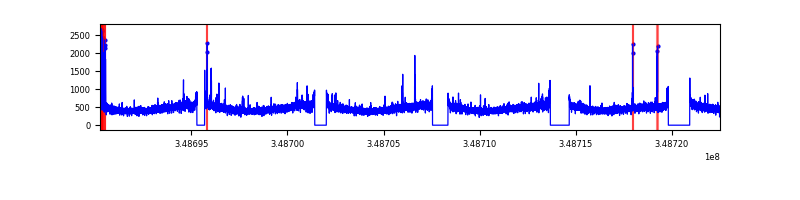 |
| B | 32246 | 28331 | 7 | 7 | 0.02% | 0.02% | 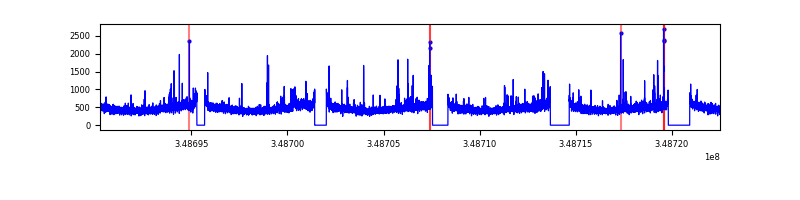 |
| C | 32246 | 28332 | 0 | 0 | 0.00% | 0.00% | 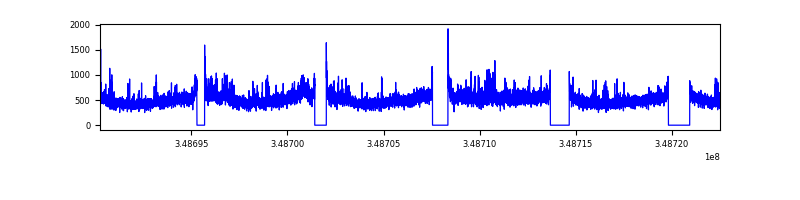 |
| D | 32246 | 28333 | 1264 | 1264 | 3.92% | 4.46% | 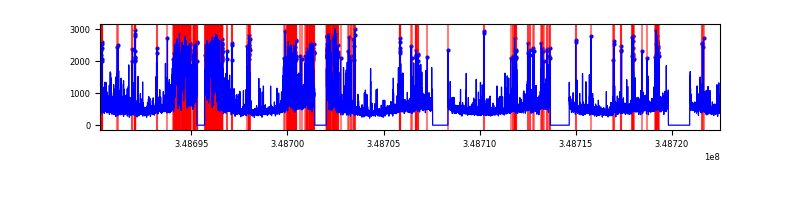 |
Top three noisy pixels from each quadrant. If the there are fewer than three noisy pixels in the level2.evt file, extra rows are filled as -1
| Pixel properties | Quadrant properties | ||||||
|---|---|---|---|---|---|---|---|
| Quadrant | DetID | PixID | Counts | Sigma | Mean | Median | Sigma |
| A | 15 | 174 | 287503 | 416.96 | 3405 | 3335 | 681.5 |
| A | 14 | 239 | 81453 | 114.62 | 3405 | 3335 | 681.5 |
| A | 13 | 254 | 50246 | 68.83 | 3405 | 3335 | 681.5 |
| B | 0 | 190 | 84229 | 126.3 | 3387 | 3300 | 640.7 |
| B | 12 | 111 | 80326 | 120.21 | 3387 | 3300 | 640.7 |
| B | 11 | 111 | 72630 | 108.2 | 3387 | 3300 | 640.7 |
| C | 3 | 233 | 1216073 | 1605.21 | 3250 | 3272 | 755.5 |
| C | 14 | 238 | 621633 | 818.44 | 3250 | 3272 | 755.5 |
| C | 14 | 254 | 144220 | 186.55 | 3250 | 3272 | 755.5 |
| D | 1 | 52 | 4082553 | 5301.72 | 3222 | 3135 | 769.5 |
| D | 8 | 195 | 1381005 | 1790.72 | 3222 | 3135 | 769.5 |
| D | 7 | 80 | 644781 | 833.9 | 3222 | 3135 | 769.5 |
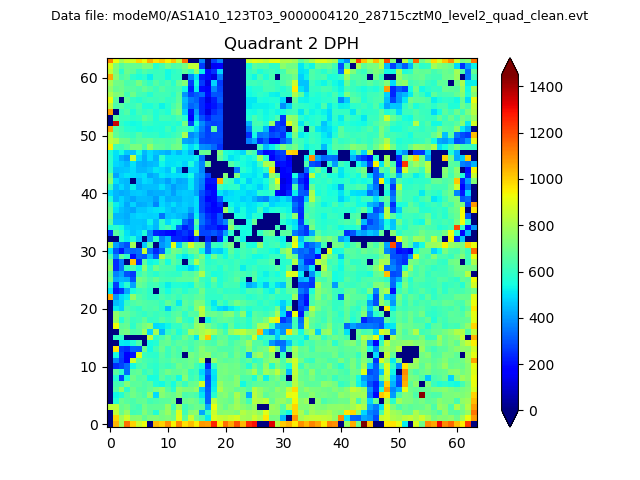
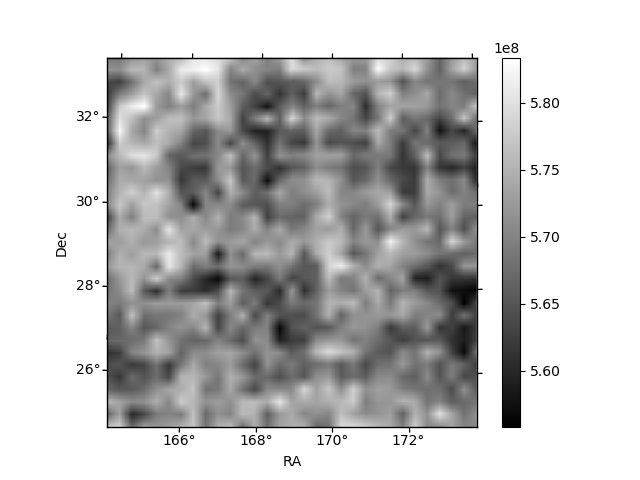
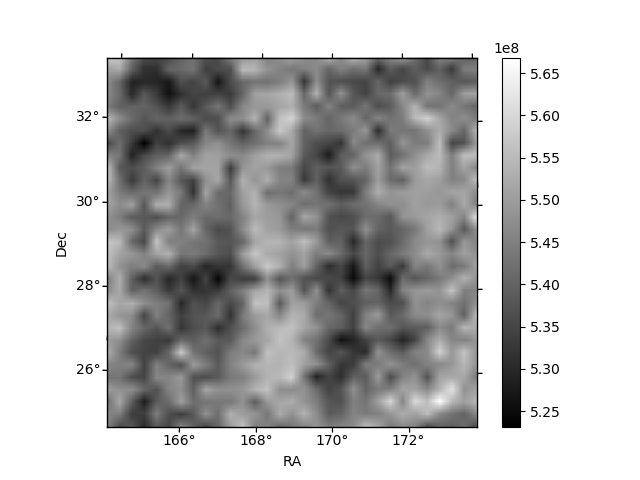
Histogram calculated using DETX and DETY for each event in the final _common_clean file
| Quadrant A | 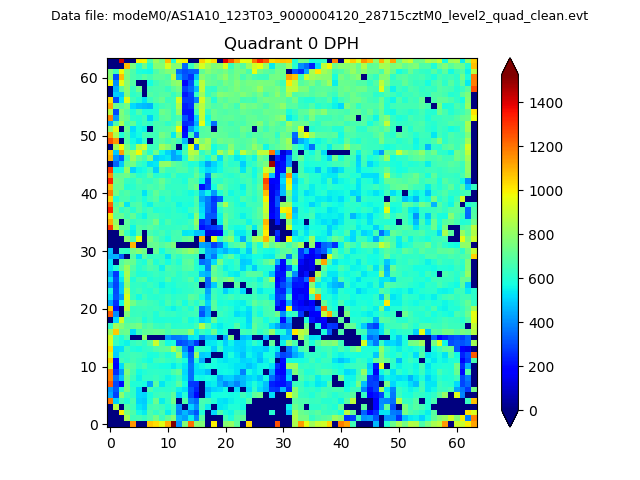 |
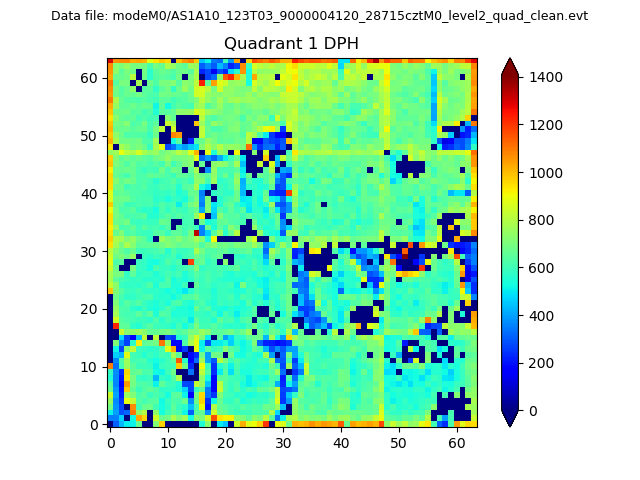 |
Quadrant B |
|---|---|---|---|
| Quadrant D | 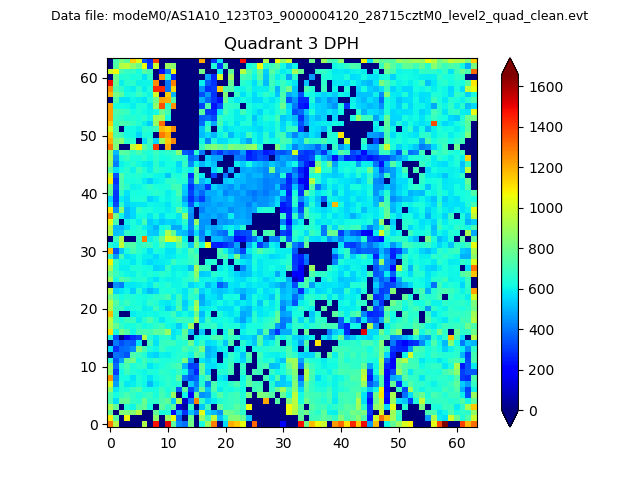 |
 |
Quadrant C |
| Plot type | Count rate plots | Images |
|---|---|---|
| Comparison with Poisson distribution Blue bars denote a histogram of data divided into 1 sec bins. Red curve is a Poisson curve with rate = median count rate of data. |
 |
 |
| Quadrant-wise count rates Data is divided into 100 sec bins |
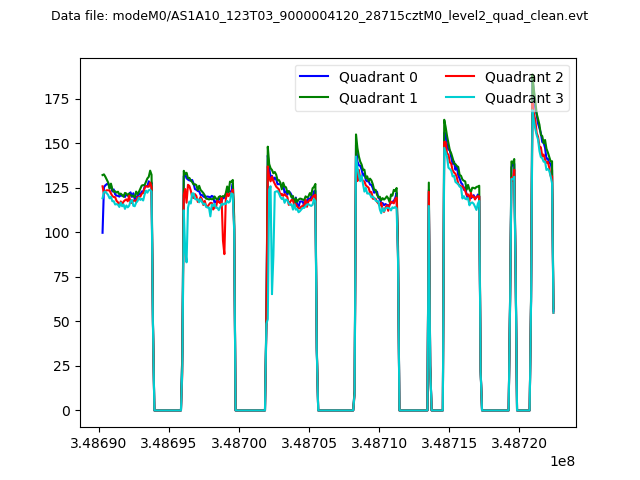 |
|
| Module-wise count rates for Quadrant A Data is divided into 100 sec bins |
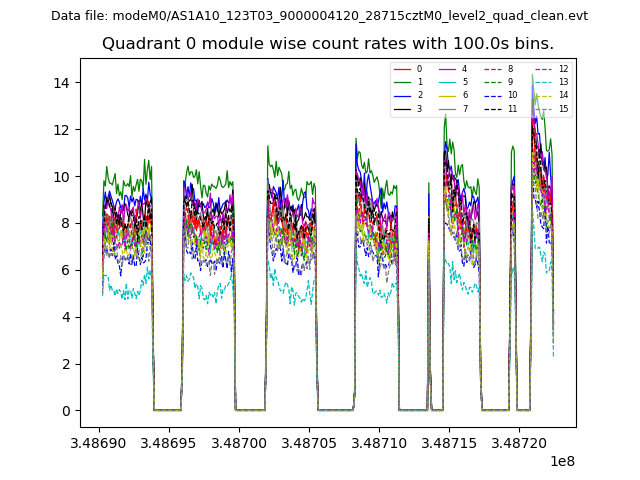 |
 |
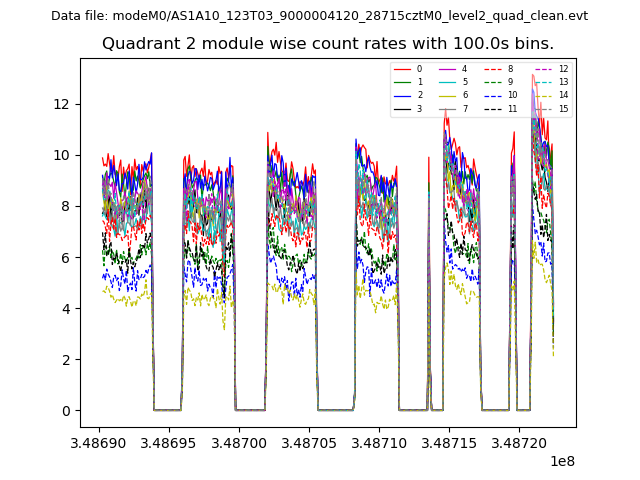
| Module-wise count rates for Quadrant B Data is divided into 100 sec bins |
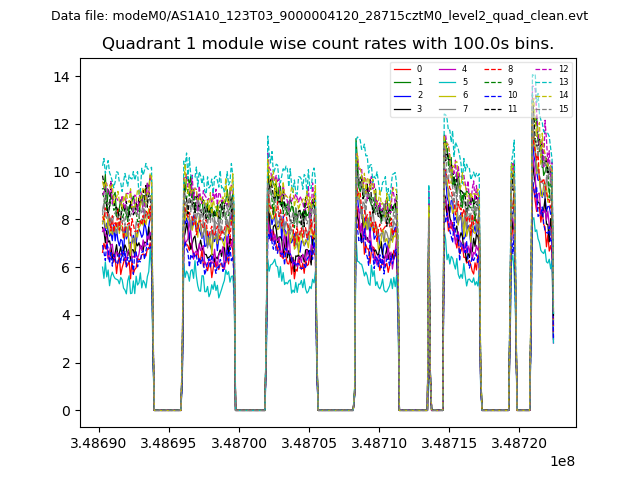 |
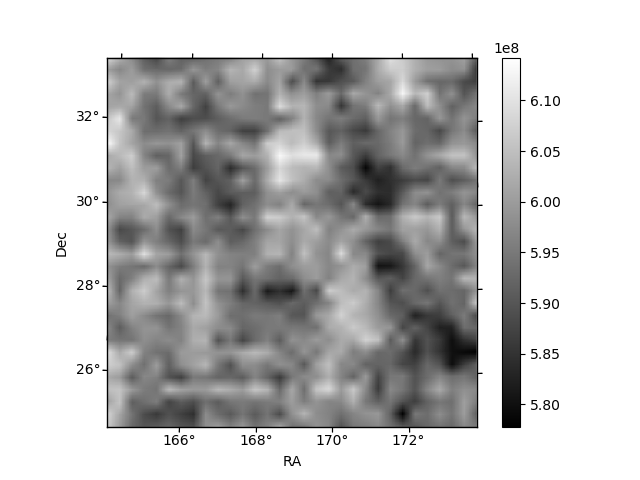 |
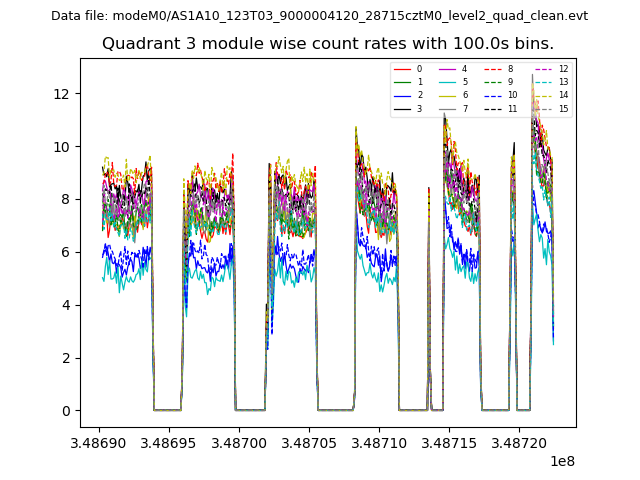
| Module-wise count rates for Quadrant C Data is divided into 100 sec bins |
 |
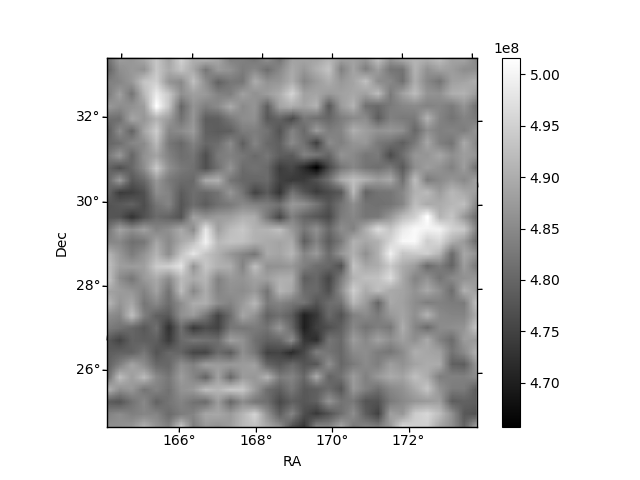 |
| Module-wise count rates for Quadrant D Data is divided into 100 sec bins |
 |
 |
| Parameter | Plot |
|---|---|
| CZT HV Monitor | 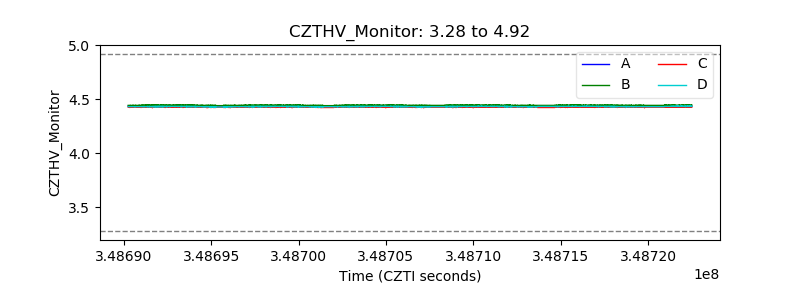 |
| D_VDD | 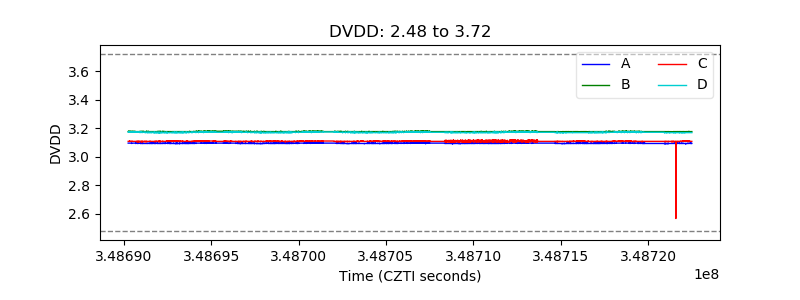 |
| Temperature 1 | 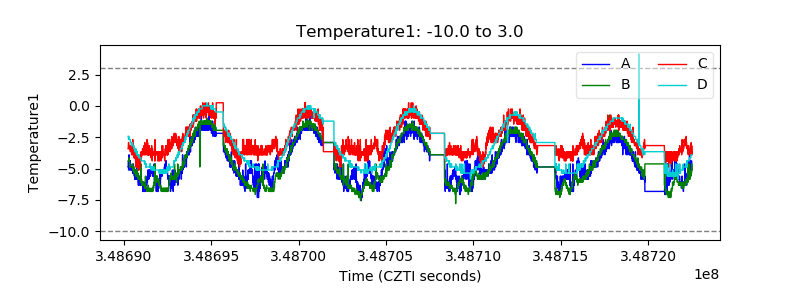 |
| Veto HV Monitor | 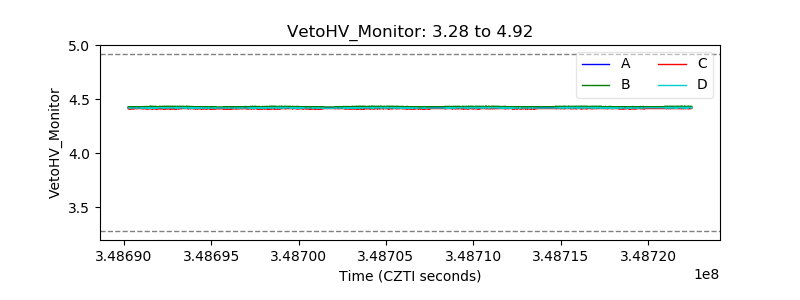 |
| Veto LLD | 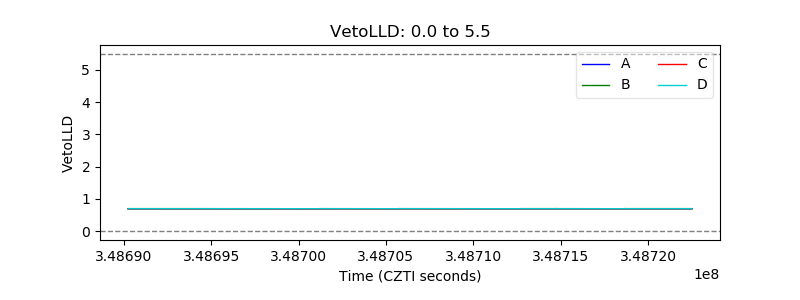 |
| Alpha Counter | 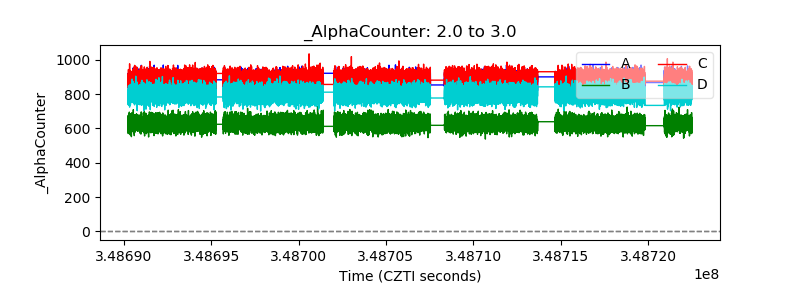 |
| _CPM_Rate | 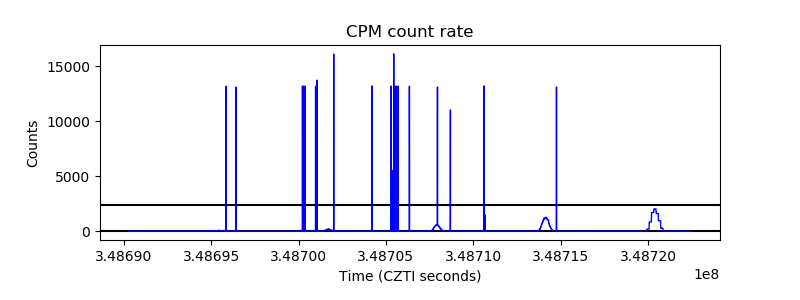 |
| CZT Counter | 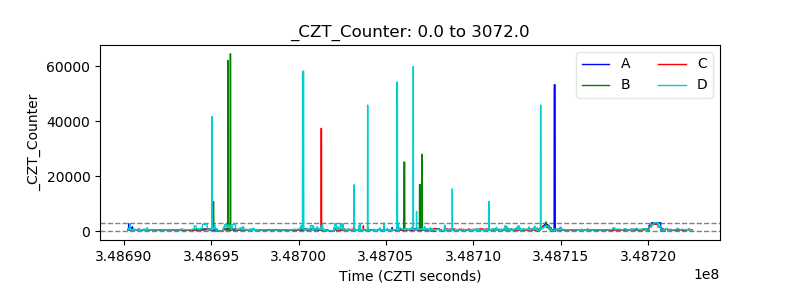 |
| +2.5 Volts monitor | 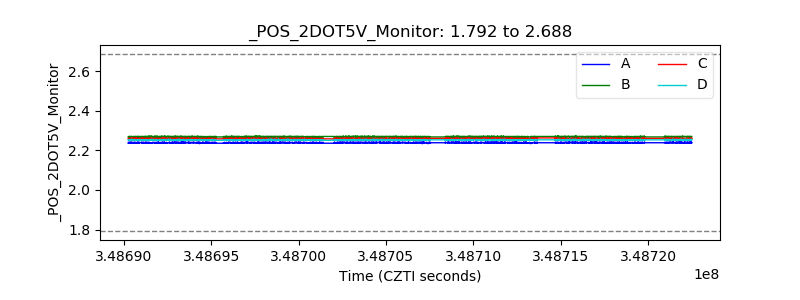 |
| +5 Volts monitor |  |
| _ROLL_ROT |  |
| _Roll_DEC | 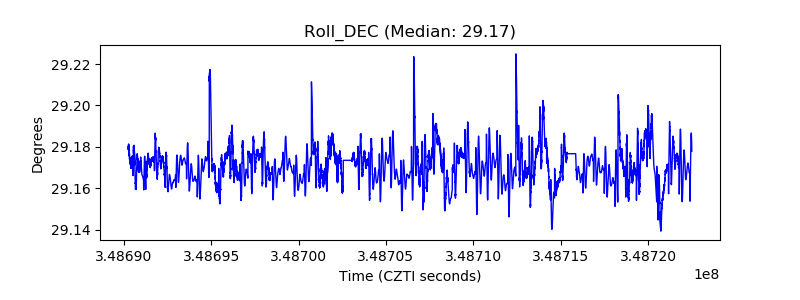 |
| _Roll_RA |  |
| Veto Counter | 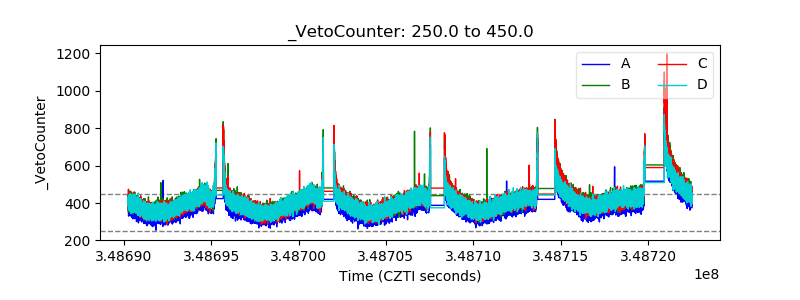 |