| Param | Original file | Final file |
|---|---|---|
| Filename | modeM0/AS1A10_123T03_9000004120_28716cztM0_level2.evt | modeM0/AS1A10_123T03_9000004120_28716cztM0_level2_quad_clean.evt |
| Size (bytes) | 499,092,480 | 102,496,320 |
| Size | 476.0 MB | 97.7 MB |
| Events in quadrant A | 3,313,922 | 683,483 |
| Events in quadrant B | 3,361,272 | 691,579 |
| Events in quadrant C | 3,345,206 | 652,820 |
| Events in quadrant D | 4,651,901 | 621,208 |
| Mode M0 | |||
|---|---|---|---|
| Quadrant | BADHDUFLAG | Total packets | Discarded packets |
| A | 0 | 13694 | 2 |
| B | 0 | 13850 | 2 |
| C | 0 | 13818 | 2 |
| D | 0 | 18146 | 2 |
| Mode SS | |||
|---|---|---|---|
| Quadrant | BADHDUFLAG | Total packets | Discarded packets |
| A | 0 | 132 | 0 |
| B | 0 | 132 | 0 |
| C | 0 | 132 | 0 |
| D | 0 | 132 | 0 |
| Mode M9 | |||
|---|---|---|---|
| Quadrant | BADHDUFLAG | Total packets | Discarded packets |
| A | 0 | 12 | 0 |
| B | 0 | 13 | 0 |
| C | 0 | 13 | 0 |
| D | 0 | 13 | 0 |
| Quadrant | Total seconds | Saturated seconds | Saturation percentage |
|---|---|---|---|
| A | 6524 | 44 | 0.674433% |
| B | 6524 | 67 | 1.026977% |
| C | 6524 | 100 | 1.532802% |
| D | 6524 | 333 | 5.104231% |
Noise dominated data is calculated using 1-second bins in cleaned event files. If a bin has >2000 counts, and if more than 50% of those come from <1% of pixels, then it is considered to be noise-dominated and hence unusable.
| Quadrant | # 1 sec bins | Bins with >0 counts | Bins with >2000 counts | High rate bins dominated by noise | Noise dominated (total time) | Noise dominated (detector-on time) | Marked lightcurve |
|---|---|---|---|---|---|---|---|
| A | 7734 | 6524 | 0 | 0 | 0.00% | 0.00% | 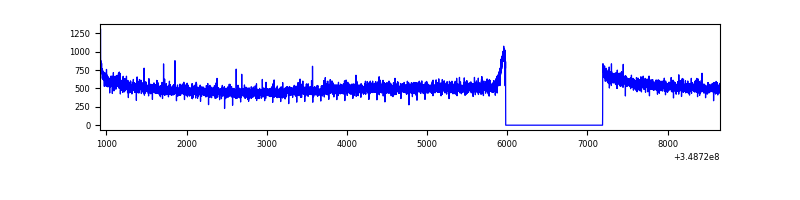 |
| B | 7734 | 6524 | 4 | 4 | 0.05% | 0.06% | 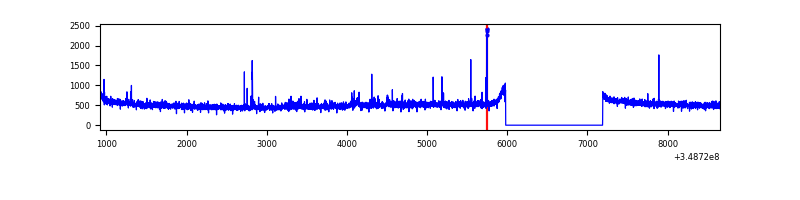 |
| C | 7734 | 6524 | 2 | 2 | 0.03% | 0.03% |  |
| D | 7734 | 6524 | 312 | 312 | 4.03% | 4.78% | 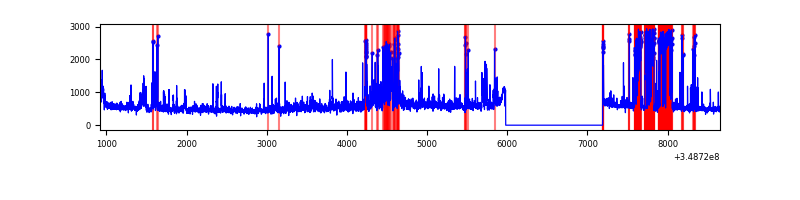 |
Top three noisy pixels from each quadrant. If the there are fewer than three noisy pixels in the level2.evt file, extra rows are filled as -1
| Pixel properties | Quadrant properties | ||||||
|---|---|---|---|---|---|---|---|
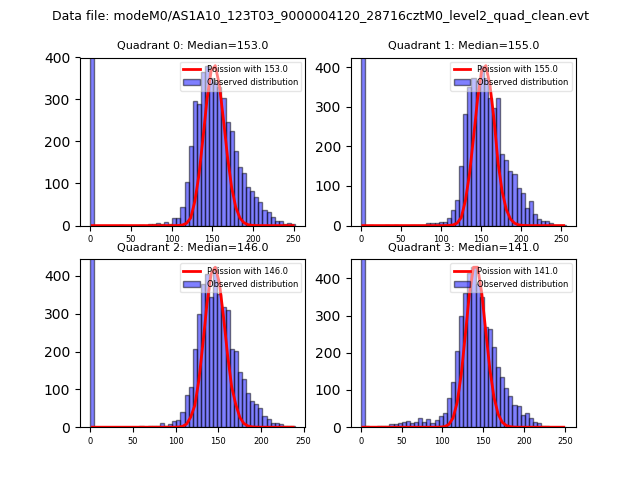
| Quadrant | DetID | PixID | Counts | Sigma | Mean | Median | Sigma |
| A | 13 | 254 | 11189 | 60.83 | 857 | 843 | 170.1 |
| A | 3 | 137 | 7696 | 40.3 | 857 | 843 | 170.1 |
| A | 0 | 226 | 7402 | 38.57 | 857 | 843 | 170.1 |
| B | 12 | 111 | 19204 | 115.91 | 843 | 822 | 158.6 |
| B | 10 | 247 | 17881 | 107.57 | 843 | 822 | 158.6 |
| B | 11 | 111 | 17272 | 103.73 | 843 | 822 | 158.6 |
| C | 14 | 238 | 145122 | 771.58 | 808 | 814 | 187.0 |
| C | 14 | 254 | 19636 | 100.64 | 808 | 814 | 187.0 |
| C | 3 | 233 | 15751 | 79.86 | 808 | 814 | 187.0 |
| D | 1 | 52 | 843029 | 4491.33 | 802 | 782 | 187.5 |
| D | 8 | 195 | 362570 | 1929.26 | 802 | 782 | 187.5 |
| D | 12 | 233 | 278399 | 1480.41 | 802 | 782 | 187.5 |
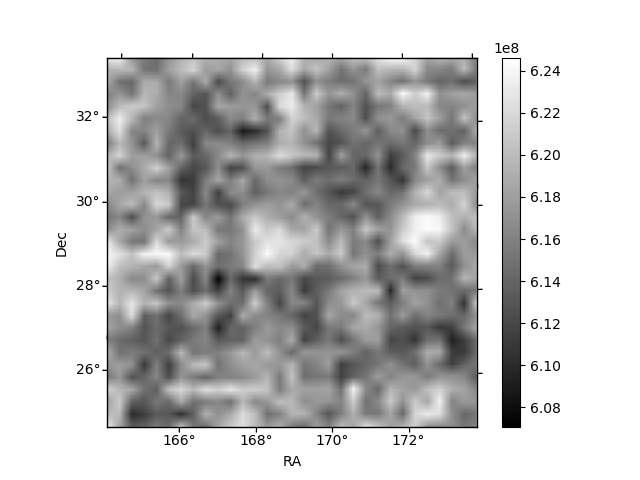
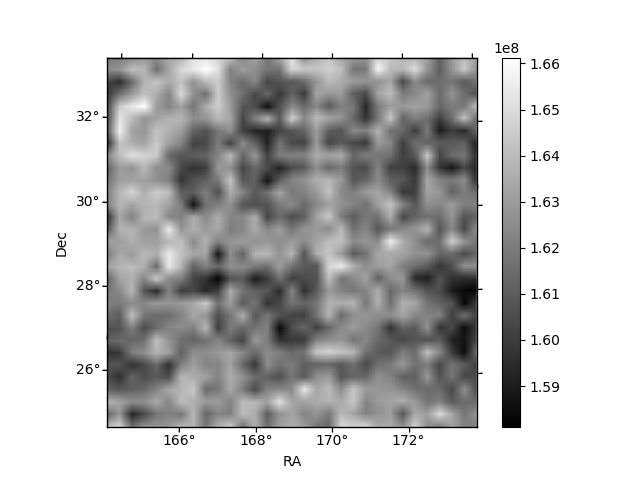
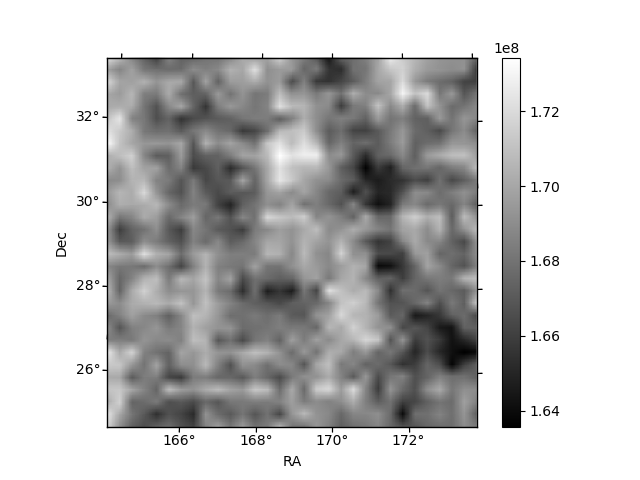
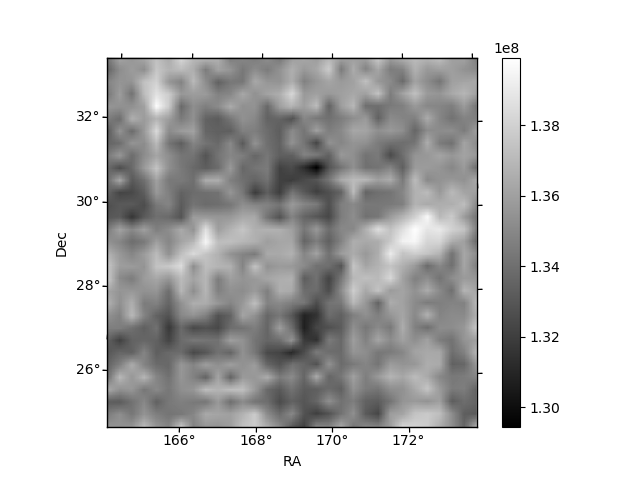
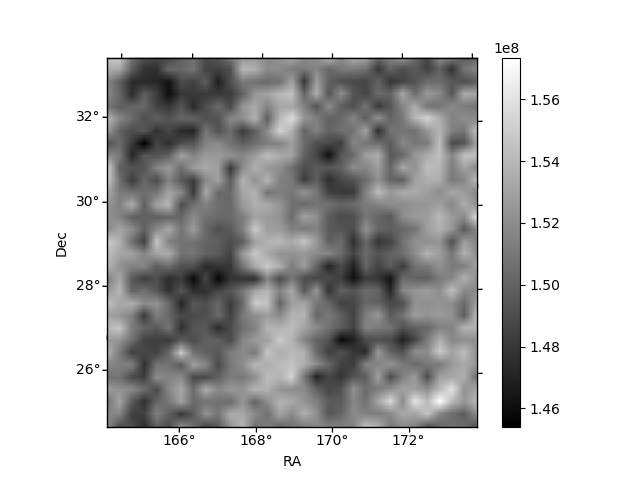
Histogram calculated using DETX and DETY for each event in the final _common_clean file
| Quadrant A |  |
 |
Quadrant B |
|---|---|---|---|
| Quadrant D |  |
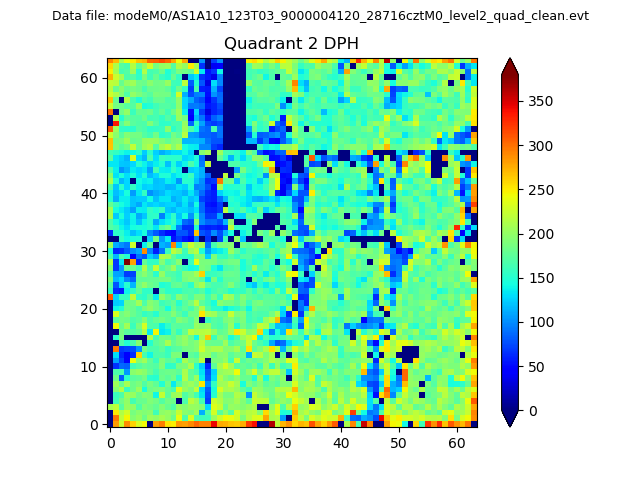 |
Quadrant C |
| Plot type | Count rate plots | Images |
|---|---|---|
| Comparison with Poisson distribution Blue bars denote a histogram of data divided into 1 sec bins. Red curve is a Poisson curve with rate = median count rate of data. |
 |
 |
| Quadrant-wise count rates Data is divided into 100 sec bins |
 |
|
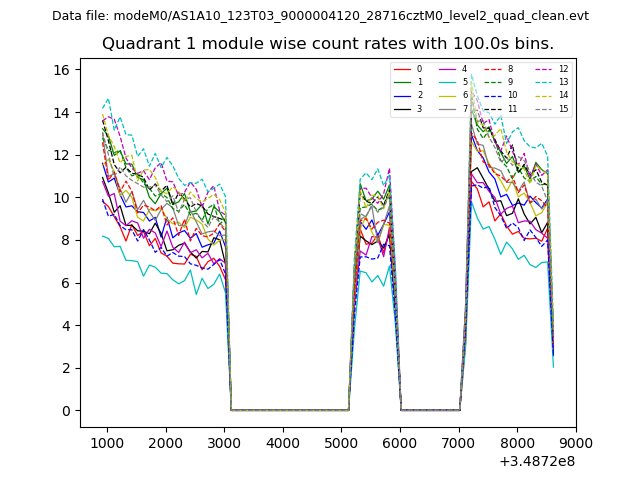
| Module-wise count rates for Quadrant A Data is divided into 100 sec bins |
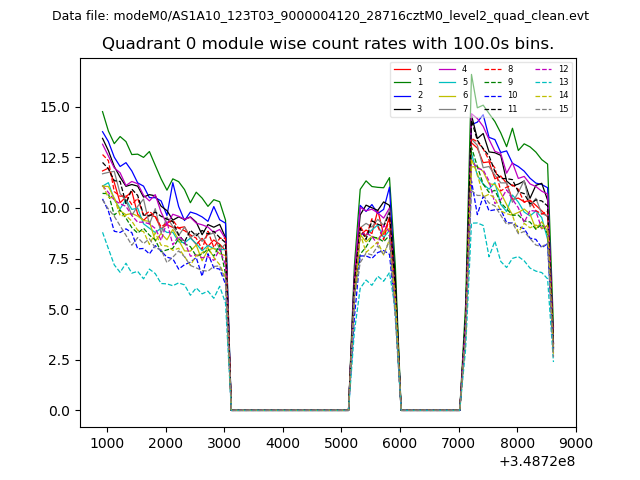 |
 |
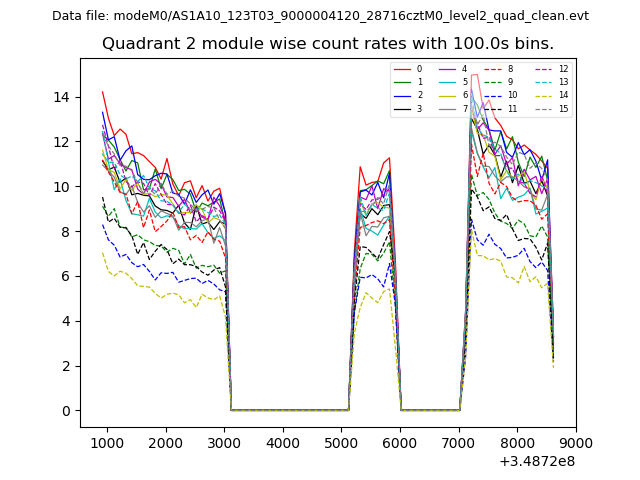
| Module-wise count rates for Quadrant B Data is divided into 100 sec bins |
 |
 |
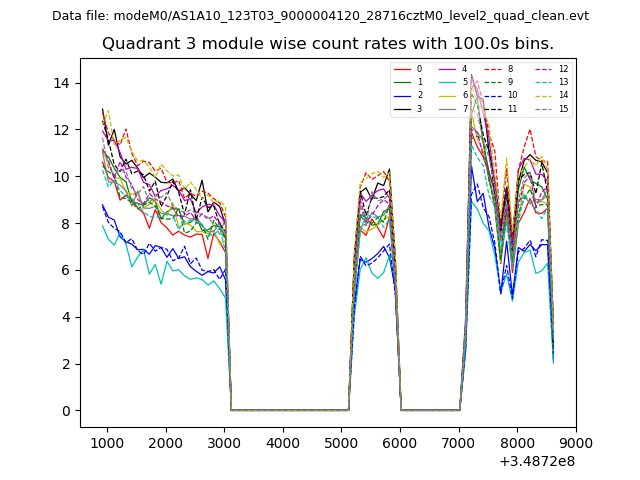
| Module-wise count rates for Quadrant C Data is divided into 100 sec bins |
 |
 |
| Module-wise count rates for Quadrant D Data is divided into 100 sec bins |
 |
 |
| Parameter | Plot |
|---|---|
| CZT HV Monitor | 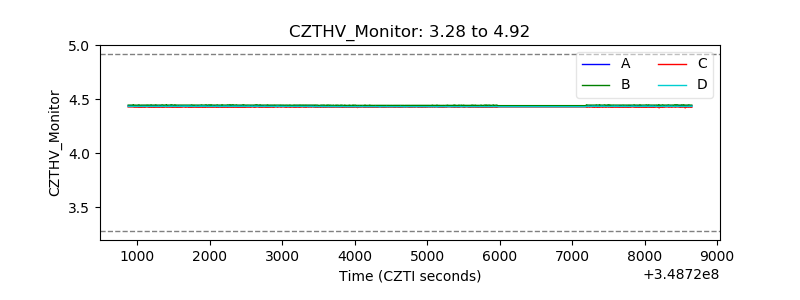 |
| D_VDD | 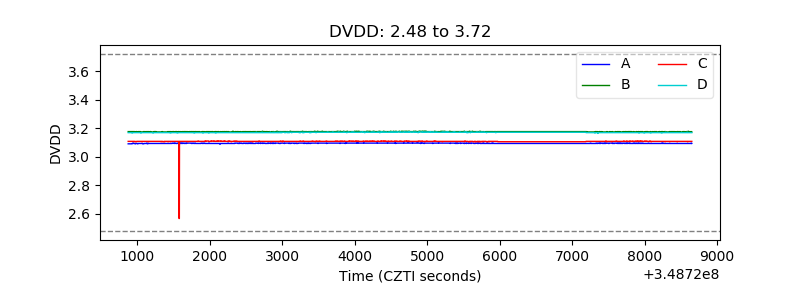 |
| Temperature 1 | 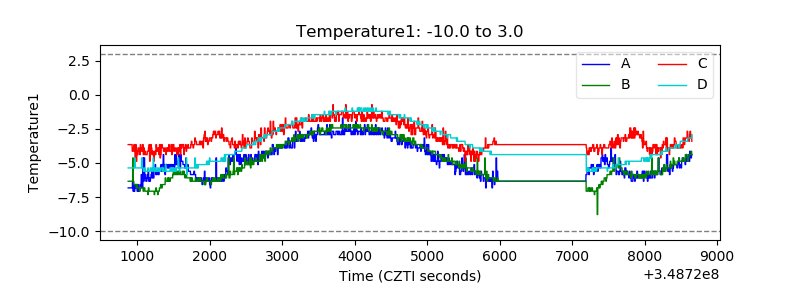 |
| Veto HV Monitor | 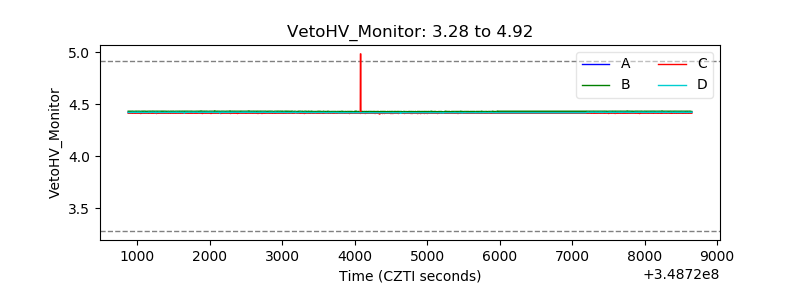 |
| Veto LLD | 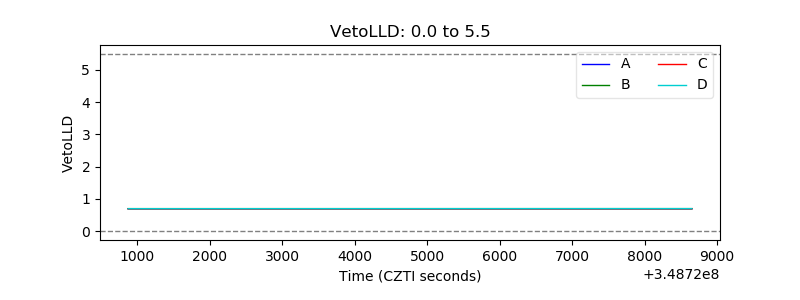 |
| Alpha Counter | 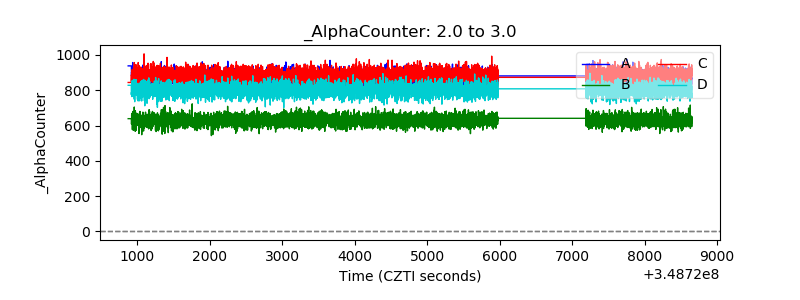 |
| _CPM_Rate | 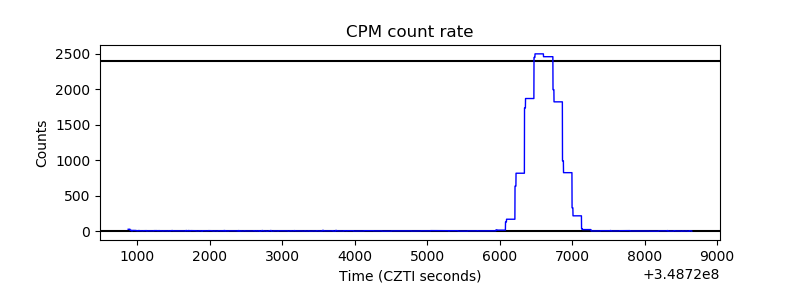 |
| CZT Counter | 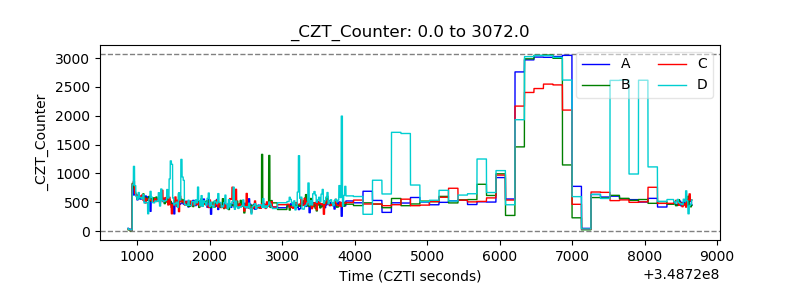 |
| +2.5 Volts monitor |  |
| +5 Volts monitor | 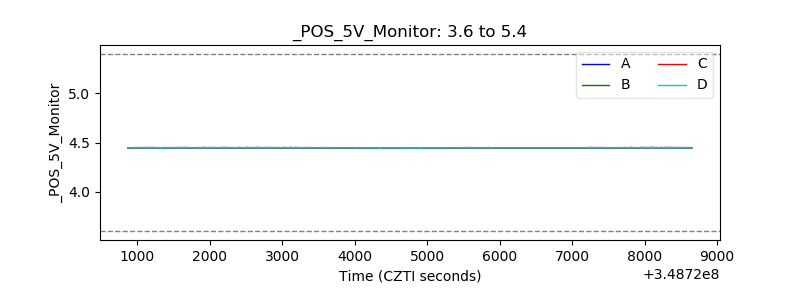 |
| _ROLL_ROT | 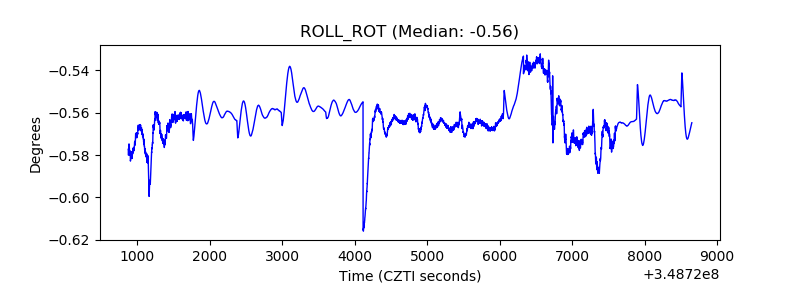 |
| _Roll_DEC | 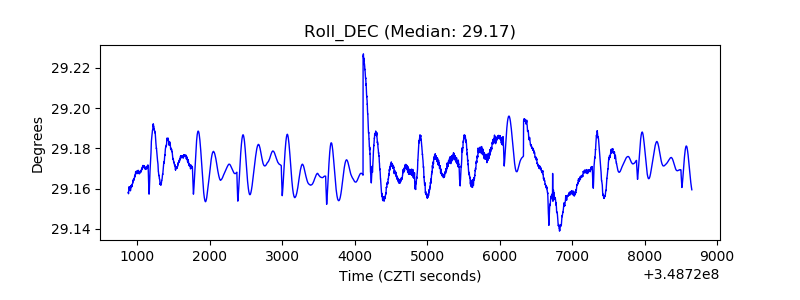 |
| _Roll_RA | 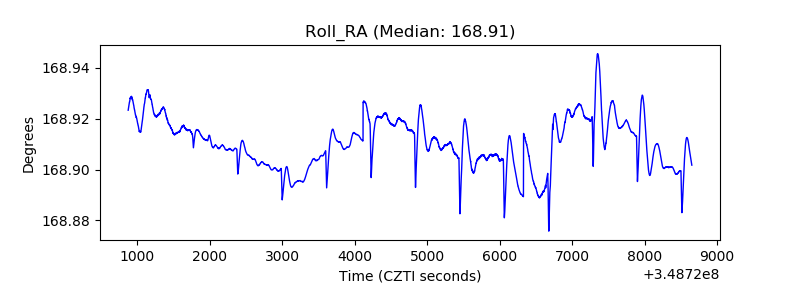 |
| Veto Counter | 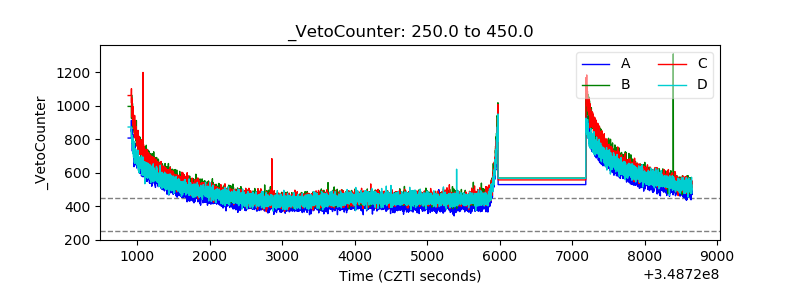 |