| Param | Original file | Final file |
|---|---|---|
| Filename | modeM0/AS1A10_123T03_9000004120_28717cztM0_level2.evt | modeM0/AS1A10_123T03_9000004120_28717cztM0_level2_quad_clean.evt |
| Size (bytes) | 498,628,800 | 99,987,840 |
| Size | 475.5 MB | 95.4 MB |
| Events in quadrant A | 3,305,259 | 674,528 |
| Events in quadrant B | 3,274,618 | 676,839 |
| Events in quadrant C | 3,362,437 | 639,982 |
| Events in quadrant D | 4,740,709 | 606,457 |
| Mode M0 | |||
|---|---|---|---|
| Quadrant | BADHDUFLAG | Total packets | Discarded packets |
| A | 0 | 13326 | 1 |
| B | 0 | 13241 | 1 |
| C | 0 | 13556 | 1 |
| D | 0 | 18077 | 4 |
| Mode SS | |||
|---|---|---|---|
| Quadrant | BADHDUFLAG | Total packets | Discarded packets |
| A | 0 | 126 | 0 |
| B | 0 | 126 | 0 |
| C | 0 | 126 | 0 |
| D | 0 | 126 | 0 |
| Mode M9 | |||
|---|---|---|---|
| Quadrant | BADHDUFLAG | Total packets | Discarded packets |
| A | 0 | 13 | 0 |
| B | 0 | 13 | 0 |
| C | 0 | 13 | 0 |
| D | 0 | 13 | 0 |
| Quadrant | Total seconds | Saturated seconds | Saturation percentage |
|---|---|---|---|
| A | 6160 | 59 | 0.957792% |
| B | 6161 | 65 | 1.055024% |
| C | 6161 | 98 | 1.590651% |
| D | 6160 | 410 | 6.655844% |
Noise dominated data is calculated using 1-second bins in cleaned event files. If a bin has >2000 counts, and if more than 50% of those come from <1% of pixels, then it is considered to be noise-dominated and hence unusable.
| Quadrant | # 1 sec bins | Bins with >0 counts | Bins with >2000 counts | High rate bins dominated by noise | Noise dominated (total time) | Noise dominated (detector-on time) | Marked lightcurve |
|---|---|---|---|---|---|---|---|
| A | 7456 | 6160 | 0 | 0 | 0.00% | 0.00% |  |
| B | 7457 | 6161 | 1 | 1 | 0.01% | 0.02% | 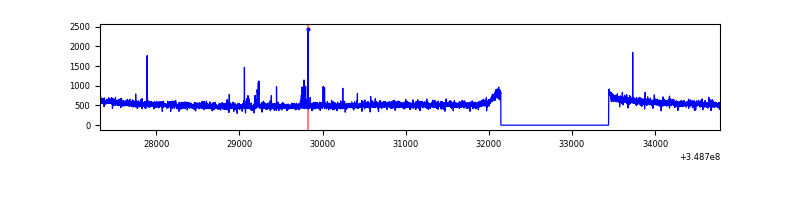 |
| C | 7457 | 6161 | 1 | 1 | 0.01% | 0.02% |  |
| D | 7455 | 6159 | 393 | 393 | 5.27% | 6.38% |  |
Top three noisy pixels from each quadrant. If the there are fewer than three noisy pixels in the level2.evt file, extra rows are filled as -1
| Pixel properties | Quadrant properties | ||||||
|---|---|---|---|---|---|---|---|
| Quadrant | DetID | PixID | Counts | Sigma | Mean | Median | Sigma |
| A | 13 | 254 | 10120 | 55.11 | 852 | 840 | 168.4 |
| A | 12 | 16 | 8918 | 47.98 | 852 | 840 | 168.4 |
| A | 0 | 226 | 7554 | 39.87 | 852 | 840 | 168.4 |
| B | 12 | 111 | 18094 | 112.26 | 828 | 810 | 154.0 |
| B | 11 | 111 | 16764 | 103.62 | 828 | 810 | 154.0 |
| B | 14 | 111 | 15461 | 95.16 | 828 | 810 | 154.0 |
| C | 14 | 238 | 136595 | 740.81 | 797 | 803 | 183.3 |
| C | 3 | 233 | 81354 | 439.45 | 797 | 803 | 183.3 |
| C | 10 | 22 | 24575 | 129.69 | 797 | 803 | 183.3 |
| D | 1 | 52 | 903127 | 4857.42 | 797 | 780 | 185.8 |
| D | 7 | 80 | 509187 | 2736.81 | 797 | 780 | 185.8 |
| D | 8 | 195 | 248224 | 1332.02 | 797 | 780 | 185.8 |
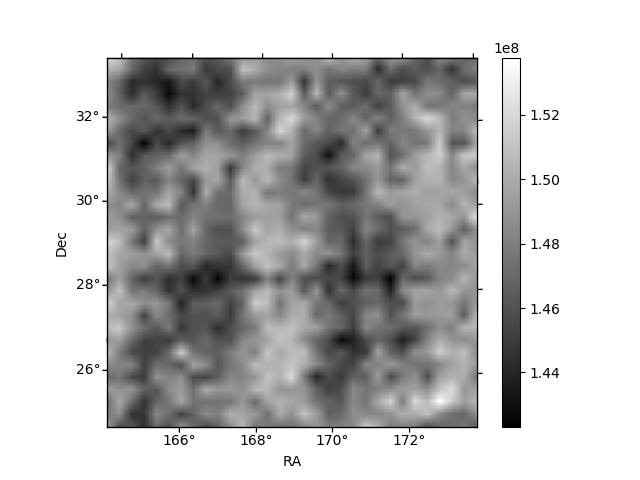
Histogram calculated using DETX and DETY for each event in the final _common_clean file
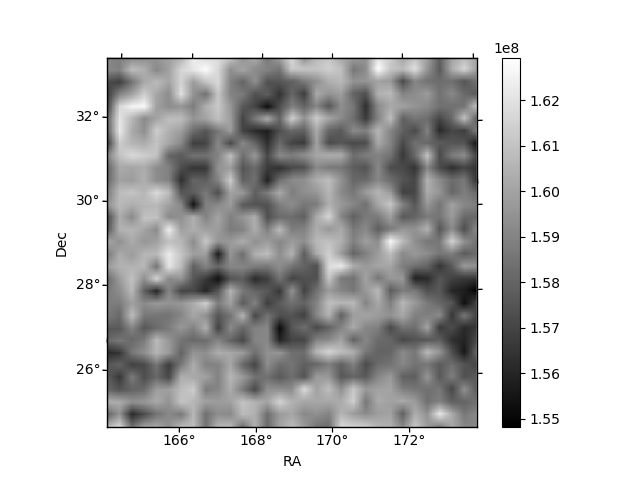
| Quadrant A | 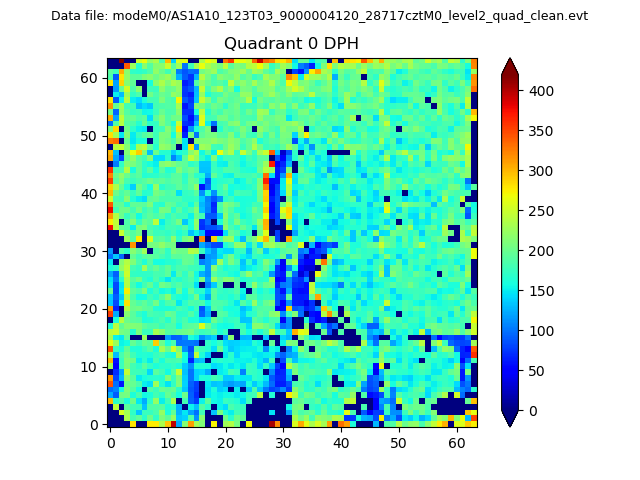 |
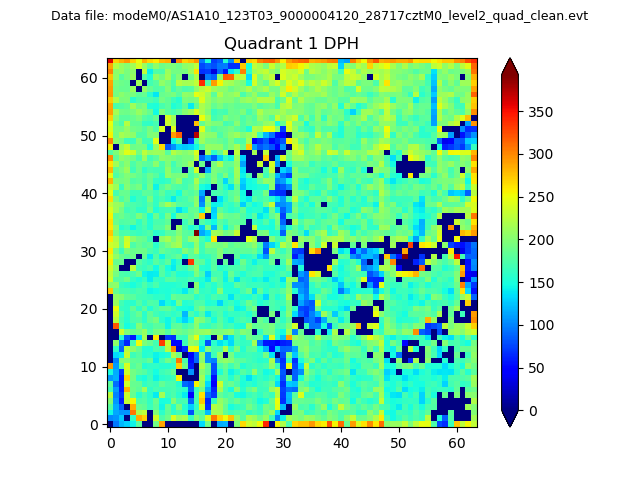 |
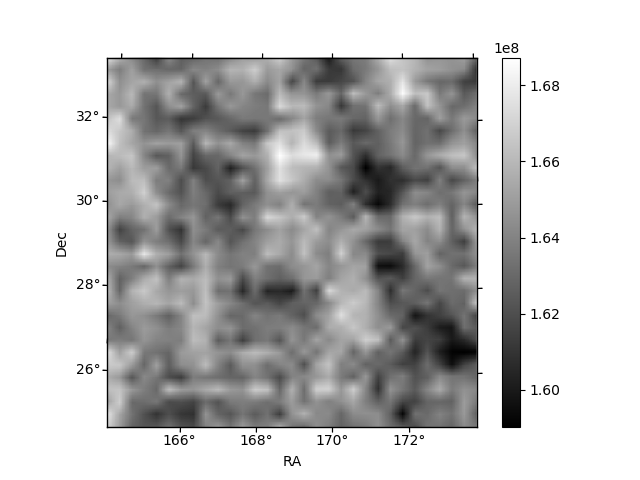
Quadrant B |
|---|---|---|---|
| Quadrant D | 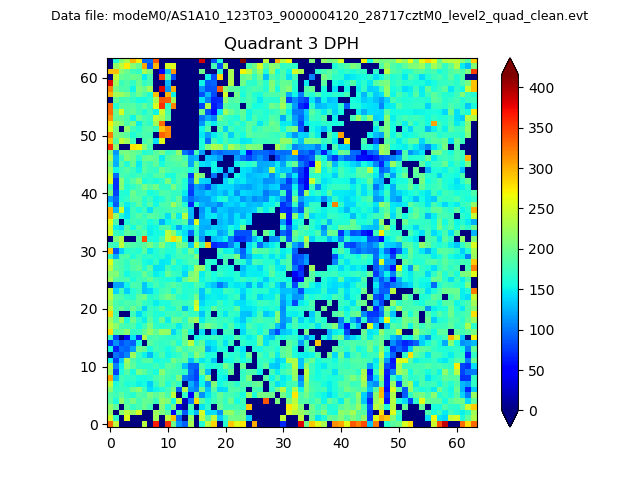 |
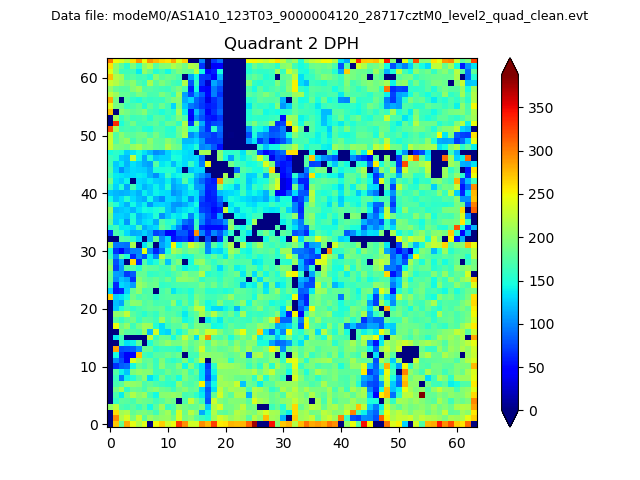 |
Quadrant C |
| Plot type | Count rate plots | Images |
|---|---|---|
| Comparison with Poisson distribution Blue bars denote a histogram of data divided into 1 sec bins. Red curve is a Poisson curve with rate = median count rate of data. |
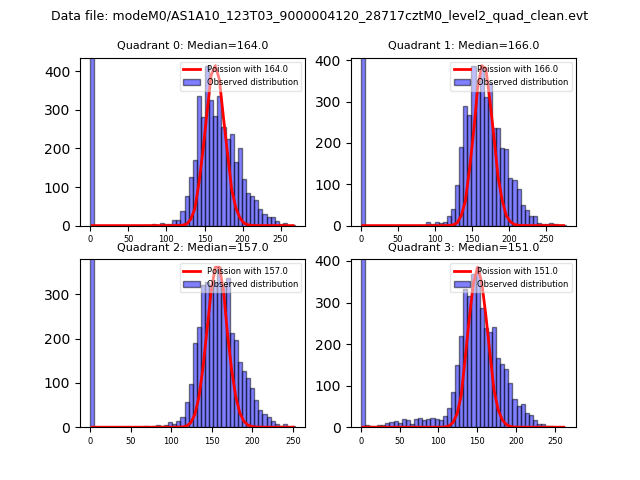 |
 |
| Quadrant-wise count rates Data is divided into 100 sec bins |
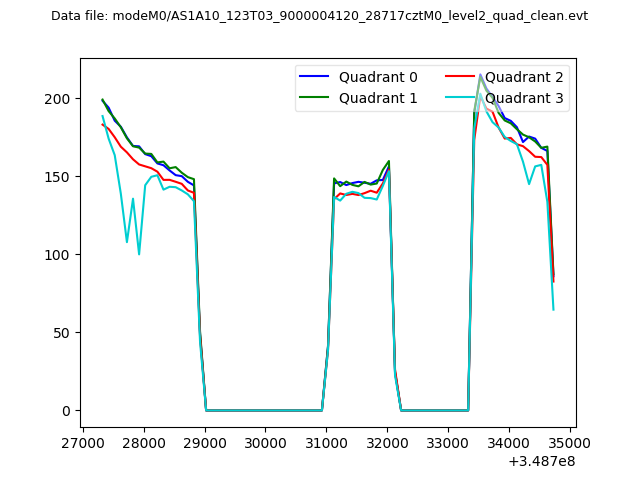 |
|
| Module-wise count rates for Quadrant A Data is divided into 100 sec bins |
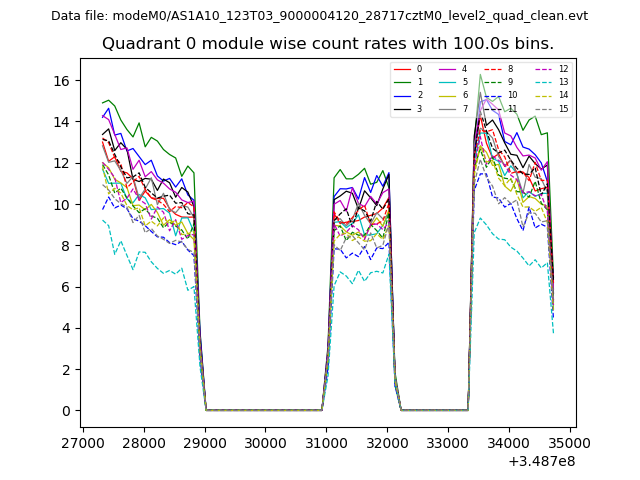 |
 |
| Module-wise count rates for Quadrant B Data is divided into 100 sec bins |
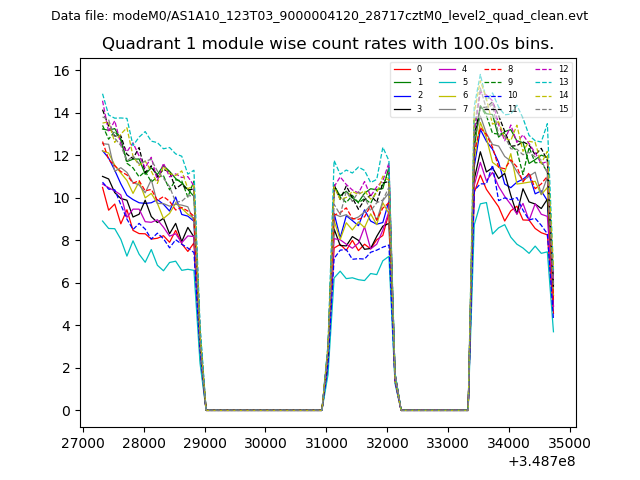 |
 |
| Module-wise count rates for Quadrant C Data is divided into 100 sec bins |
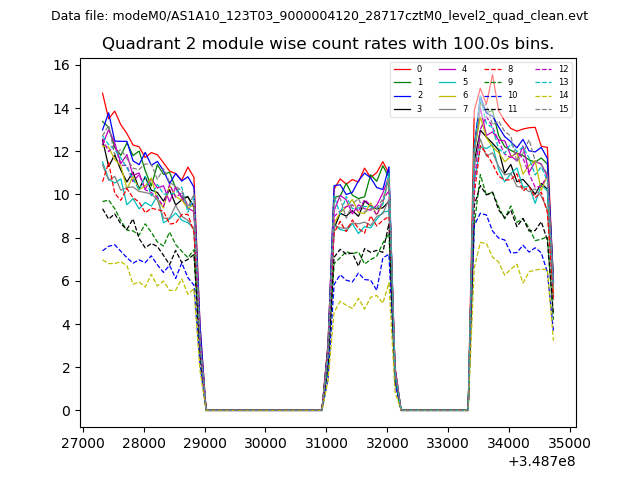 |
 |
| Module-wise count rates for Quadrant D Data is divided into 100 sec bins |
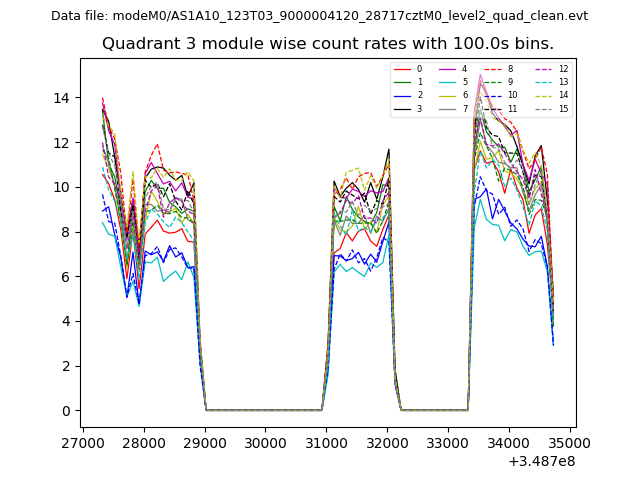 |
 |
| Parameter | Plot |
|---|---|
| CZT HV Monitor | 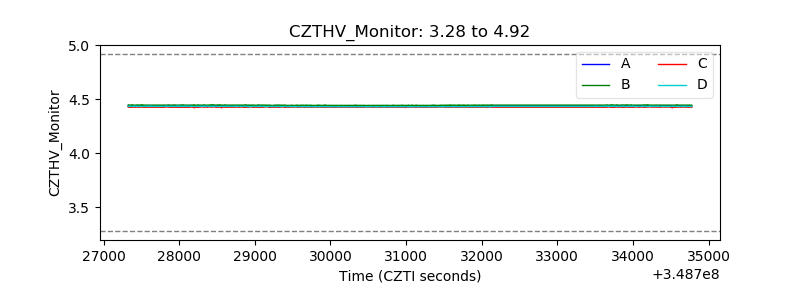 |
| D_VDD | 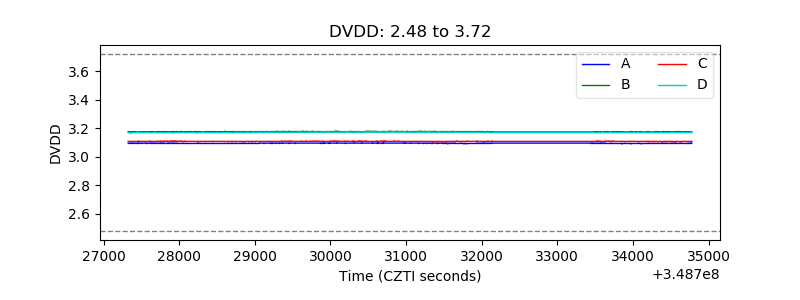 |
| Temperature 1 | 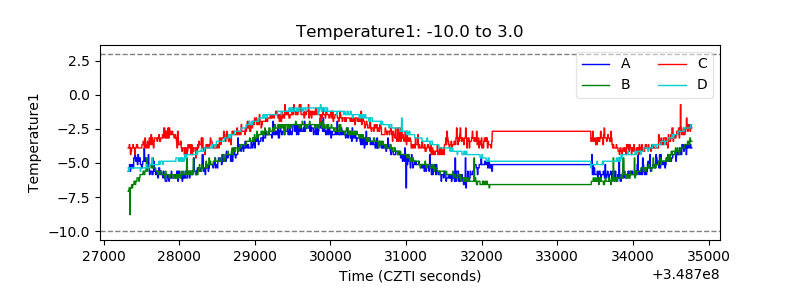 |
| Veto HV Monitor | 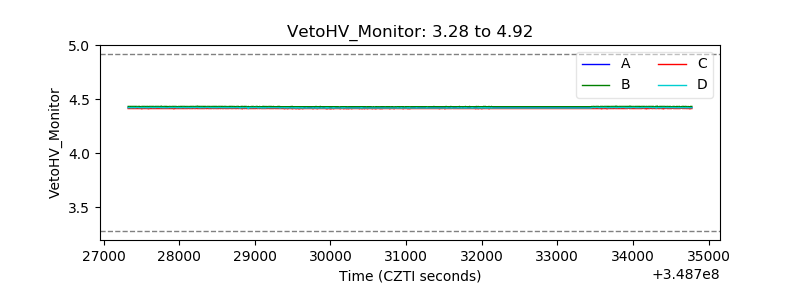 |
| Veto LLD | 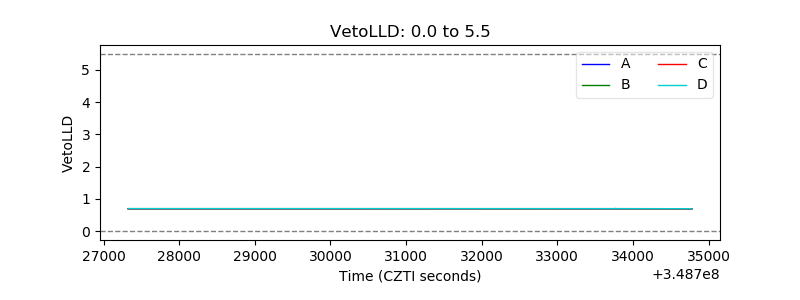 |
| Alpha Counter | 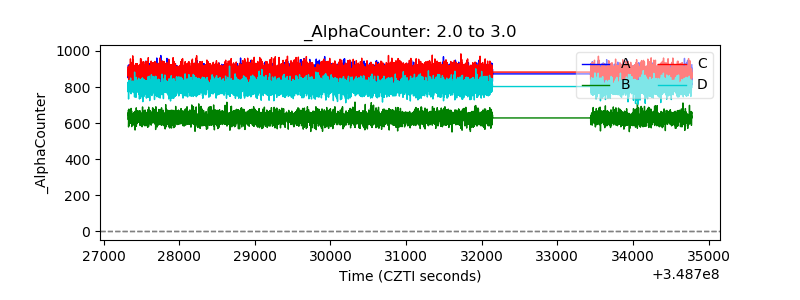 |
| _CPM_Rate | 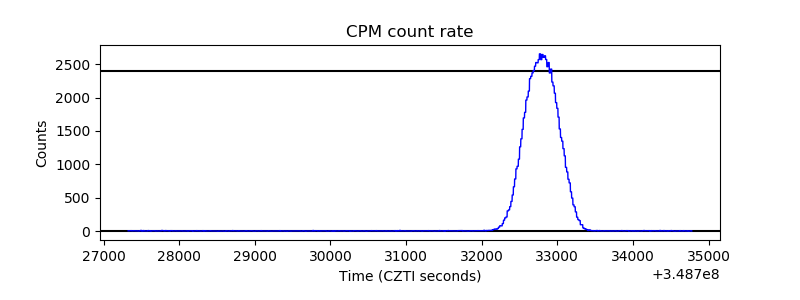 |
| CZT Counter | 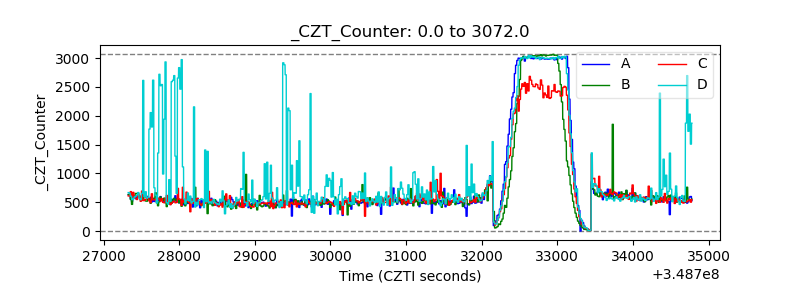 |
| +2.5 Volts monitor |  |
| +5 Volts monitor |  |
| _ROLL_ROT | 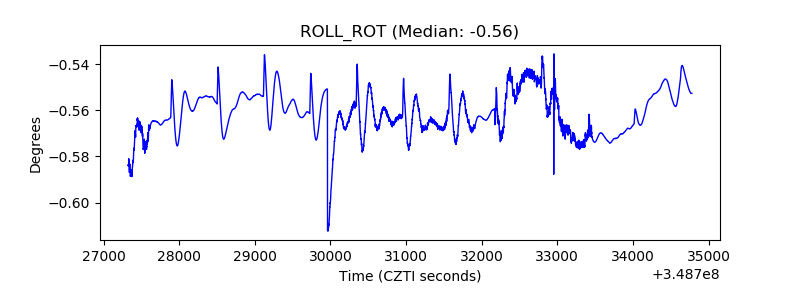 |
| _Roll_DEC | 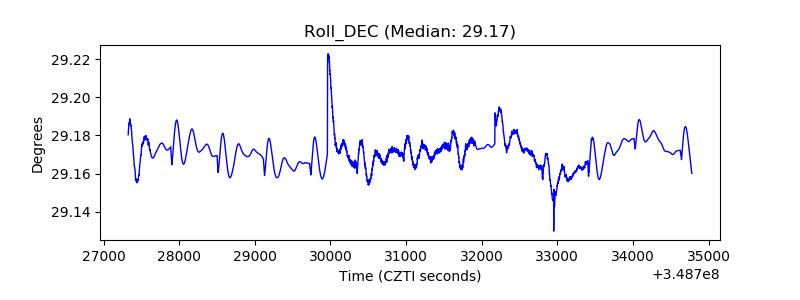 |
| _Roll_RA | 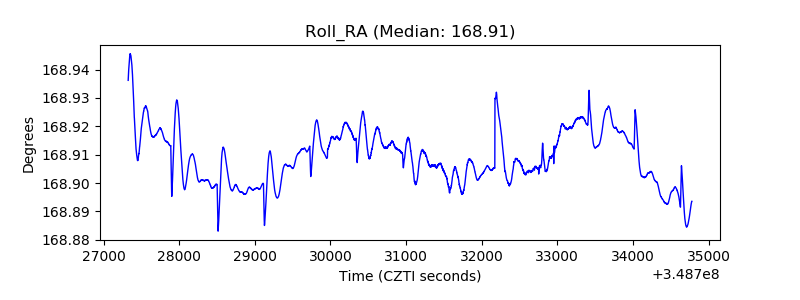 |
| Veto Counter | 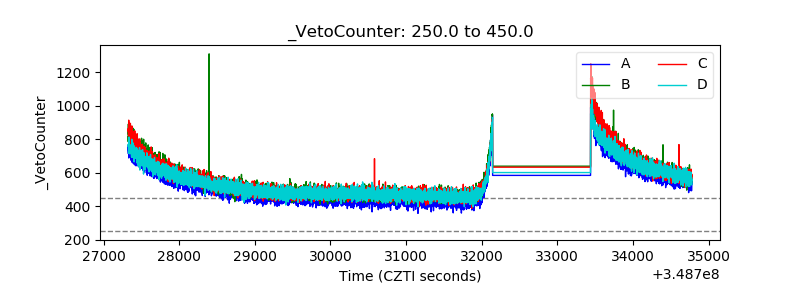 |