| Param | Original file | Final file |
|---|---|---|
| Filename | modeM0/AS1A10_123T03_9000004120_28718cztM0_level2.evt | modeM0/AS1A10_123T03_9000004120_28718cztM0_level2_quad_clean.evt |
| Size (bytes) | 488,010,240 | 83,289,600 |
| Size | 465.4 MB | 79.4 MB |
| Events in quadrant A | 3,126,603 | 547,804 |
| Events in quadrant B | 3,122,074 | 550,659 |
| Events in quadrant C | 3,210,147 | 519,939 |
| Events in quadrant D | 4,932,927 | 504,122 |
| Mode M0 | |||
|---|---|---|---|
| Quadrant | BADHDUFLAG | Total packets | Discarded packets |
| A | 0 | 12527 | 1 |
| B | 0 | 12500 | 1 |
| C | 0 | 12838 | 1 |
| D | 0 | 18666 | 1 |
| Mode SS | |||
|---|---|---|---|
| Quadrant | BADHDUFLAG | Total packets | Discarded packets |
| A | 0 | 118 | 0 |
| B | 0 | 118 | 0 |
| C | 0 | 118 | 0 |
| D | 0 | 118 | 0 |
| Mode M9 | |||
|---|---|---|---|
| Quadrant | BADHDUFLAG | Total packets | Discarded packets |
| A | 0 | 13 | 0 |
| B | 0 | 13 | 0 |
| C | 0 | 13 | 0 |
| D | 0 | 13 | 0 |
| Quadrant | Total seconds | Saturated seconds | Saturation percentage |
|---|---|---|---|
| A | 5710 | 96 | 1.681261% |
| B | 5710 | 91 | 1.593695% |
| C | 5710 | 135 | 2.364273% |
| D | 5710 | 481 | 8.423818% |
Noise dominated data is calculated using 1-second bins in cleaned event files. If a bin has >2000 counts, and if more than 50% of those come from <1% of pixels, then it is considered to be noise-dominated and hence unusable.
| Quadrant | # 1 sec bins | Bins with >0 counts | Bins with >2000 counts | High rate bins dominated by noise | Noise dominated (total time) | Noise dominated (detector-on time) | Marked lightcurve |
|---|---|---|---|---|---|---|---|
| A | 7020 | 5710 | 0 | 0 | 0.00% | 0.00% |  |
| B | 7020 | 5710 | 1 | 1 | 0.01% | 0.02% | 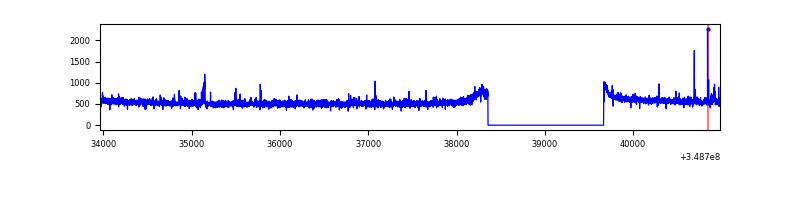 |
| C | 7020 | 5710 | 13 | 13 | 0.19% | 0.23% | 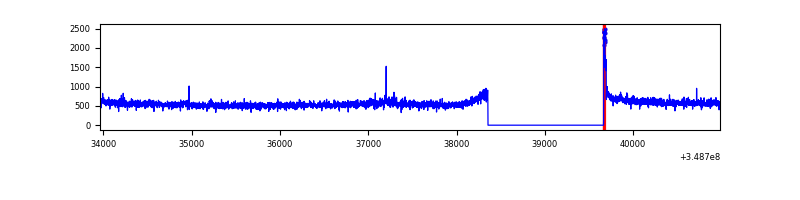 |
| D | 7020 | 5710 | 415 | 415 | 5.91% | 7.27% | 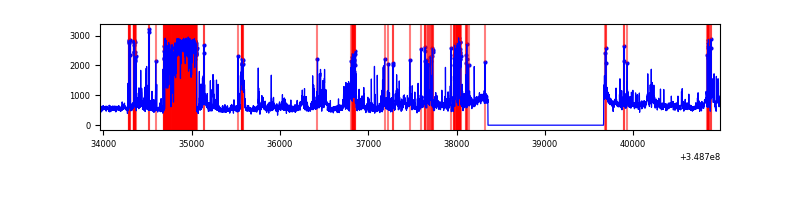 |
Top three noisy pixels from each quadrant. If the there are fewer than three noisy pixels in the level2.evt file, extra rows are filled as -1
| Pixel properties | Quadrant properties | ||||||
|---|---|---|---|---|---|---|---|
| Quadrant | DetID | PixID | Counts | Sigma | Mean | Median | Sigma |
| A | 13 | 254 | 9531 | 54.56 | 810 | 796 | 160.1 |
| A | 0 | 226 | 6979 | 38.62 | 810 | 796 | 160.1 |
| A | 3 | 137 | 6883 | 38.02 | 810 | 796 | 160.1 |
| B | 0 | 190 | 22651 | 149.0 | 786 | 770 | 146.9 |
| B | 12 | 111 | 17110 | 111.27 | 786 | 770 | 146.9 |
| B | 11 | 111 | 15742 | 101.95 | 786 | 770 | 146.9 |
| C | 3 | 233 | 135861 | 777.21 | 755 | 762 | 173.8 |
| C | 14 | 238 | 125544 | 717.86 | 755 | 762 | 173.8 |
| C | 13 | 61 | 5035 | 24.58 | 755 | 762 | 173.8 |
| D | 7 | 80 | 900339 | 5092.12 | 757 | 740 | 176.7 |
| D | 8 | 195 | 423897 | 2395.25 | 757 | 740 | 176.7 |
| D | 1 | 52 | 358201 | 2023.38 | 757 | 740 | 176.7 |
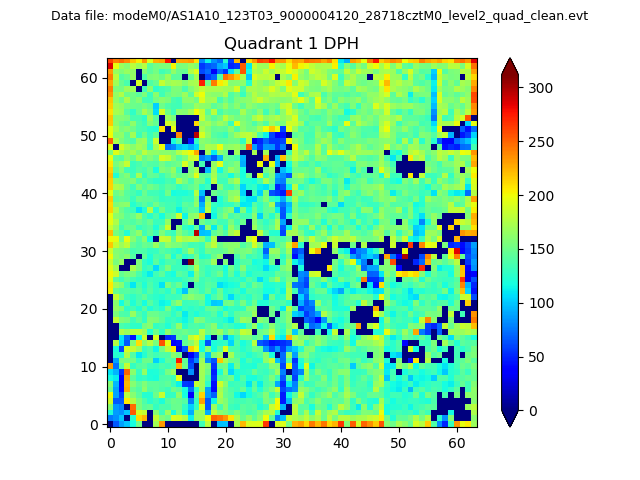
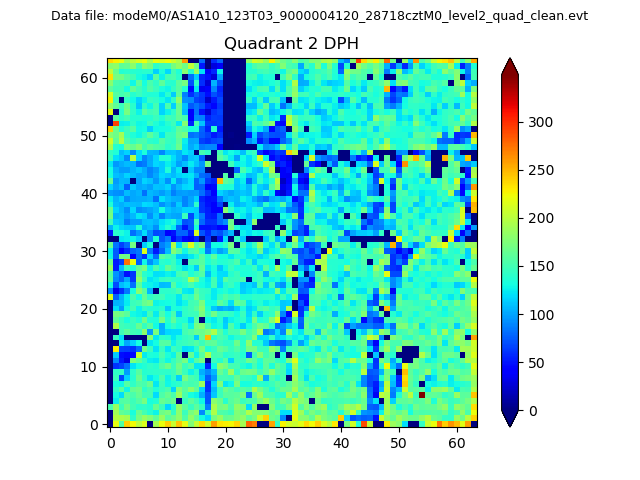
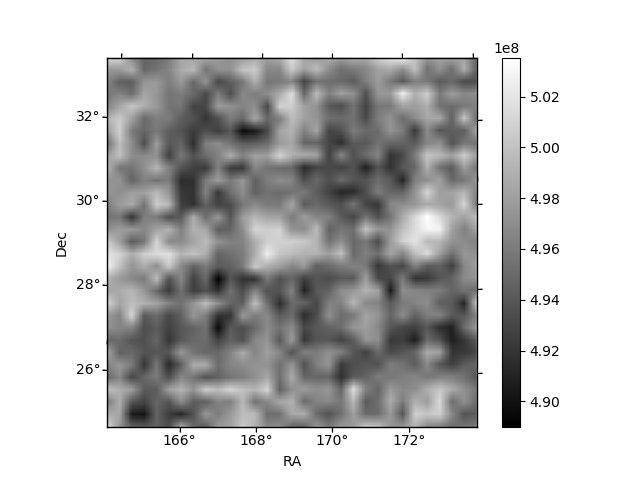
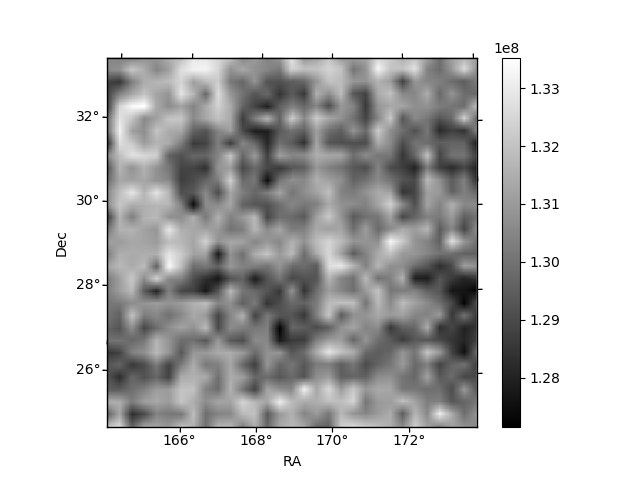
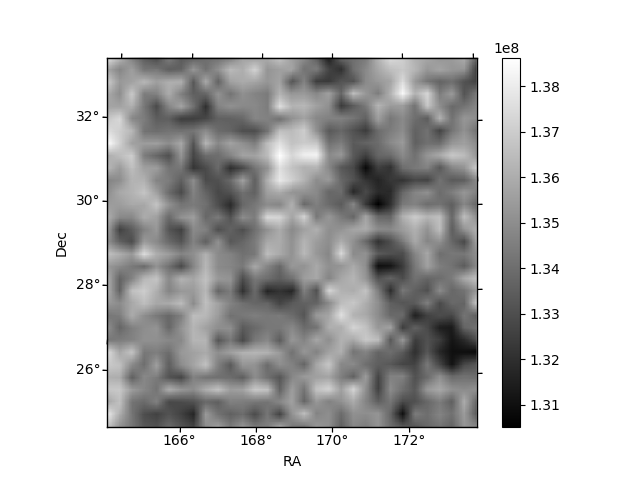
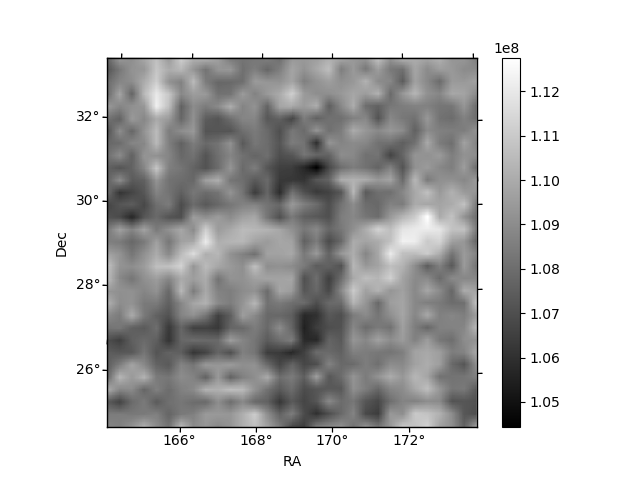
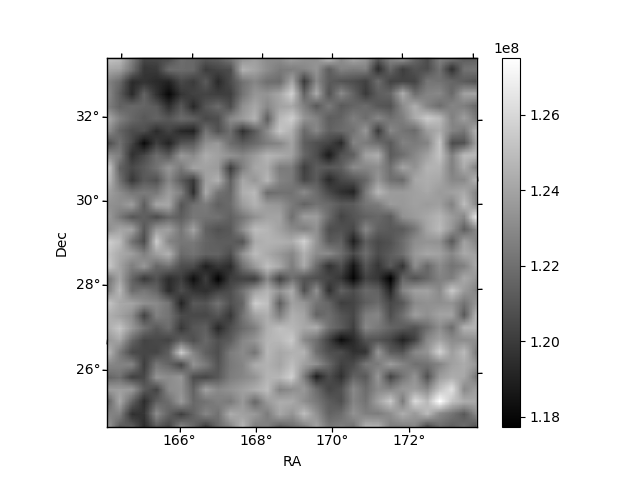
Histogram calculated using DETX and DETY for each event in the final _common_clean file
| Quadrant A | 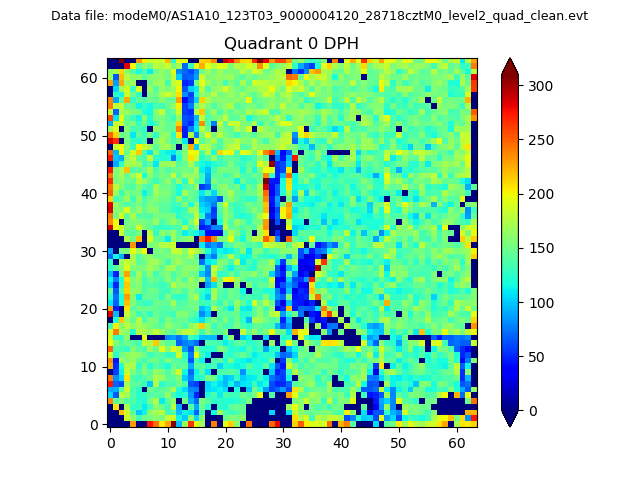 |
 |
Quadrant B |
|---|---|---|---|
| Quadrant D | 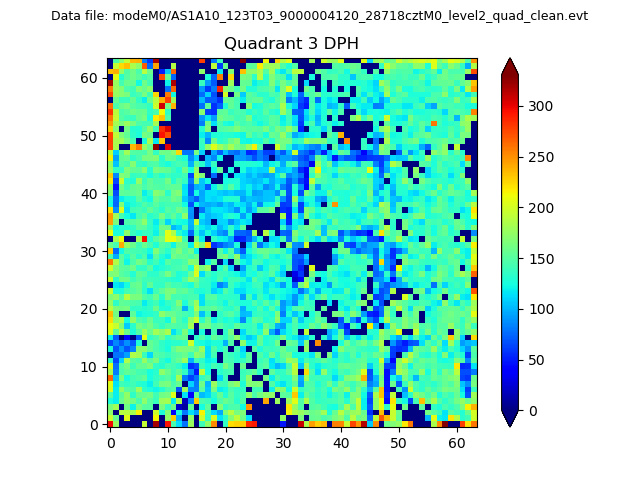 |
 |
Quadrant C |
| Plot type | Count rate plots | Images |
|---|---|---|
| Comparison with Poisson distribution Blue bars denote a histogram of data divided into 1 sec bins. Red curve is a Poisson curve with rate = median count rate of data. |
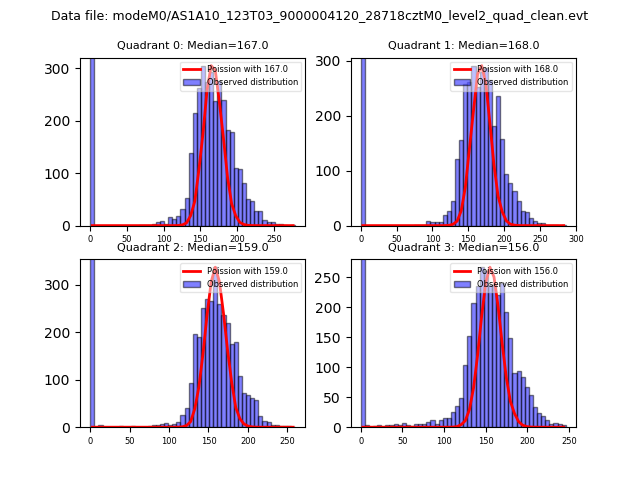 |
 |
| Quadrant-wise count rates Data is divided into 100 sec bins |
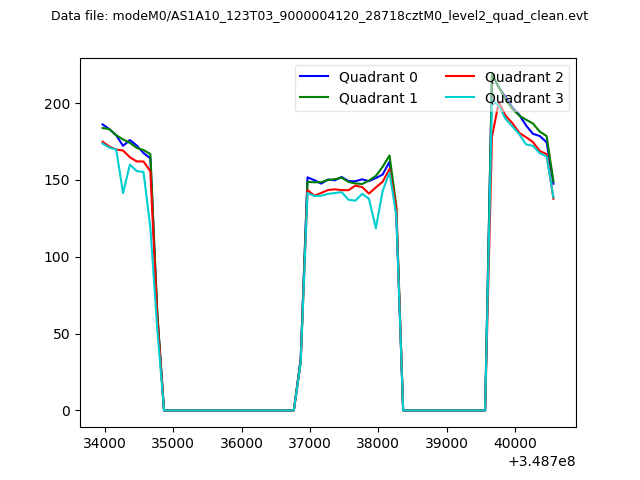 |
|
| Module-wise count rates for Quadrant A Data is divided into 100 sec bins |
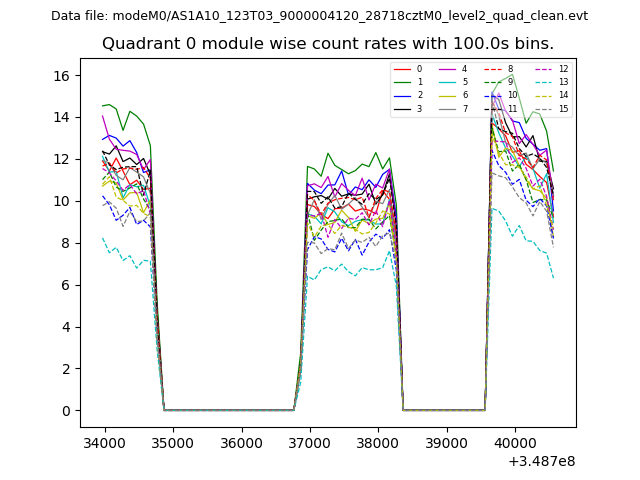 |
 |
| Module-wise count rates for Quadrant B Data is divided into 100 sec bins |
 |
 |
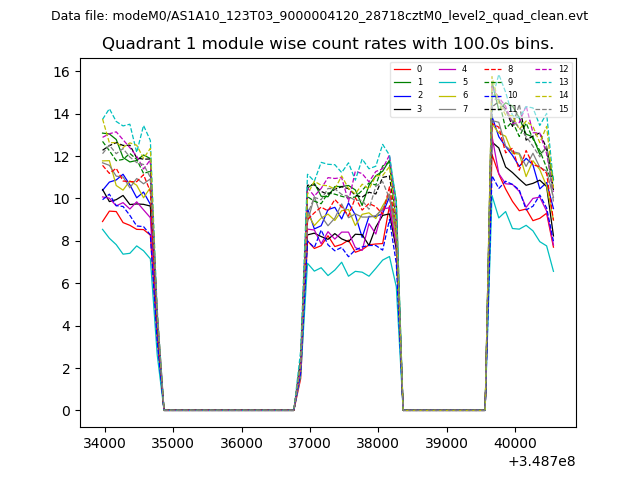
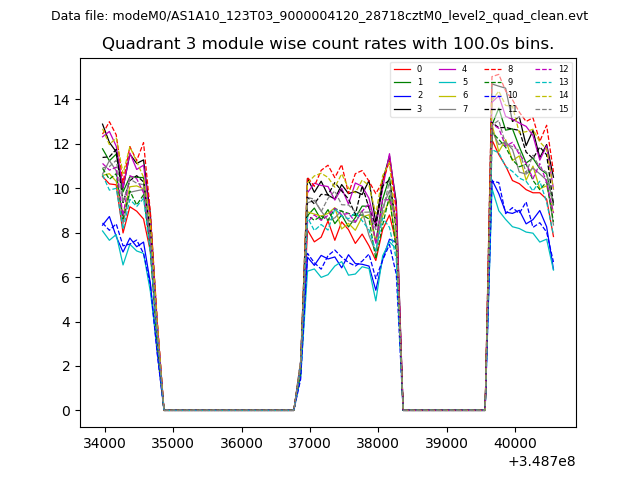
| Module-wise count rates for Quadrant C Data is divided into 100 sec bins |
 |
 |
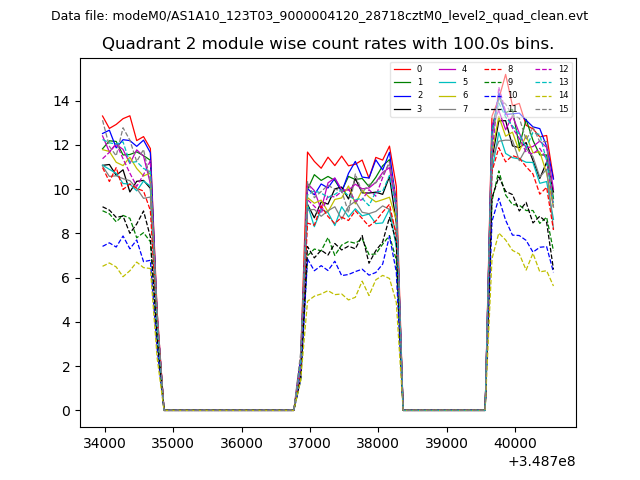
| Module-wise count rates for Quadrant D Data is divided into 100 sec bins |
 |
 |
| Parameter | Plot |
|---|---|
| CZT HV Monitor | 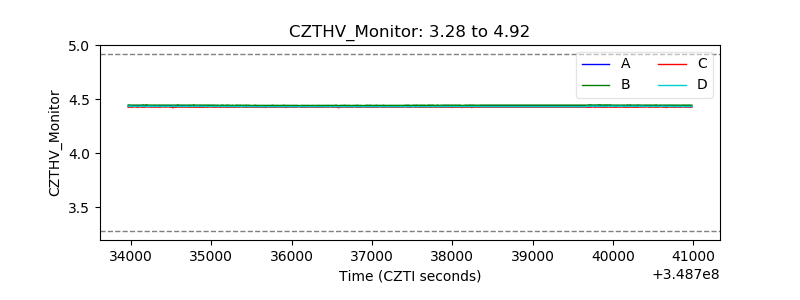 |
| D_VDD | 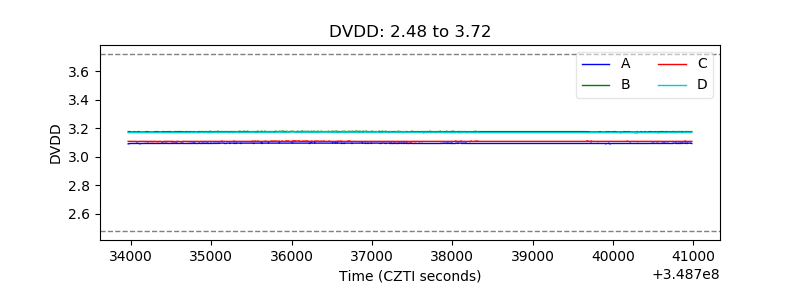 |
| Temperature 1 | 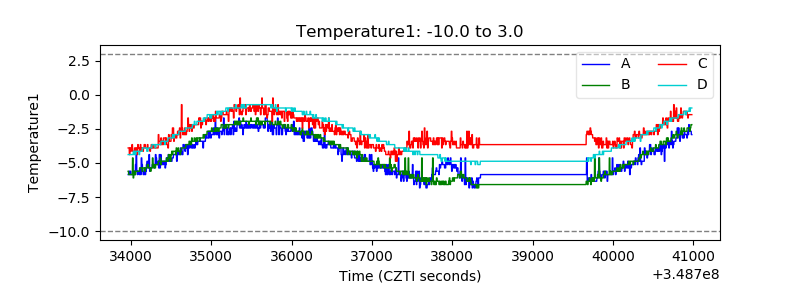 |
| Veto HV Monitor | 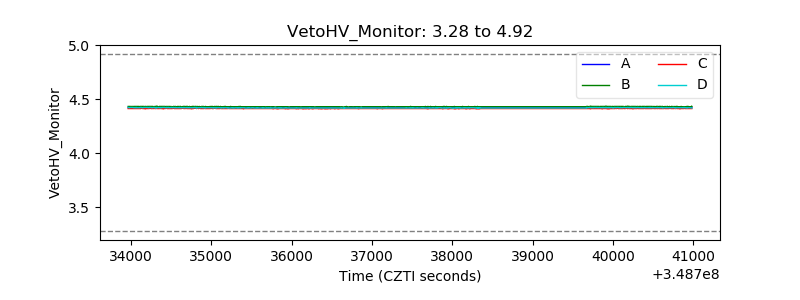 |
| Veto LLD | 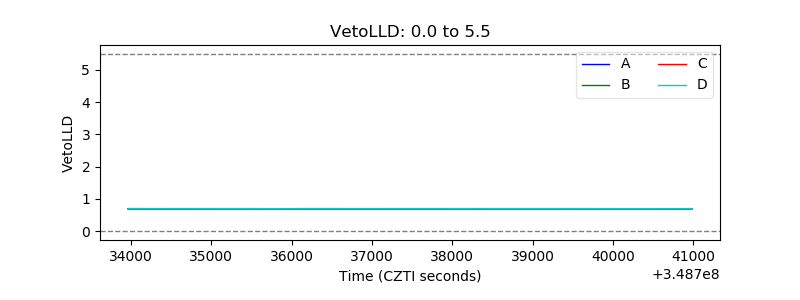 |
| Alpha Counter | 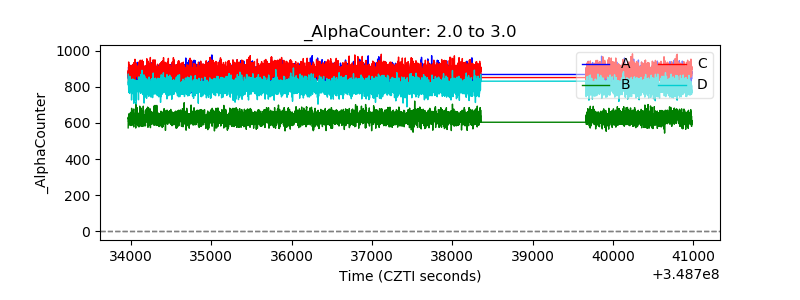 |
| _CPM_Rate | 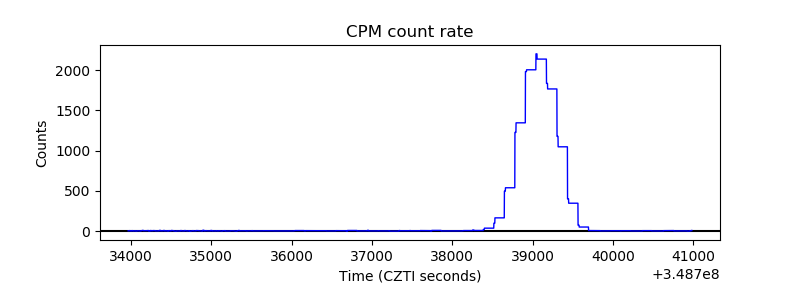 |
| CZT Counter | 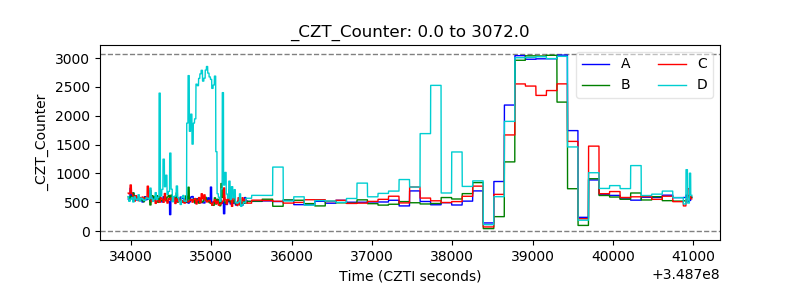 |
| +2.5 Volts monitor |  |
| +5 Volts monitor |  |
| _ROLL_ROT | 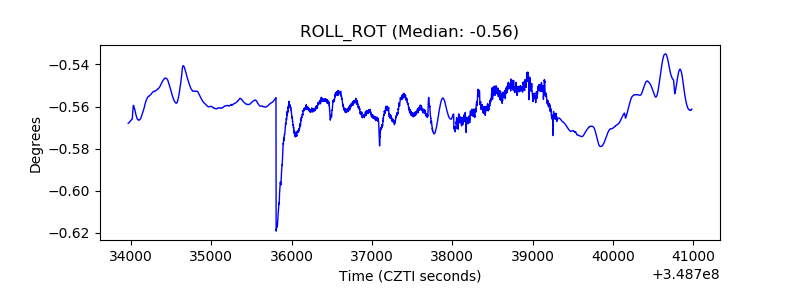 |
| _Roll_DEC | 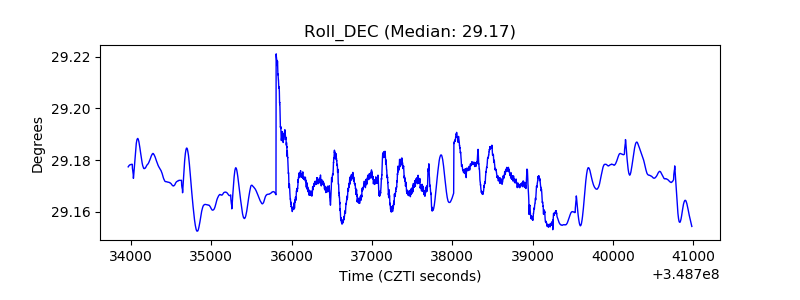 |
| _Roll_RA | 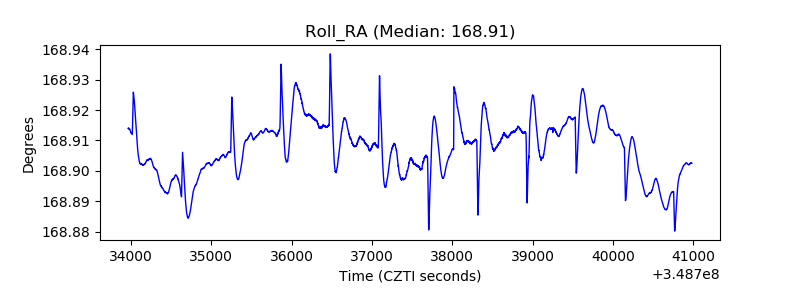 |
| Veto Counter | 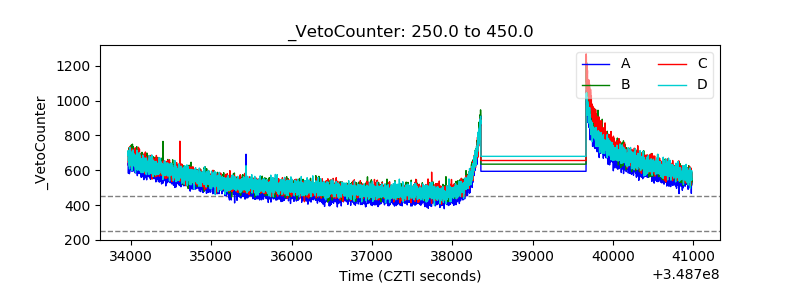 |