| Param | Original file | Final file |
|---|---|---|
| Filename | modeM0/AS1A10_123T03_9000004120_28719cztM0_level2.evt | modeM0/AS1A10_123T03_9000004120_28719cztM0_level2_quad_clean.evt |
| Size (bytes) | 335,364,480 | 42,811,200 |
| Size | 319.8 MB | 40.8 MB |
| Events in quadrant A | 2,002,169 | 266,968 |
| Events in quadrant B | 1,983,439 | 268,566 |
| Events in quadrant C | 2,160,611 | 251,516 |
| Events in quadrant D | 3,761,442 | 250,332 |
| Mode M0 | |||
|---|---|---|---|
| Quadrant | BADHDUFLAG | Total packets | Discarded packets |
| A | 0 | 8064 | 1 |
| B | 0 | 7994 | 1 |
| C | 0 | 8686 | 1 |
| D | 0 | 13829 | 1 |
| Mode SS | |||
|---|---|---|---|
| Quadrant | BADHDUFLAG | Total packets | Discarded packets |
| A | 0 | 74 | 0 |
| B | 0 | 74 | 0 |
| C | 0 | 74 | 0 |
| D | 0 | 74 | 0 |
| Mode M9 | |||
|---|---|---|---|
| Quadrant | BADHDUFLAG | Total packets | Discarded packets |
| A | 1 | 139925139077928 | 46 |
| B | 1 | -1 | -1 |
| C | 1 | -1 | -1 |
| D | 1 | -1 | -1 |
| Quadrant | Total seconds | Saturated seconds | Saturation percentage |
|---|---|---|---|
| A | 3650 | 15 | 0.410959% |
| B | 3650 | 15 | 0.410959% |
| C | 3650 | 55 | 1.506849% |
| D | 3650 | 468 | 12.821918% |
Noise dominated data is calculated using 1-second bins in cleaned event files. If a bin has >2000 counts, and if more than 50% of those come from <1% of pixels, then it is considered to be noise-dominated and hence unusable.
| Quadrant | # 1 sec bins | Bins with >0 counts | Bins with >2000 counts | High rate bins dominated by noise | Noise dominated (total time) | Noise dominated (detector-on time) | Marked lightcurve |
|---|---|---|---|---|---|---|---|
| A | 3650 | 3650 | 0 | 0 | 0.00% | 0.00% | 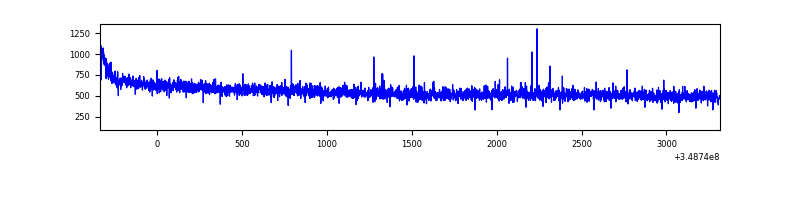 |
| B | 3650 | 3650 | 1 | 1 | 0.03% | 0.03% | 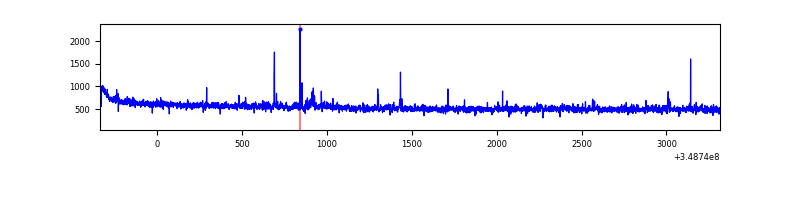 |
| C | 3650 | 3650 | 15 | 15 | 0.41% | 0.41% |  |
| D | 3650 | 3650 | 466 | 466 | 12.77% | 12.77% | 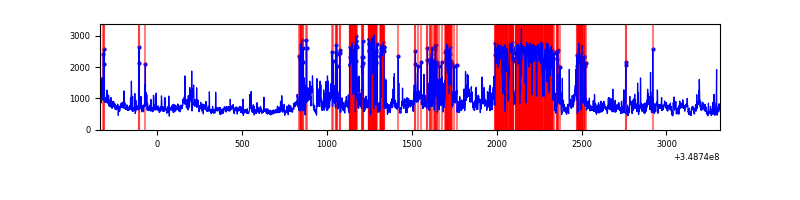 |
Top three noisy pixels from each quadrant. If the there are fewer than three noisy pixels in the level2.evt file, extra rows are filled as -1
| Pixel properties | Quadrant properties | ||||||
|---|---|---|---|---|---|---|---|
| Quadrant | DetID | PixID | Counts | Sigma | Mean | Median | Sigma |
| A | 13 | 254 | 6268 | 55.92 | 516 | 509 | 103.0 |
| A | 15 | 174 | 5391 | 47.41 | 516 | 509 | 103.0 |
| A | 0 | 226 | 4564 | 39.38 | 516 | 509 | 103.0 |
| B | 10 | 245 | 11071 | 112.88 | 499 | 489 | 93.7 |
| B | 12 | 111 | 10473 | 106.5 | 499 | 489 | 93.7 |
| B | 0 | 190 | 10223 | 103.84 | 499 | 489 | 93.7 |
| C | 3 | 233 | 200508 | 1794.9 | 480 | 484 | 111.4 |
| C | 14 | 238 | 80001 | 713.54 | 480 | 484 | 111.4 |
| C | 14 | 128 | 5431 | 44.39 | 480 | 484 | 111.4 |
| D | 1 | 52 | 724261 | 6493.92 | 470 | 458 | 111.5 |
| D | 12 | 233 | 722526 | 6478.36 | 470 | 458 | 111.5 |
| D | 8 | 195 | 460022 | 4123.18 | 470 | 458 | 111.5 |
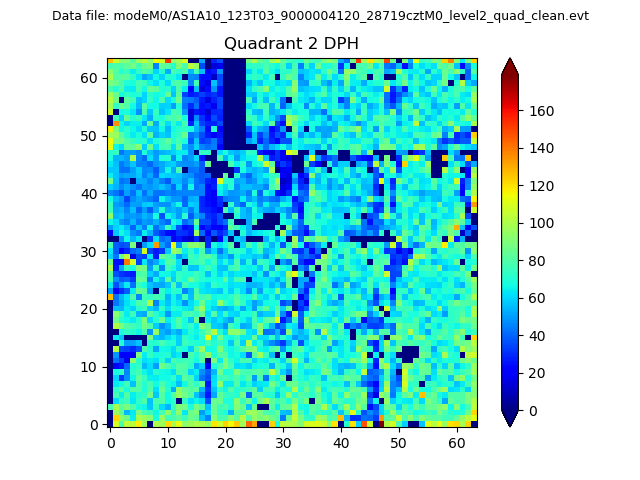
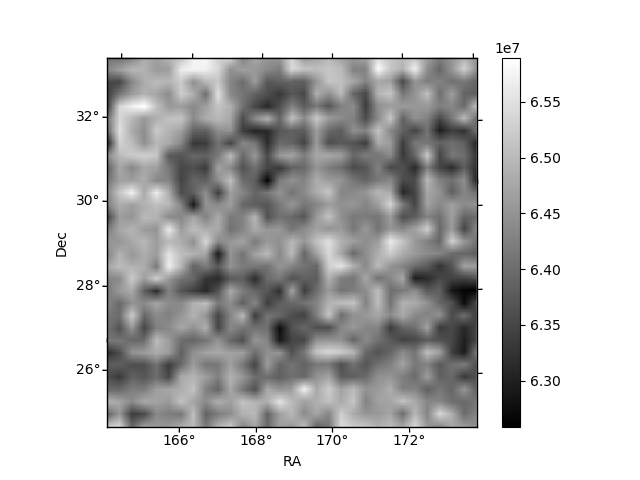
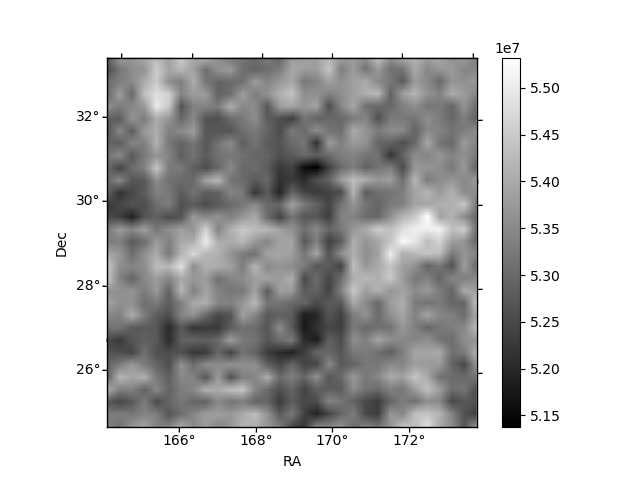
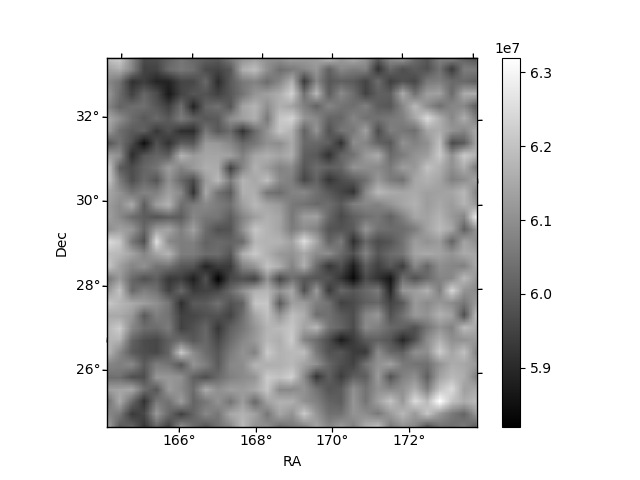
Histogram calculated using DETX and DETY for each event in the final _common_clean file
| Quadrant A | 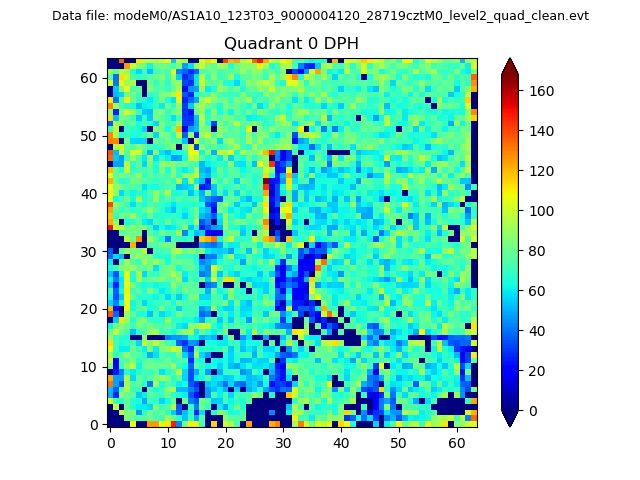 |
 |
Quadrant B |
|---|---|---|---|
| Quadrant D | 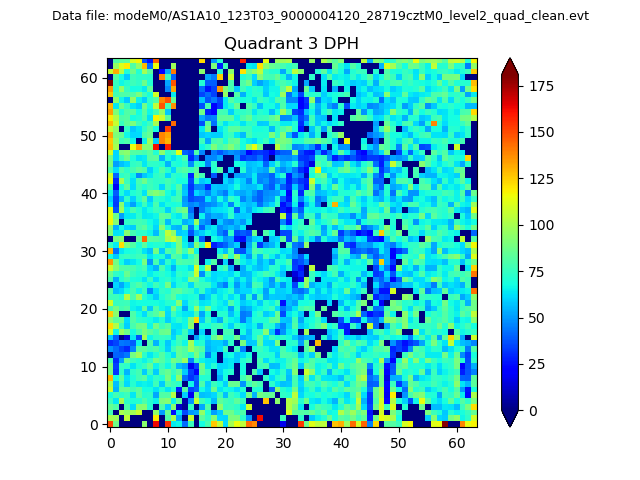 |
 |
Quadrant C |
| Plot type | Count rate plots | Images |
|---|---|---|
| Comparison with Poisson distribution Blue bars denote a histogram of data divided into 1 sec bins. Red curve is a Poisson curve with rate = median count rate of data. |
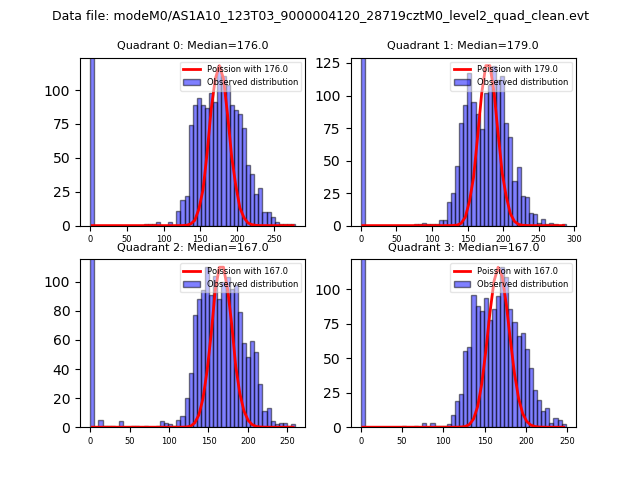 |
 |
| Quadrant-wise count rates Data is divided into 100 sec bins |
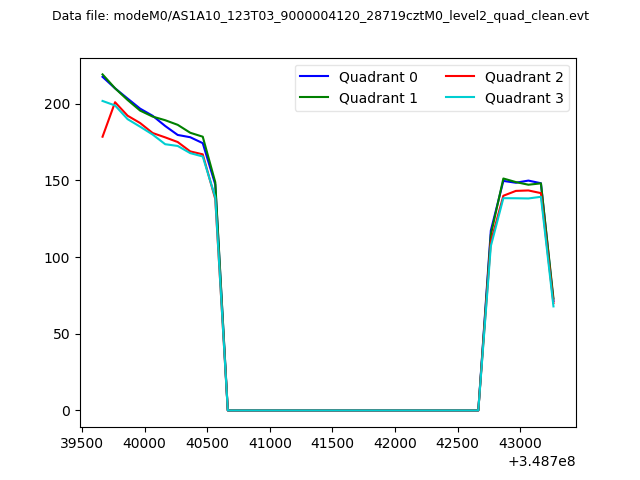 |
|
| Module-wise count rates for Quadrant A Data is divided into 100 sec bins |
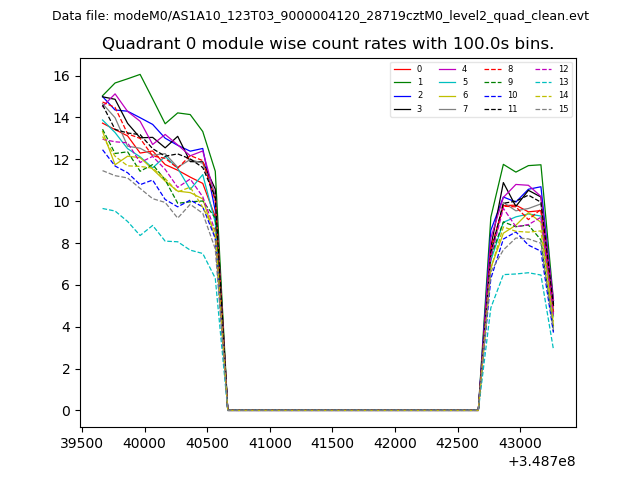 |
 |
| Module-wise count rates for Quadrant B Data is divided into 100 sec bins |
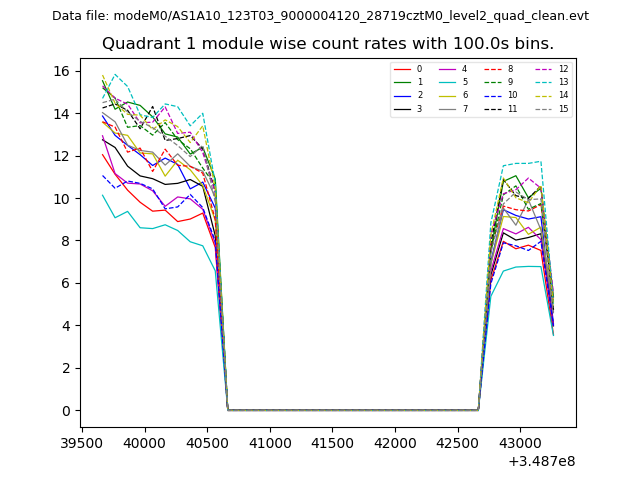 |
 |
| Module-wise count rates for Quadrant C Data is divided into 100 sec bins |
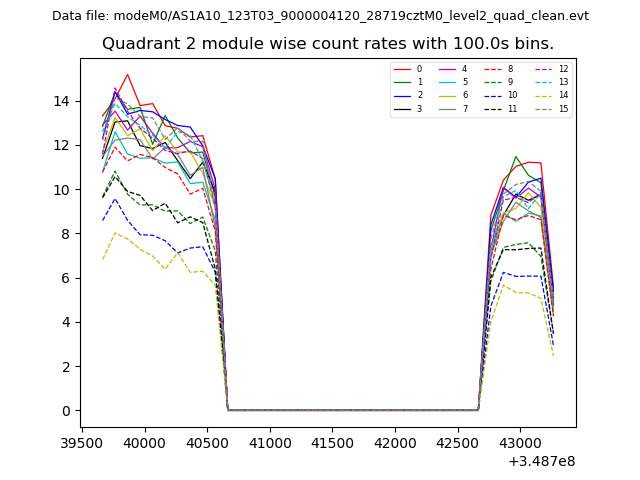 |
 |
| Module-wise count rates for Quadrant D Data is divided into 100 sec bins |
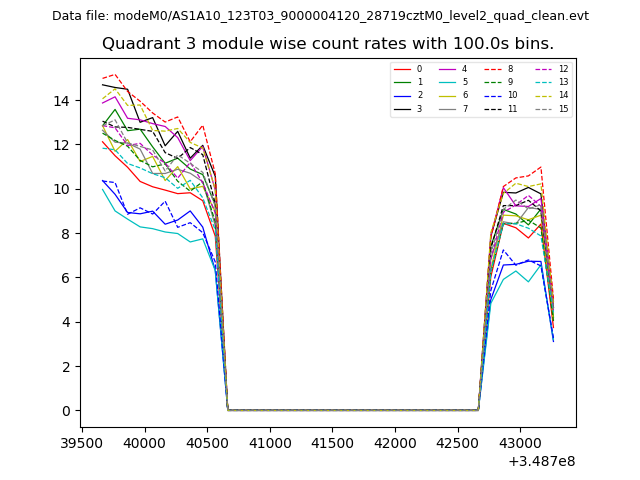 |
 |
| Parameter | Plot |
|---|---|
| CZT HV Monitor | 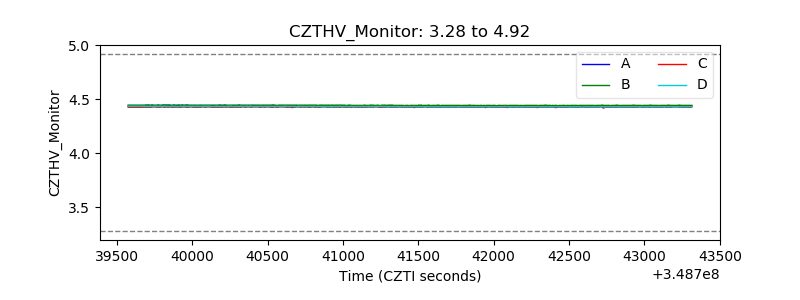 |
| D_VDD | 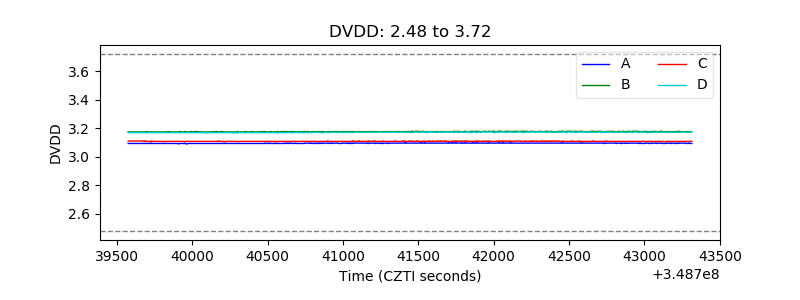 |
| Temperature 1 | 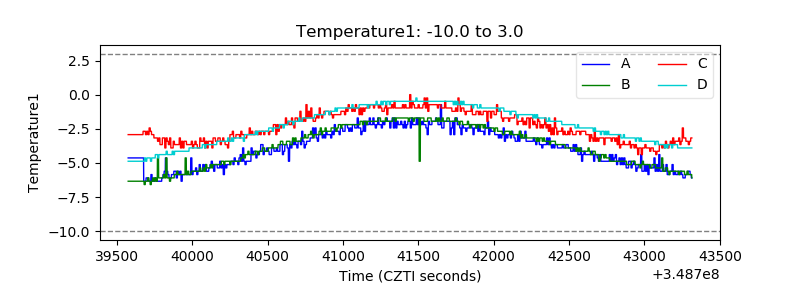 |
| Veto HV Monitor | 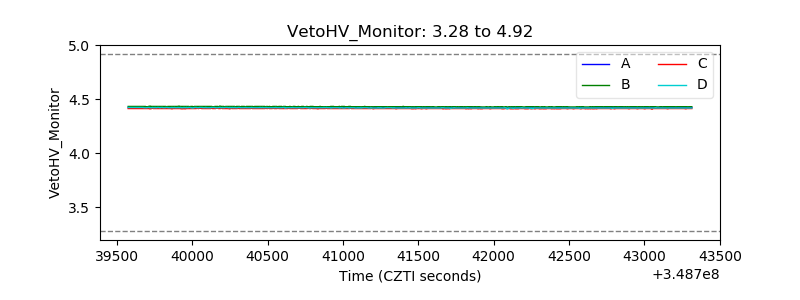 |
| Veto LLD | 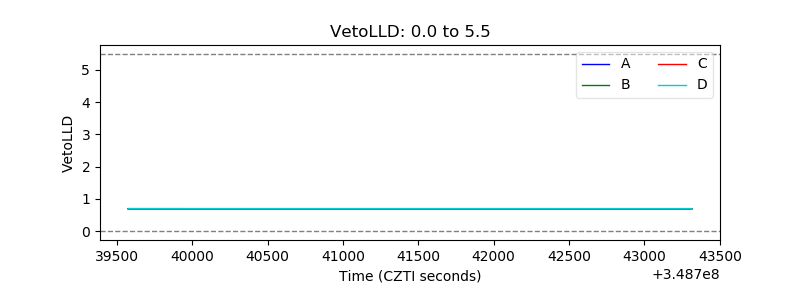 |
| Alpha Counter | 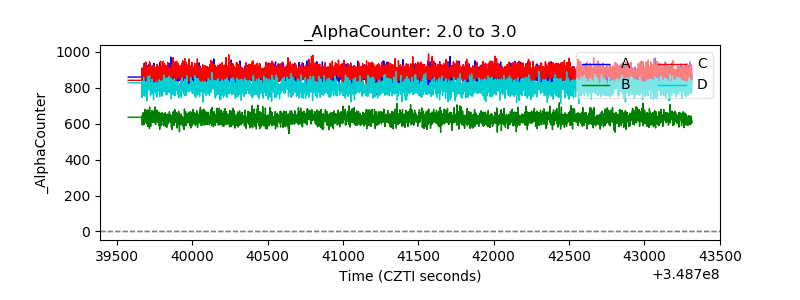 |
| _CPM_Rate | 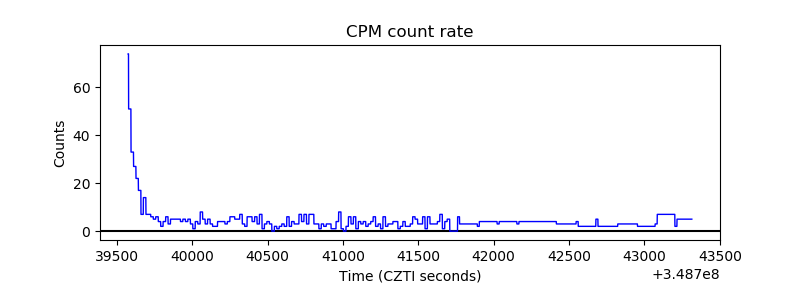 |
| CZT Counter | 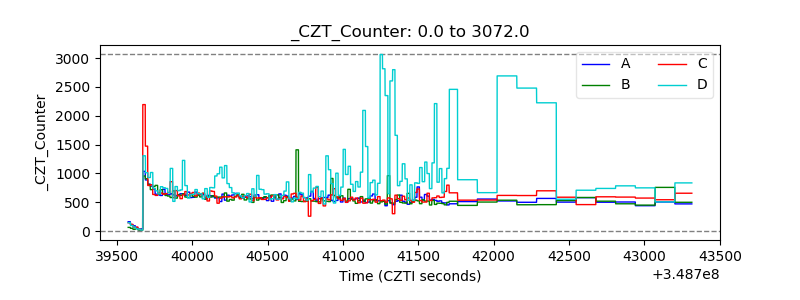 |
| +2.5 Volts monitor | 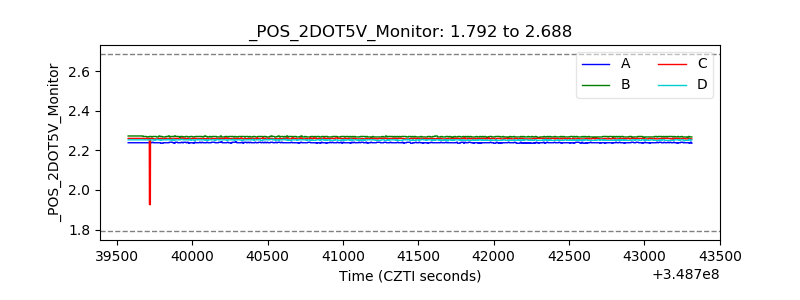 |
| +5 Volts monitor | 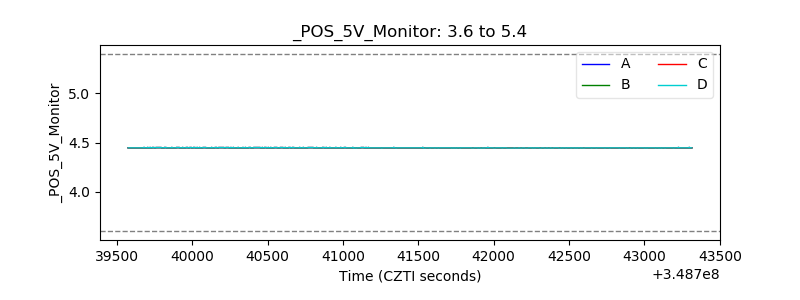 |
| _ROLL_ROT | 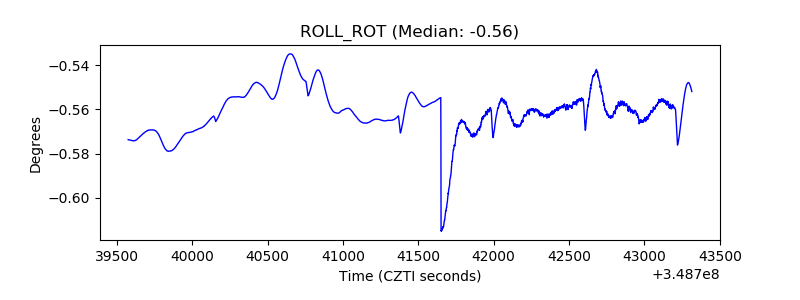 |
| _Roll_DEC | 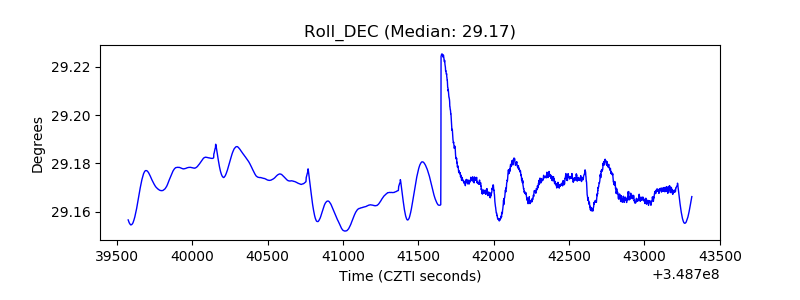 |
| _Roll_RA | 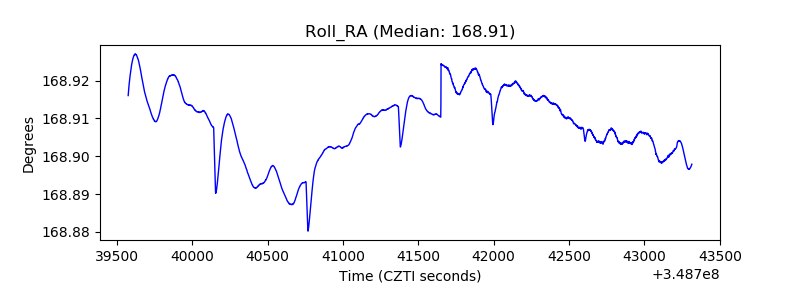 |
| Veto Counter | 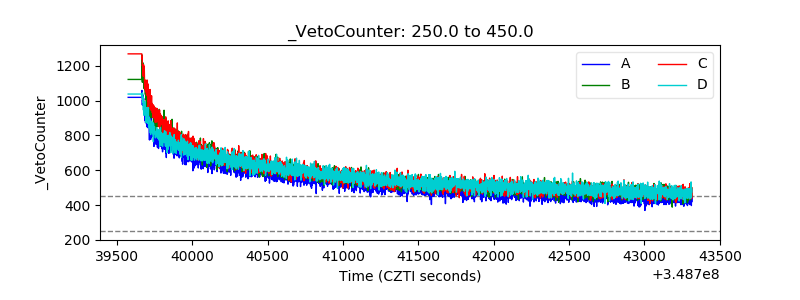 |