| Param | Original file | Final file |
|---|---|---|
| Filename | modeM0/AS1A10_123T06_9000004122cztM0_level2.fits | modeM0/AS1A10_123T06_9000004122cztM0_level2_quad_clean.evt |
| Size (bytes) | 365,578,560 | 361,451,520 |
| Size | 348.6 MB | 344.7 MB |
| Events in quadrant A | 2,268,682 | 2,210,155 |
| Events in quadrant B | 2,159,602 | 2,193,996 |
| Events in quadrant C | 2,157,054 | 2,036,937 |
| Events in quadrant D | 1,923,466 | 1,944,253 |
| Mode M9 | |||
|---|---|---|---|
| Quadrant | BADHDUFLAG | Total packets | Discarded packets |
| A | 0 | 45 | 0 |
| B | 0 | 45 | 0 |
| C | 0 | 45 | 0 |
| D | 0 | 45 | 0 |
| Mode M0 | |||
|---|---|---|---|
| Quadrant | BADHDUFLAG | Total packets | Discarded packets |
| A | 0 | 79691 | 0 |
| B | 0 | 79632 | 0 |
| C | 0 | 103327 | 0 |
| D | 0 | 102724 | 0 |
| Mode SS | |||
|---|---|---|---|
| Quadrant | BADHDUFLAG | Total packets | Discarded packets |
| A | 0 | 760 | 0 |
| B | 0 | 760 | 0 |
| C | 0 | 760 | 0 |
| D | 0 | 760 | 0 |
| Quadrant | Total seconds | Saturated seconds | Saturation percentage |
|---|---|---|---|
| A | 37296 | 999 | 2.678571% |
| B | 37296 | 922 | 2.472115% |
| C | 37296 | 2432 | 6.520807% |
| D | 37296 | 1676 | 4.493779% |
Noise dominated data is calculated using 1-second bins in cleaned event files. If a bin has >2000 counts, and if more than 50% of those come from <1% of pixels, then it is considered to be noise-dominated and hence unusable.
| Quadrant | # 1 sec bins | Bins with >0 counts | Bins with >2000 counts | High rate bins dominated by noise | Noise dominated (total time) | Noise dominated (detector-on time) | Marked lightcurve |
|---|---|---|---|---|---|---|---|
| A | 41781 | 37290 | 0 | 0 | 0.00% | 0.00% |  |
| B | 41781 | 37288 | 0 | 0 | 0.00% | 0.00% |  |
| C | 41780 | 37287 | 0 | 0 | 0.00% | 0.00% |  |
| D | 41781 | 37277 | 0 | 0 | 0.00% | 0.00% |  |
Top three noisy pixels from each quadrant. If the there are fewer than three noisy pixels in the level2.evt file, extra rows are filled as -1
| Pixel properties | Quadrant properties | ||||||
|---|---|---|---|---|---|---|---|
| Quadrant | DetID | PixID | Counts | Sigma | Mean | Median | Sigma |
| A | 0 | 29 | 2200 | 11.16 | 592 | 558 | 147.2 |
| A | 0 | 30 | 1758 | 8.15 | 592 | 558 | 147.2 |
| A | 7 | 110 | 1730 | 7.96 | 592 | 558 | 147.2 |
| B | 2 | 9 | 1764 | 10.73 | 571 | 545 | 113.6 |
| B | 3 | 17 | 1466 | 8.11 | 571 | 545 | 113.6 |
| B | 2 | 8 | 1458 | 8.04 | 571 | 545 | 113.6 |
| C | 3 | 126 | 1514 | 6.88 | 569 | 534 | 142.4 |
| C | 12 | 241 | 1494 | 6.74 | 569 | 534 | 142.4 |
| C | 7 | 111 | 1448 | 6.42 | 569 | 534 | 142.4 |
| D | 4 | 246 | 1496 | 6.8 | 549 | 498 | 146.8 |
| D | 3 | 14 | 1423 | 6.3 | 549 | 498 | 146.8 |
| D | 15 | 46 | 1383 | 6.03 | 549 | 498 | 146.8 |
Histogram calculated using DETX and DETY for each event in the final _common_clean file
| Quadrant A | 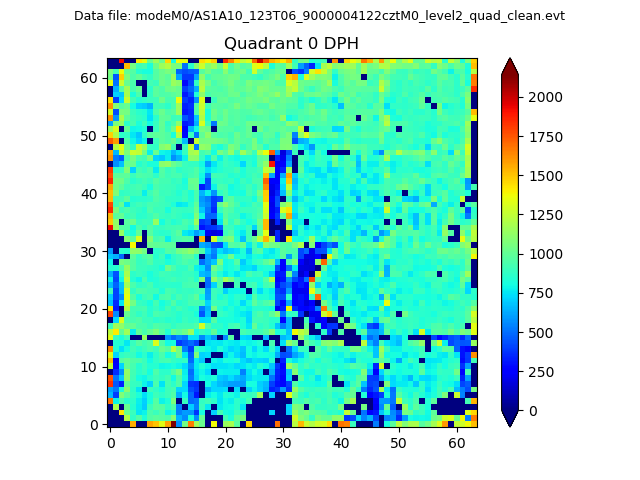 |
 |
Quadrant B |
|---|---|---|---|
| Quadrant D |  |
 |
Quadrant C |
| Plot type | Count rate plots | Images |
|---|---|---|
| Comparison with Poisson distribution Blue bars denote a histogram of data divided into 1 sec bins. Red curve is a Poisson curve with rate = median count rate of data. |
 |
 |
| Quadrant-wise count rates Data is divided into 100 sec bins |
 |
|
| Module-wise count rates for Quadrant A Data is divided into 100 sec bins |
 |
 |
| Module-wise count rates for Quadrant B Data is divided into 100 sec bins |
 |
 |
| Module-wise count rates for Quadrant C Data is divided into 100 sec bins |
 |
 |
| Module-wise count rates for Quadrant D Data is divided into 100 sec bins |
 |
 |
| Parameter | Plot |
|---|---|
| CZT HV Monitor |  |
| D_VDD |  |
| Temperature 1 |  |
| Veto HV Monitor |  |
| Veto LLD |  |
| Alpha Counter |  |
| _CPM_Rate |  |
| CZT Counter |  |
| +2.5 Volts monitor |  |
| +5 Volts monitor |  |
| _ROLL_ROT |  |
| _Roll_DEC |  |
| _Roll_RA |  |
| Veto Counter |  |