| Param | Original file | Final file |
|---|---|---|
| Filename | modeM0/AS1A10_123T06_9000004122_28720cztM0_level2.evt | modeM0/AS1A10_123T06_9000004122_28720cztM0_level2_quad_clean.evt |
| Size (bytes) | 512,213,760 | 79,750,080 |
| Size | 488.5 MB | 76.1 MB |
| Events in quadrant A | 3,365,466 | 501,643 |
| Events in quadrant B | 3,649,941 | 500,584 |
| Events in quadrant C | 3,509,051 | 482,979 |
| Events in quadrant D | 4,546,202 | 475,414 |
| Mode M9 | |||
|---|---|---|---|
| Quadrant | BADHDUFLAG | Total packets | Discarded packets |
| A | 0 | 12 | 0 |
| B | 0 | 12 | 0 |
| C | 0 | 12 | 0 |
| D | 0 | 12 | 0 |
| Mode M0 | |||
|---|---|---|---|
| Quadrant | BADHDUFLAG | Total packets | Discarded packets |
| A | 0 | 13647 | 1 |
| B | 0 | 14522 | 1 |
| C | 0 | 14005 | 1 |
| D | 0 | 17736 | 2 |
| Mode SS | |||
|---|---|---|---|
| Quadrant | BADHDUFLAG | Total packets | Discarded packets |
| A | 0 | 134 | 0 |
| B | 0 | 134 | 0 |
| C | 0 | 134 | 0 |
| D | 0 | 134 | 0 |
| Quadrant | Total seconds | Saturated seconds | Saturation percentage |
|---|---|---|---|
| A | 6513 | 73 | 1.120835% |
| B | 6514 | 162 | 2.486951% |
| C | 6514 | 125 | 1.918944% |
| D | 6513 | 184 | 2.825119% |
Noise dominated data is calculated using 1-second bins in cleaned event files. If a bin has >2000 counts, and if more than 50% of those come from <1% of pixels, then it is considered to be noise-dominated and hence unusable.
| Quadrant | # 1 sec bins | Bins with >0 counts | Bins with >2000 counts | High rate bins dominated by noise | Noise dominated (total time) | Noise dominated (detector-on time) | Marked lightcurve |
|---|---|---|---|---|---|---|---|
| A | 7688 | 6513 | 0 | 0 | 0.00% | 0.00% | 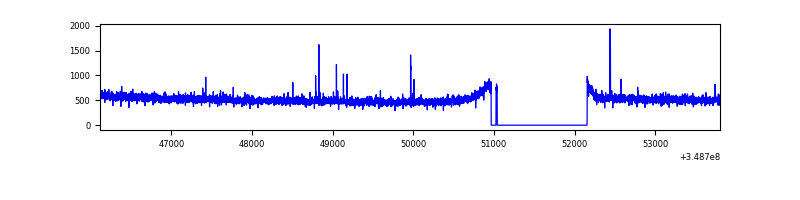 |
| B | 7689 | 6514 | 78 | 78 | 1.01% | 1.20% | 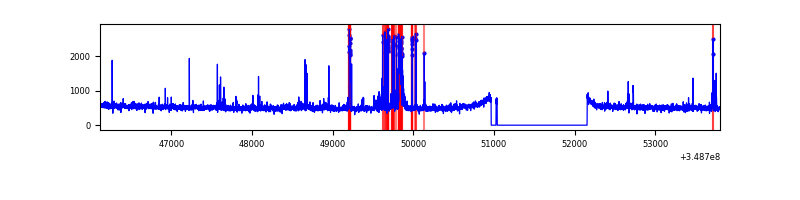 |
| C | 7689 | 6514 | 0 | 0 | 0.00% | 0.00% | 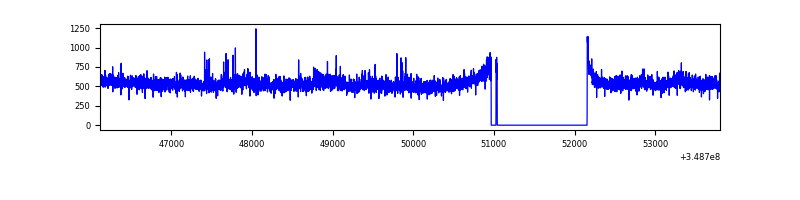 |
| D | 7688 | 6514 | 145 | 145 | 1.89% | 2.23% | 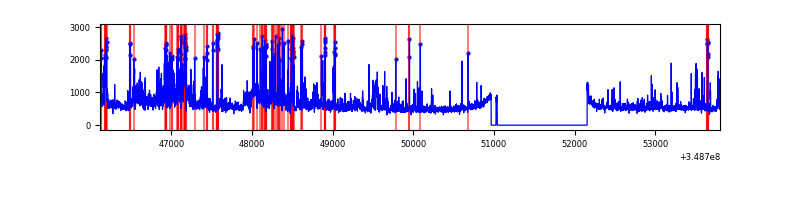 |
Top three noisy pixels from each quadrant. If the there are fewer than three noisy pixels in the level2.evt file, extra rows are filled as -1
| Pixel properties | Quadrant properties | ||||||
|---|---|---|---|---|---|---|---|
| Quadrant | DetID | PixID | Counts | Sigma | Mean | Median | Sigma |
| A | 12 | 96 | 11912 | 64.53 | 865 | 852 | 171.4 |
| A | 13 | 254 | 11154 | 60.11 | 865 | 852 | 171.4 |
| A | 15 | 174 | 10235 | 54.74 | 865 | 852 | 171.4 |
| B | 10 | 247 | 172920 | 1094.76 | 841 | 823 | 157.2 |
| B | 10 | 245 | 161515 | 1022.21 | 841 | 823 | 157.2 |
| B | 12 | 111 | 18983 | 115.52 | 841 | 823 | 157.2 |
| C | 3 | 233 | 172676 | 918.19 | 814 | 820 | 187.2 |
| C | 14 | 238 | 145308 | 771.97 | 814 | 820 | 187.2 |
| C | 14 | 254 | 18338 | 93.59 | 814 | 820 | 187.2 |
| D | 1 | 52 | 808774 | 4134.82 | 828 | 808 | 195.4 |
| D | 8 | 195 | 308789 | 1576.11 | 828 | 808 | 195.4 |
| D | 12 | 233 | 188760 | 961.86 | 828 | 808 | 195.4 |
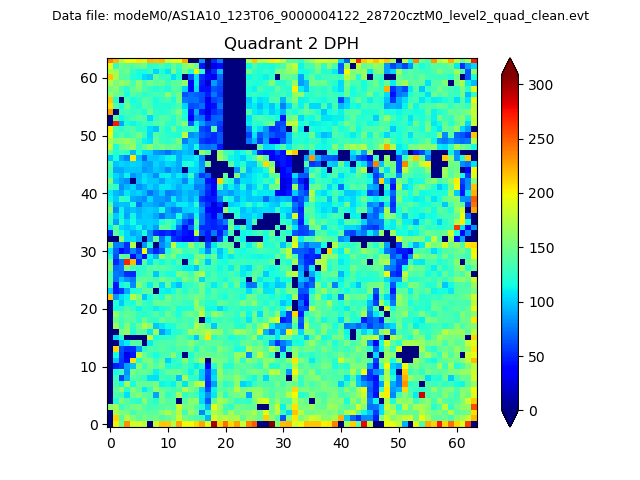
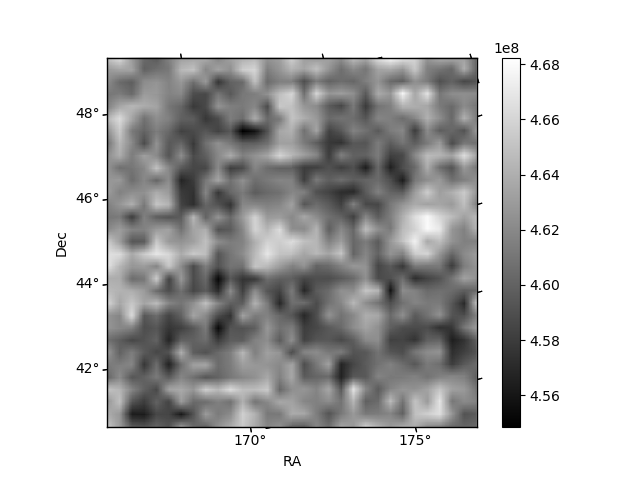
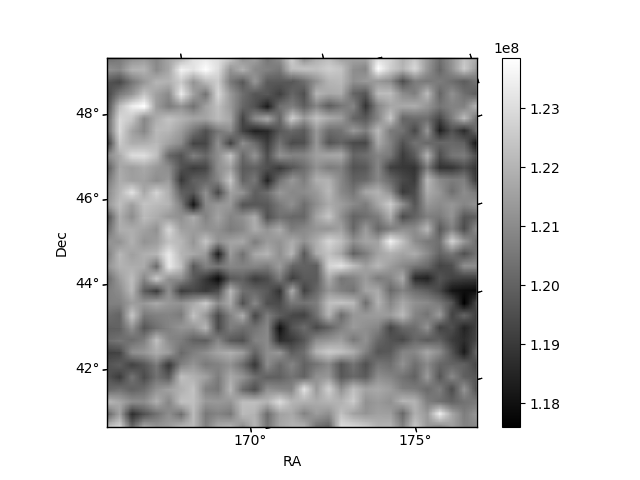
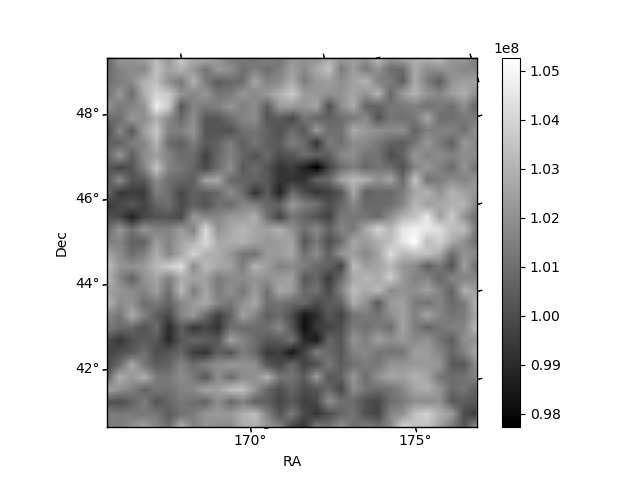
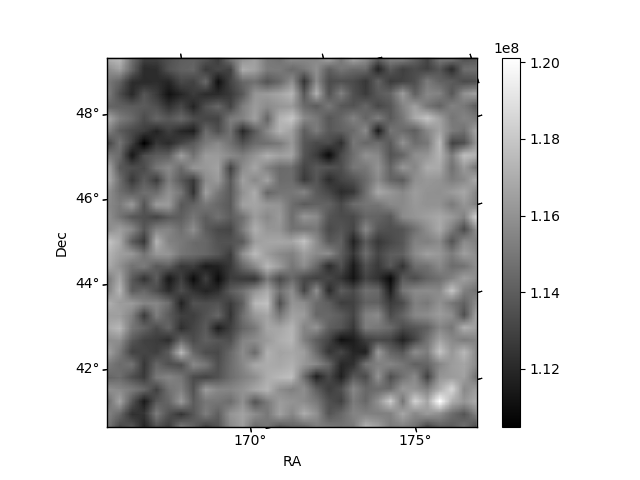
Histogram calculated using DETX and DETY for each event in the final _common_clean file
| Quadrant A | 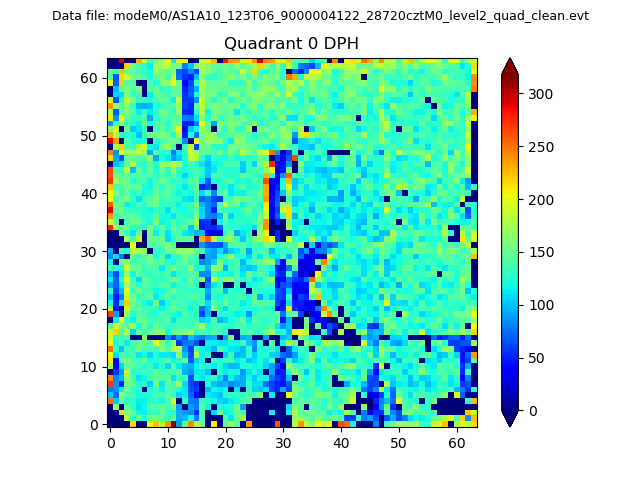 |
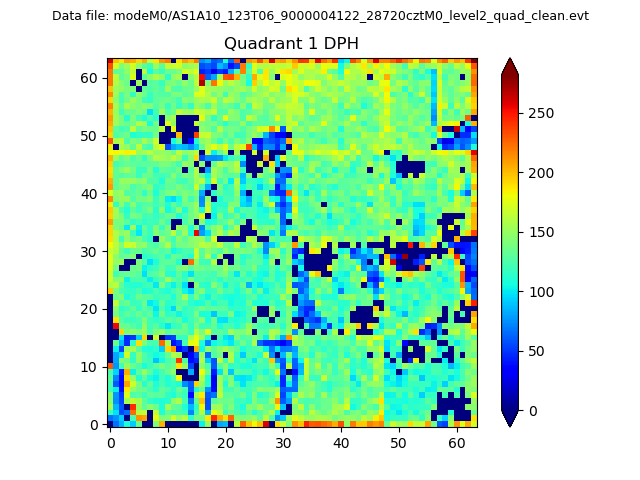 |
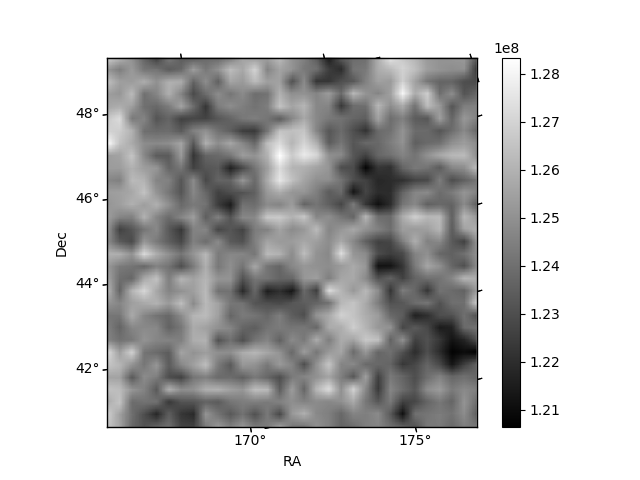
Quadrant B |
|---|---|---|---|
| Quadrant D | 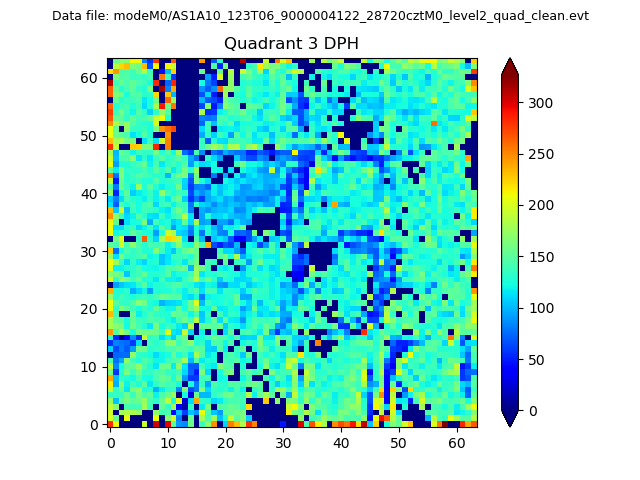 |
 |
Quadrant C |
| Plot type | Count rate plots | Images |
|---|---|---|
| Comparison with Poisson distribution Blue bars denote a histogram of data divided into 1 sec bins. Red curve is a Poisson curve with rate = median count rate of data. |
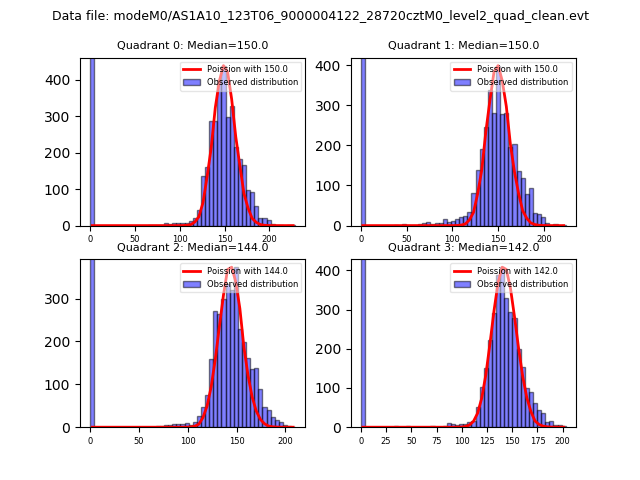 |
 |
| Quadrant-wise count rates Data is divided into 100 sec bins |
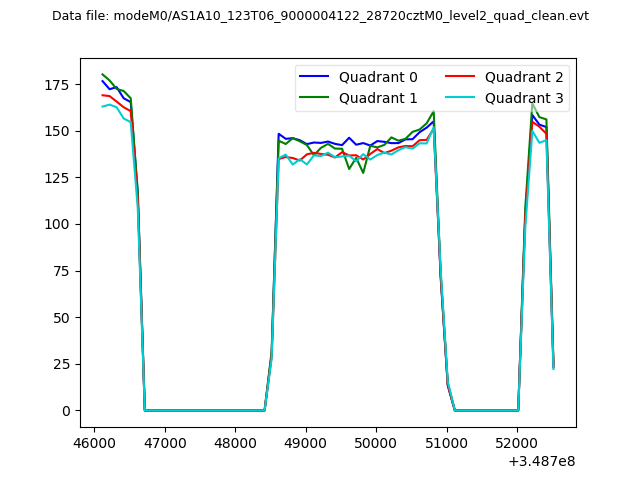 |
|
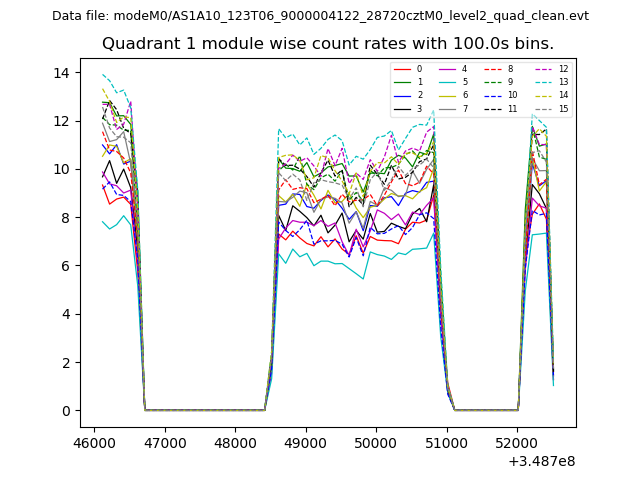
| Module-wise count rates for Quadrant A Data is divided into 100 sec bins |
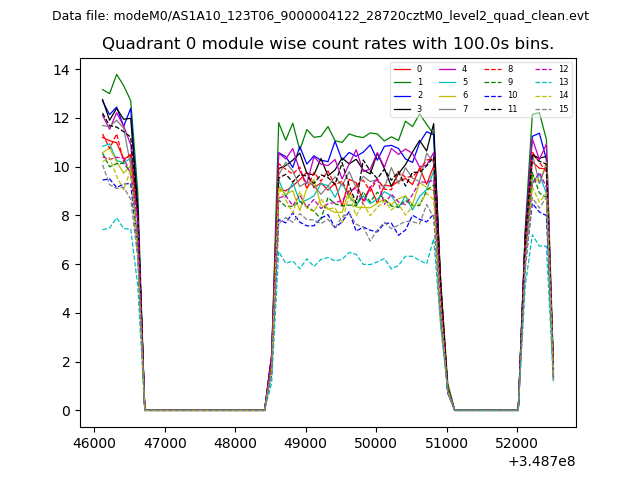 |
 |
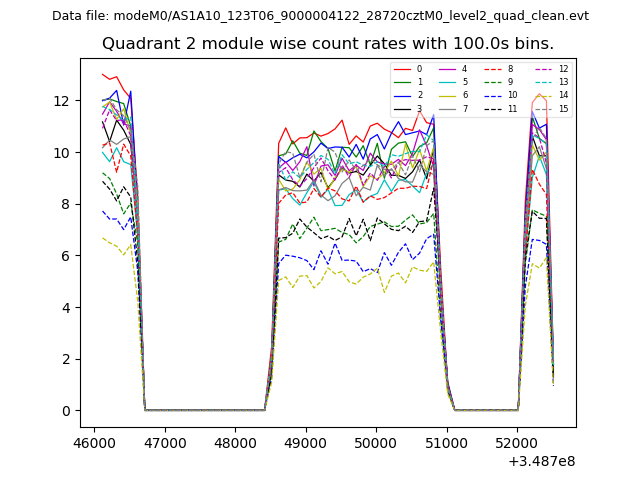
| Module-wise count rates for Quadrant B Data is divided into 100 sec bins |
 |
 |
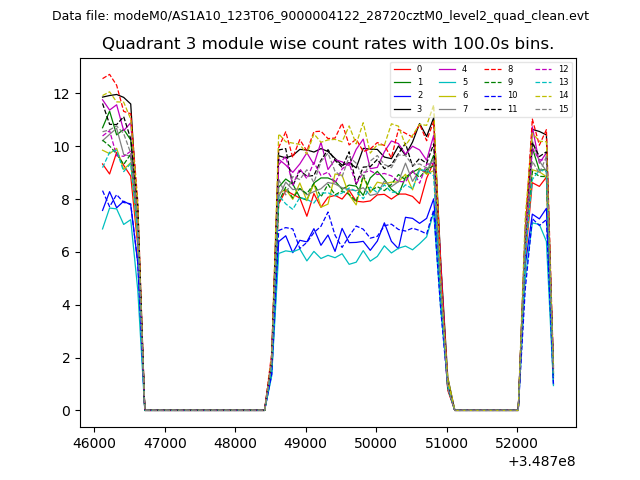
| Module-wise count rates for Quadrant C Data is divided into 100 sec bins |
 |
 |
| Module-wise count rates for Quadrant D Data is divided into 100 sec bins |
 |
 |
| Parameter | Plot |
|---|---|
| CZT HV Monitor | 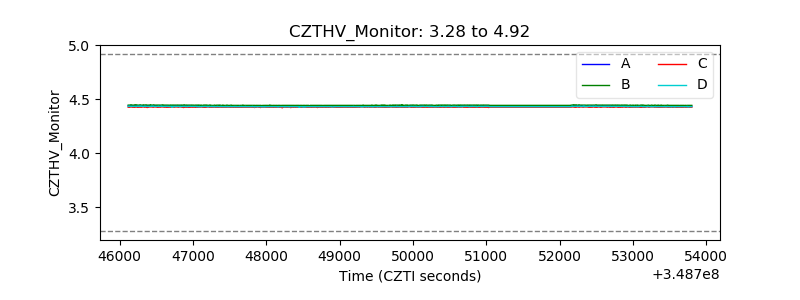 |
| D_VDD | 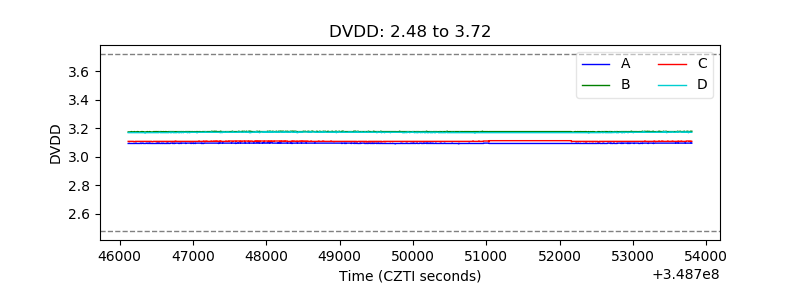 |
| Temperature 1 | 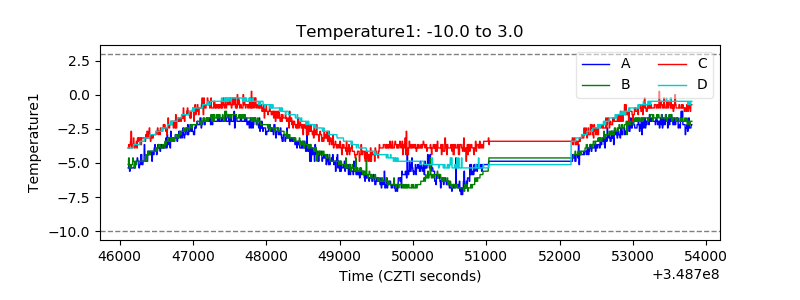 |
| Veto HV Monitor | 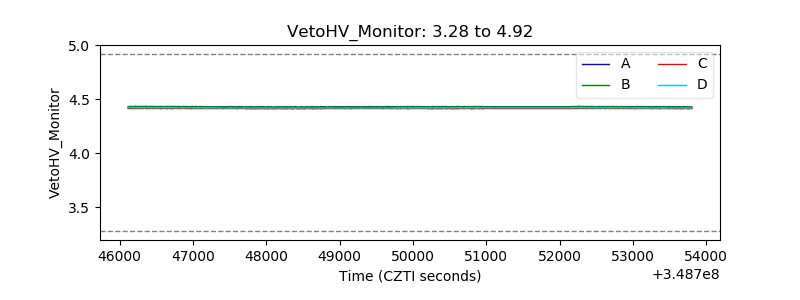 |
| Veto LLD | 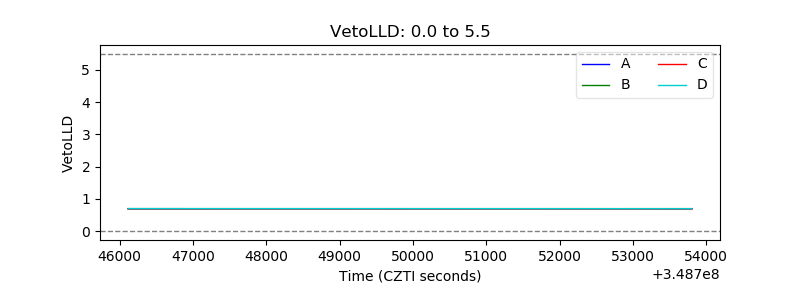 |
| Alpha Counter | 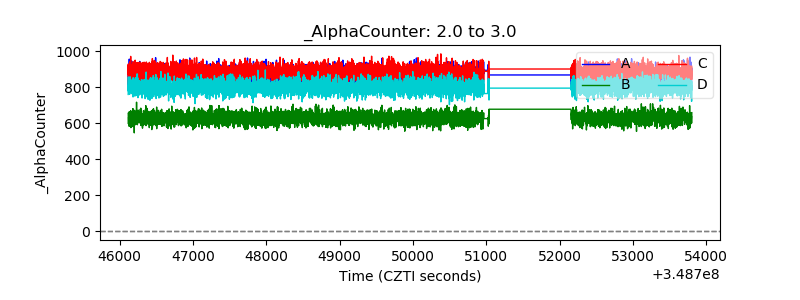 |
| _CPM_Rate | 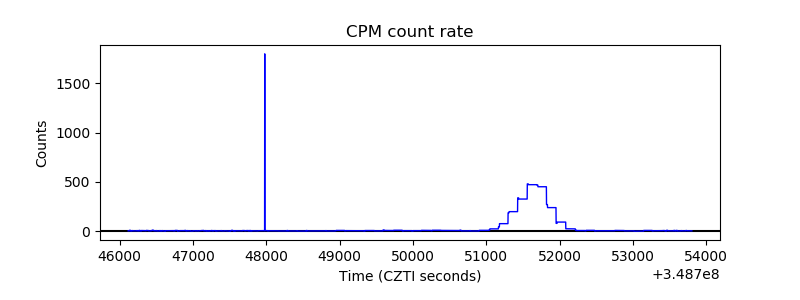 |
| CZT Counter | 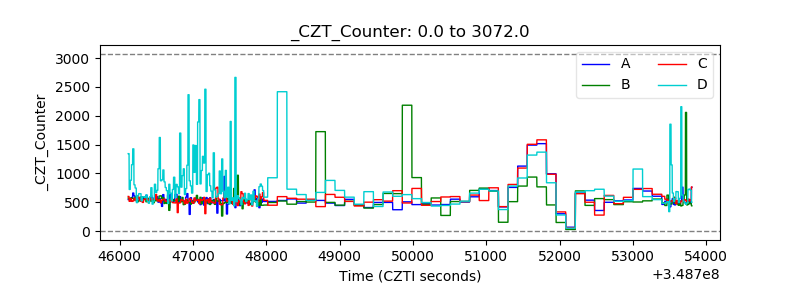 |
| +2.5 Volts monitor |  |
| +5 Volts monitor |  |
| _ROLL_ROT | 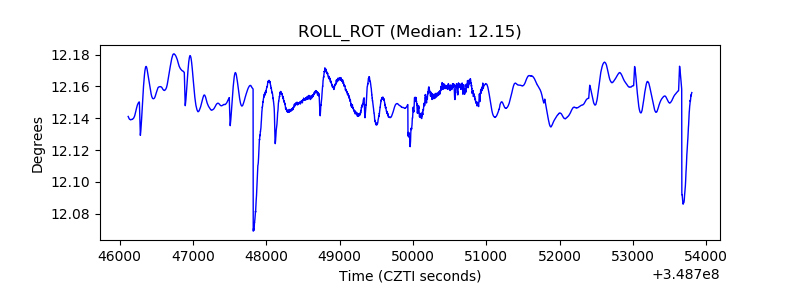 |
| _Roll_DEC | 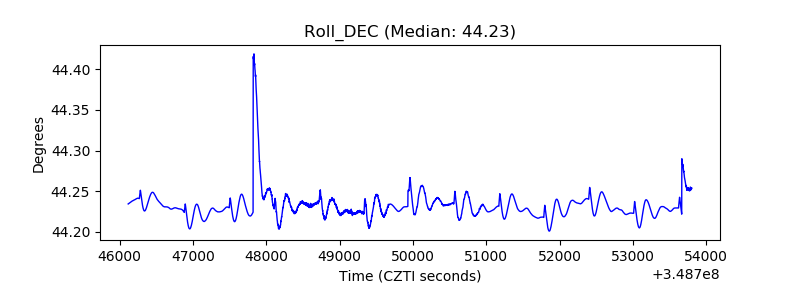 |
| _Roll_RA | 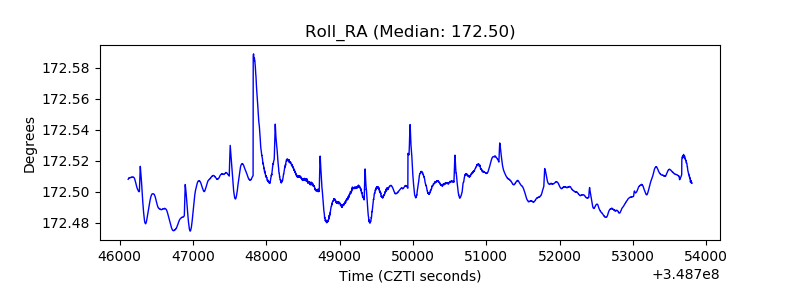 |
| Veto Counter | 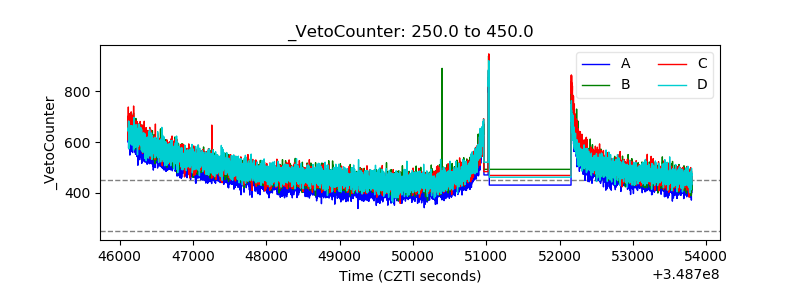 |