| Param | Original file | Final file |
|---|---|---|
| Filename | modeM0/AS1A10_123T06_9000004122_28722cztM0_level2.evt | modeM0/AS1A10_123T06_9000004122_28722cztM0_level2_quad_clean.evt |
| Size (bytes) | 611,441,280 | 84,438,720 |
| Size | 583.1 MB | 80.5 MB |
| Events in quadrant A | 4,241,279 | 518,849 |
| Events in quadrant B | 3,825,180 | 523,135 |
| Events in quadrant C | 3,807,416 | 504,948 |
| Events in quadrant D | 6,138,728 | 491,481 |
| Mode M9 | |||
|---|---|---|---|
| Quadrant | BADHDUFLAG | Total packets | Discarded packets |
| A | 0 | 5 | 0 |
| B | 0 | 6 | 0 |
| C | 0 | 6 | 0 |
| D | 0 | 6 | 0 |
| Mode M0 | |||
|---|---|---|---|
| Quadrant | BADHDUFLAG | Total packets | Discarded packets |
| A | 0 | 17364 | 2 |
| B | 0 | 16070 | 2 |
| C | 0 | 15812 | 2 |
| D | 0 | 23331 | 3 |
| Mode SS | |||
|---|---|---|---|
| Quadrant | BADHDUFLAG | Total packets | Discarded packets |
| A | 0 | 152 | 0 |
| B | 0 | 152 | 0 |
| C | 0 | 152 | 0 |
| D | 0 | 152 | 0 |
| Quadrant | Total seconds | Saturated seconds | Saturation percentage |
|---|---|---|---|
| A | 7446 | 463 | 6.218104% |
| B | 7446 | 222 | 2.981467% |
| C | 7446 | 183 | 2.457695% |
| D | 7445 | 582 | 7.817327% |
Noise dominated data is calculated using 1-second bins in cleaned event files. If a bin has >2000 counts, and if more than 50% of those come from <1% of pixels, then it is considered to be noise-dominated and hence unusable.
| Quadrant | # 1 sec bins | Bins with >0 counts | Bins with >2000 counts | High rate bins dominated by noise | Noise dominated (total time) | Noise dominated (detector-on time) | Marked lightcurve |
|---|---|---|---|---|---|---|---|
| A | 7766 | 7446 | 287 | 287 | 3.70% | 3.85% | 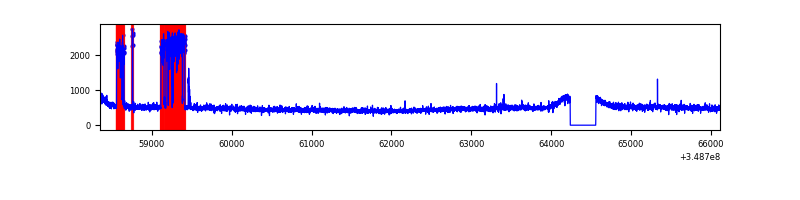 |
| B | 7766 | 7446 | 29 | 29 | 0.37% | 0.39% | 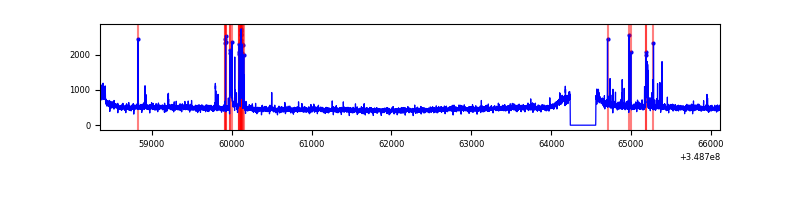 |
| C | 7766 | 7446 | 0 | 0 | 0.00% | 0.00% | 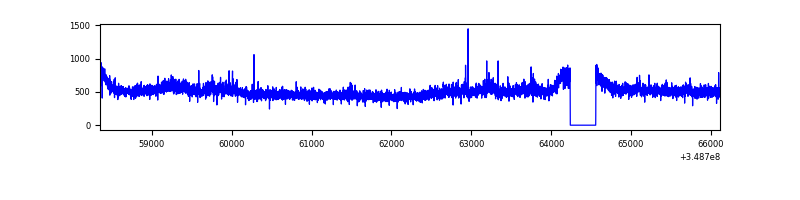 |
| D | 7765 | 7445 | 397 | 397 | 5.11% | 5.33% | 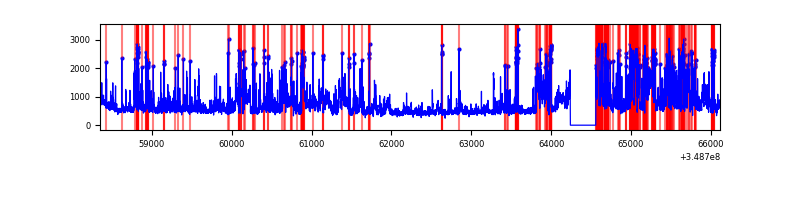 |
Top three noisy pixels from each quadrant. If the there are fewer than three noisy pixels in the level2.evt file, extra rows are filled as -1
| Pixel properties | Quadrant properties | ||||||
|---|---|---|---|---|---|---|---|
| Quadrant | DetID | PixID | Counts | Sigma | Mean | Median | Sigma |
| A | 6 | 16 | 669887 | 3615.66 | 920 | 901 | 185.0 |
| A | 15 | 174 | 19567 | 100.88 | 920 | 901 | 185.0 |
| A | 13 | 254 | 11666 | 58.18 | 920 | 901 | 185.0 |
| B | 0 | 230 | 121549 | 693.52 | 917 | 892 | 174.0 |
| B | 4 | 80 | 77196 | 438.59 | 917 | 892 | 174.0 |
| B | 12 | 111 | 21485 | 118.37 | 917 | 892 | 174.0 |
| C | 3 | 233 | 207105 | 994.14 | 884 | 888 | 207.4 |
| C | 14 | 238 | 144747 | 693.52 | 884 | 888 | 207.4 |
| C | 13 | 61 | 6163 | 25.43 | 884 | 888 | 207.4 |
| D | 1 | 52 | 2237678 | 10711.15 | 876 | 851 | 208.8 |
| D | 8 | 195 | 348003 | 1662.35 | 876 | 851 | 208.8 |
| D | 12 | 233 | 108245 | 514.26 | 876 | 851 | 208.8 |
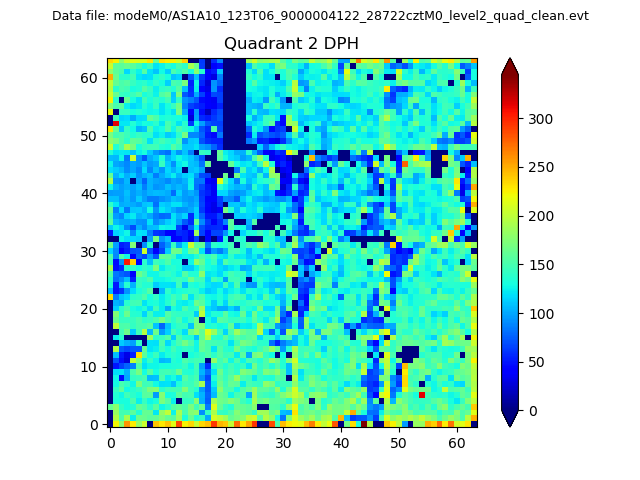
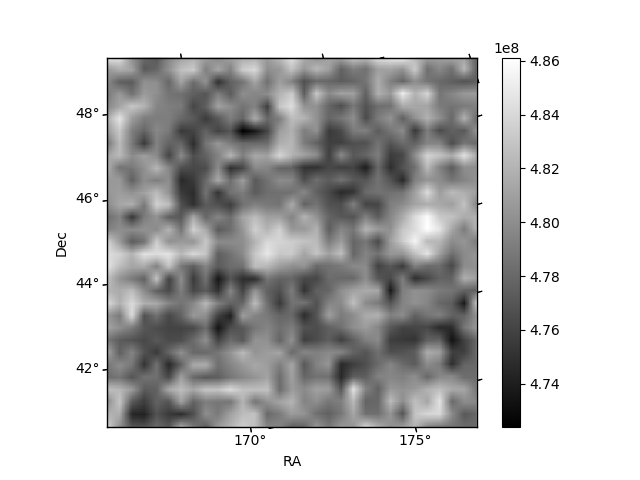
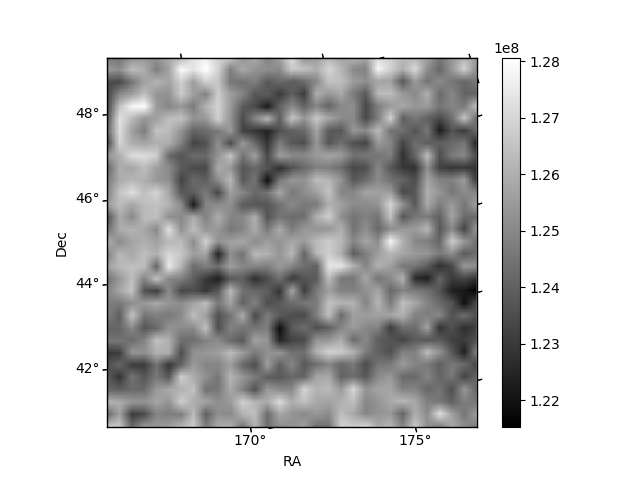
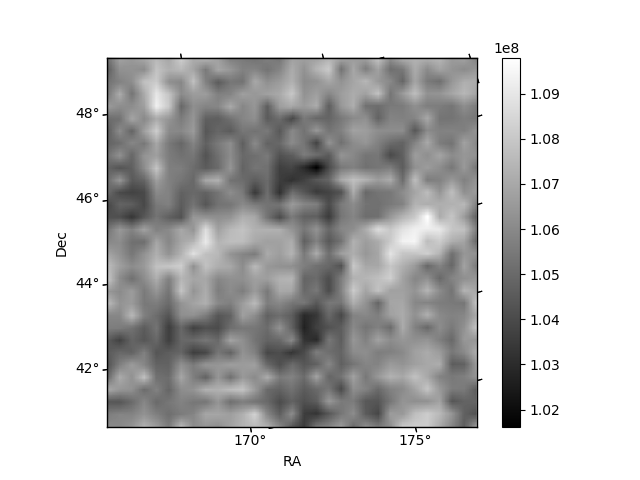
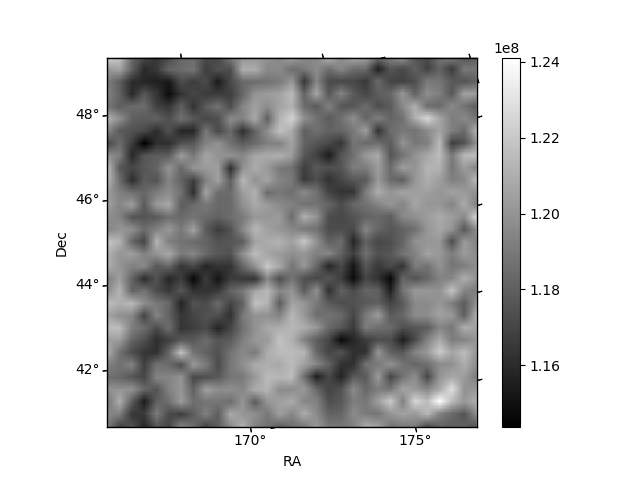
Histogram calculated using DETX and DETY for each event in the final _common_clean file
| Quadrant A | 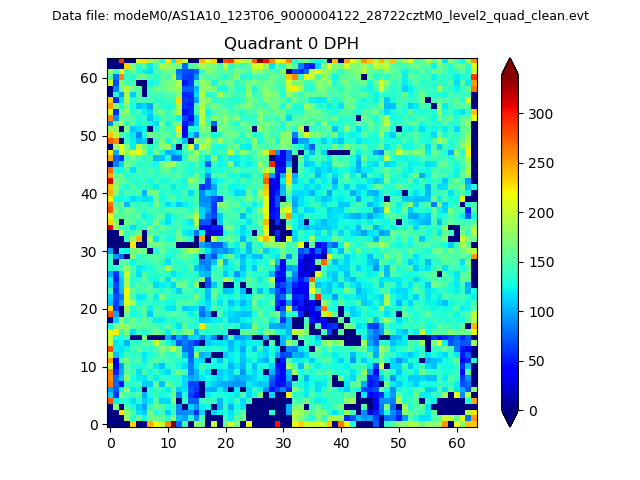 |
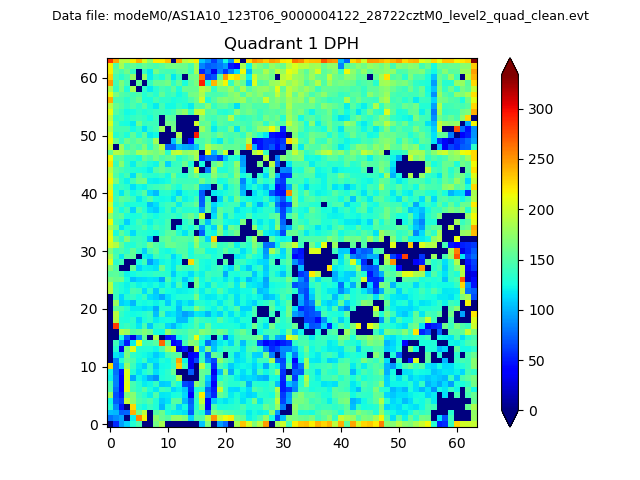 |
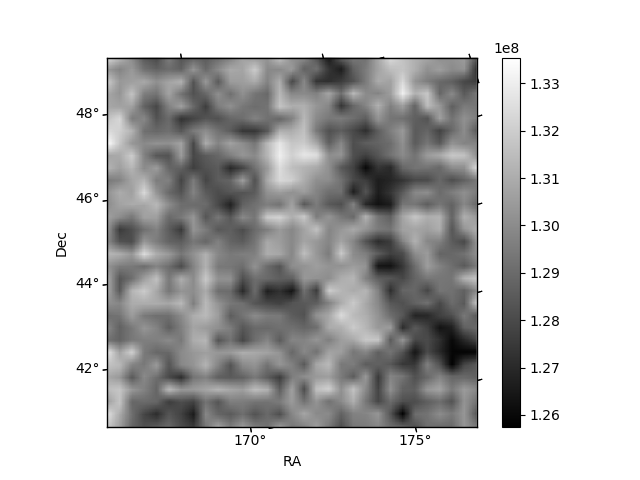
Quadrant B |
|---|---|---|---|
| Quadrant D | 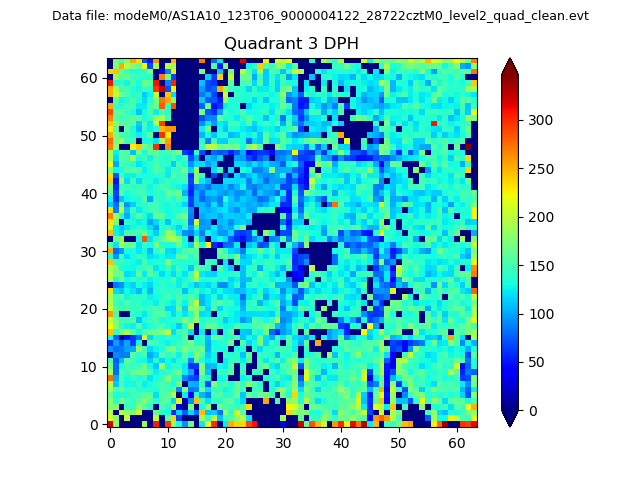 |
 |
Quadrant C |
| Plot type | Count rate plots | Images |
|---|---|---|
| Comparison with Poisson distribution Blue bars denote a histogram of data divided into 1 sec bins. Red curve is a Poisson curve with rate = median count rate of data. |
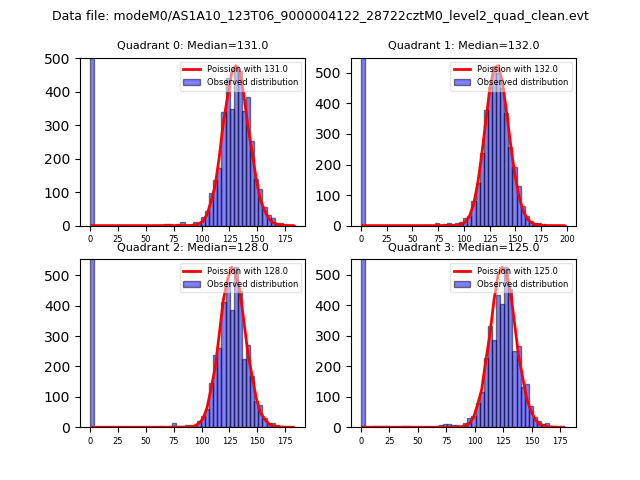 |
 |
| Quadrant-wise count rates Data is divided into 100 sec bins |
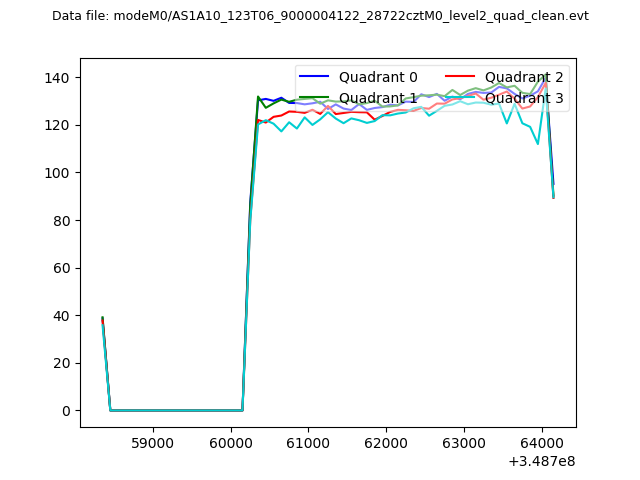 |
|
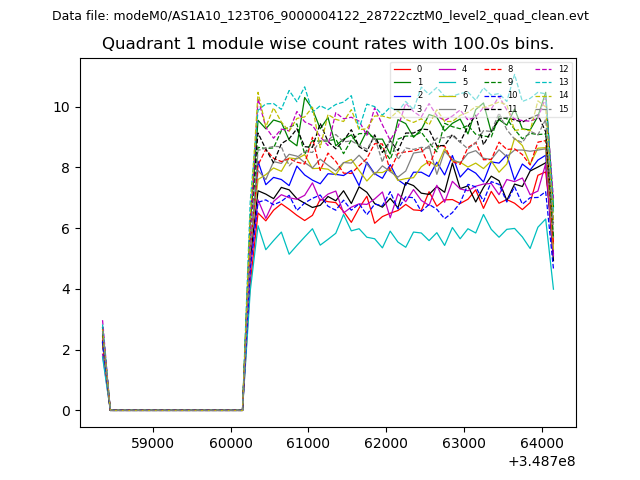
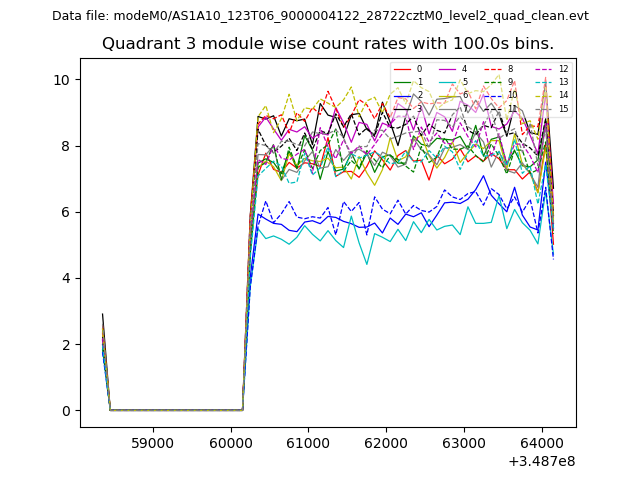
| Module-wise count rates for Quadrant A Data is divided into 100 sec bins |
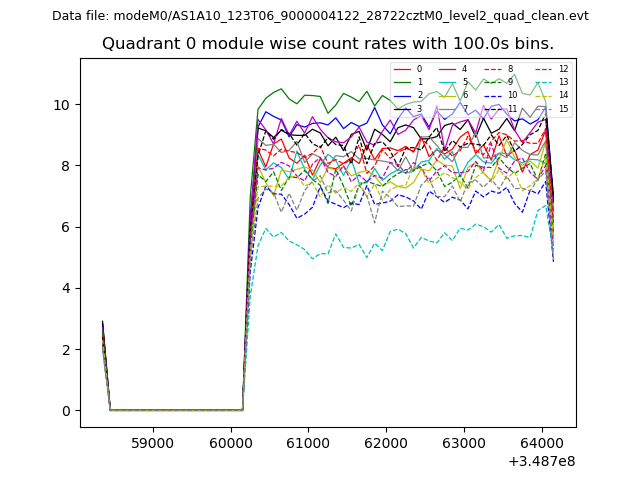 |
 |
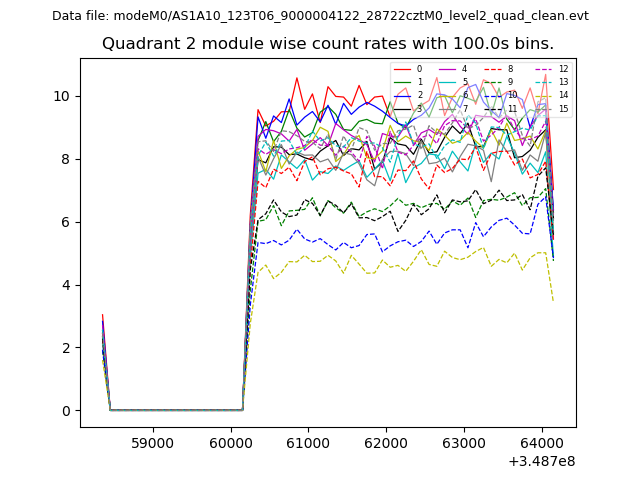
| Module-wise count rates for Quadrant B Data is divided into 100 sec bins |
 |
 |
| Module-wise count rates for Quadrant C Data is divided into 100 sec bins |
 |
 |
| Module-wise count rates for Quadrant D Data is divided into 100 sec bins |
 |
 |
| Parameter | Plot |
|---|---|
| CZT HV Monitor | 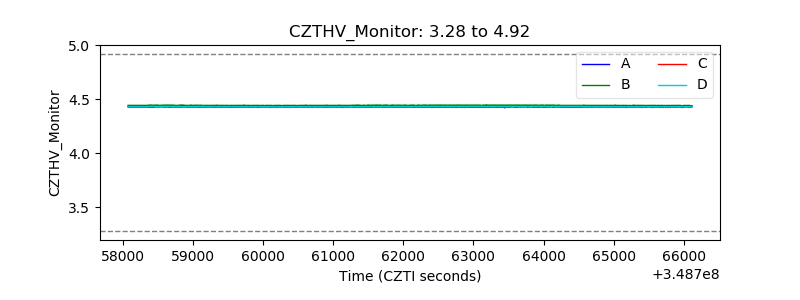 |
| D_VDD | 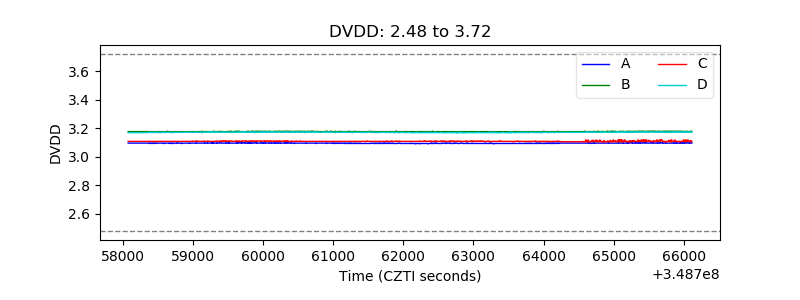 |
| Temperature 1 | 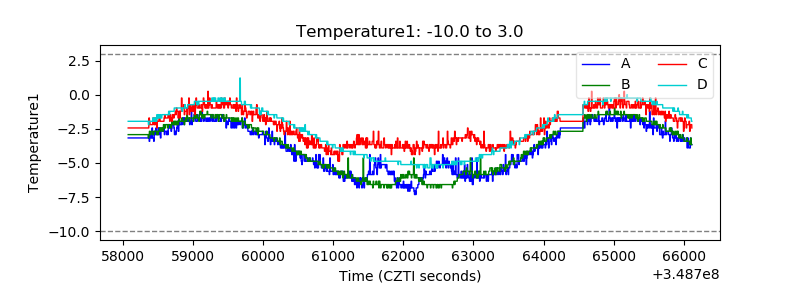 |
| Veto HV Monitor | 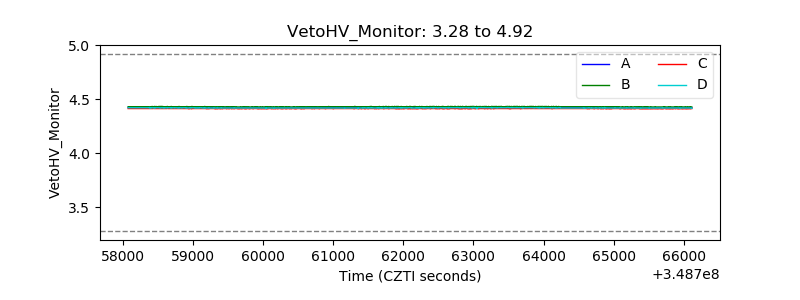 |
| Veto LLD | 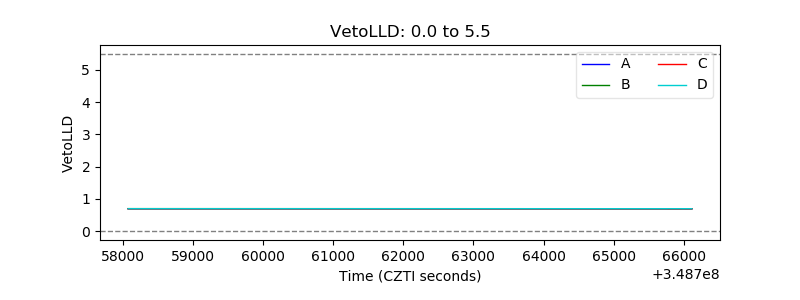 |
| Alpha Counter | 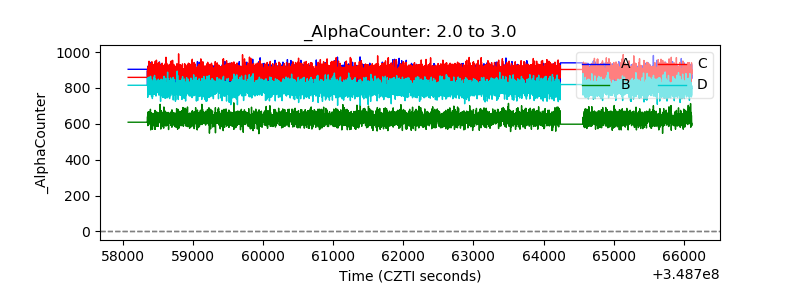 |
| _CPM_Rate | 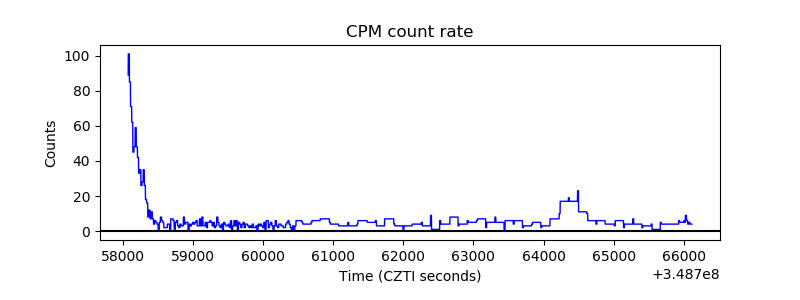 |
| CZT Counter | 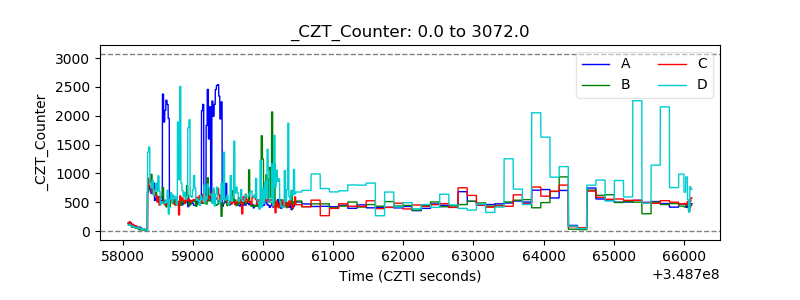 |
| +2.5 Volts monitor | 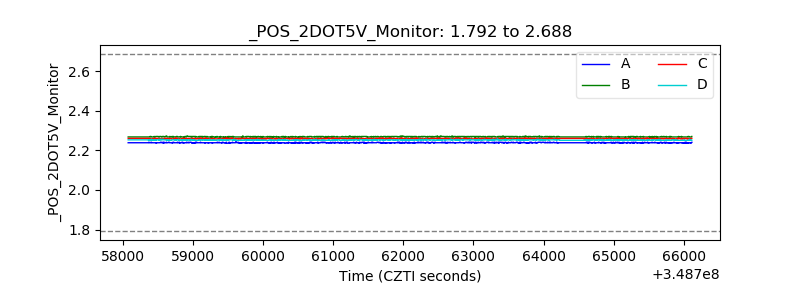 |
| +5 Volts monitor | 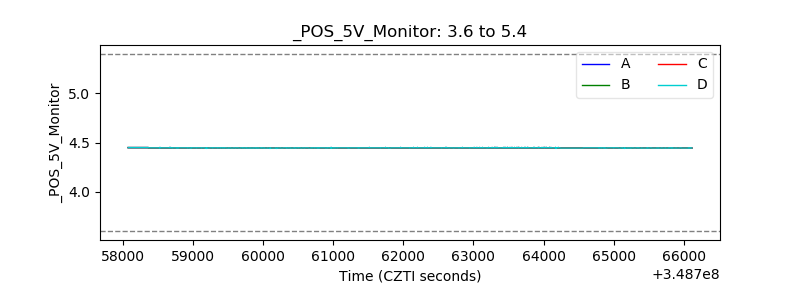 |
| _ROLL_ROT | 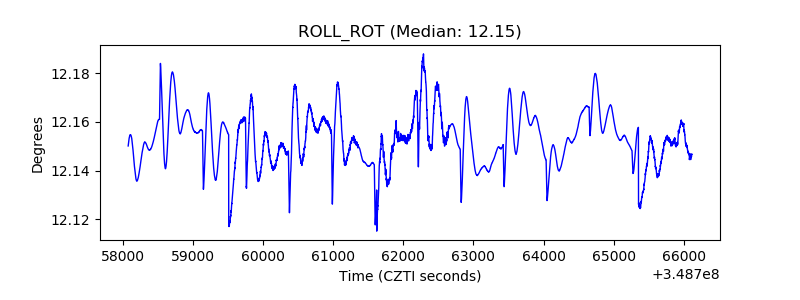 |
| _Roll_DEC | 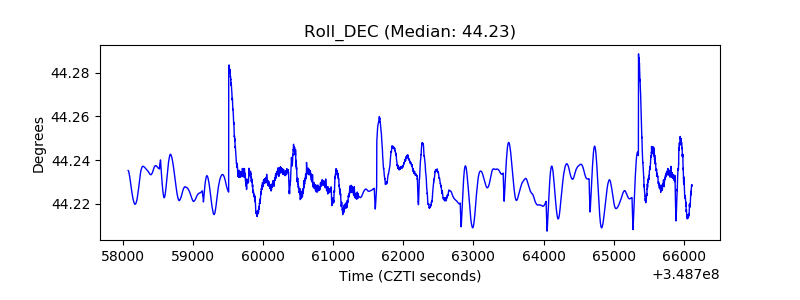 |
| _Roll_RA | 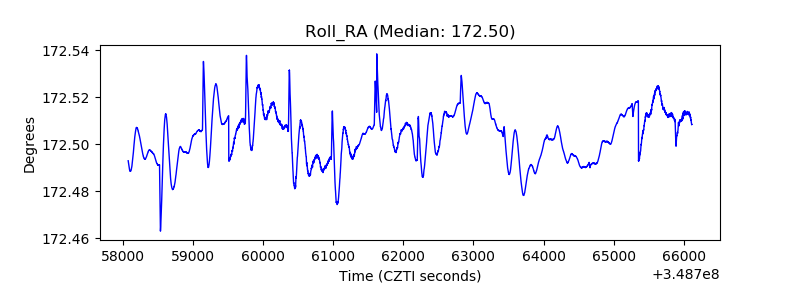 |
| Veto Counter | 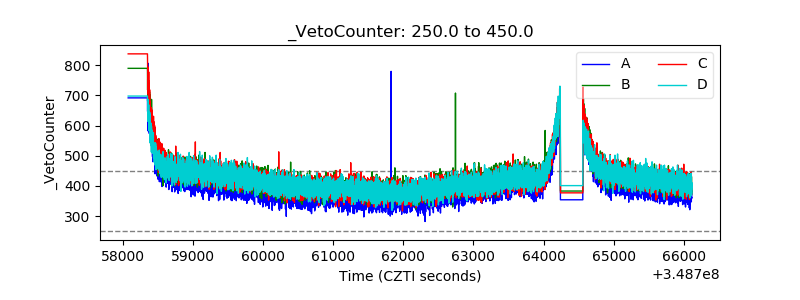 |