| Param | Original file | Final file |
|---|---|---|
| Filename | modeM0/AS1A10_123T06_9000004122_28723cztM0_level2.evt | modeM0/AS1A10_123T06_9000004122_28723cztM0_level2_quad_clean.evt |
| Size (bytes) | 566,078,400 | 89,953,920 |
| Size | 539.9 MB | 85.8 MB |
| Events in quadrant A | 3,452,999 | 564,508 |
| Events in quadrant B | 3,692,140 | 566,658 |
| Events in quadrant C | 4,091,089 | 546,849 |
| Events in quadrant D | 5,414,932 | 540,514 |
| Mode M9 | |||
|---|---|---|---|
| Quadrant | BADHDUFLAG | Total packets | Discarded packets |
| A | 0 | 1 | 0 |
| B | 0 | 1 | 0 |
| C | 0 | 1 | 0 |
| D | 0 | 1 | 0 |
| Mode M0 | |||
|---|---|---|---|
| Quadrant | BADHDUFLAG | Total packets | Discarded packets |
| A | 0 | 14962 | 1 |
| B | 0 | 15620 | 1 |
| C | 0 | 16789 | 1 |
| D | 0 | 21107 | 1 |
| Mode SS | |||
|---|---|---|---|
| Quadrant | BADHDUFLAG | Total packets | Discarded packets |
| A | 0 | 148 | 0 |
| B | 0 | 148 | 0 |
| C | 0 | 148 | 0 |
| D | 0 | 148 | 0 |
| Quadrant | Total seconds | Saturated seconds | Saturation percentage |
|---|---|---|---|
| A | 7259 | 120 | 1.653120% |
| B | 7260 | 190 | 2.617080% |
| C | 7260 | 246 | 3.388430% |
| D | 7260 | 427 | 5.881543% |
Noise dominated data is calculated using 1-second bins in cleaned event files. If a bin has >2000 counts, and if more than 50% of those come from <1% of pixels, then it is considered to be noise-dominated and hence unusable.
| Quadrant | # 1 sec bins | Bins with >0 counts | Bins with >2000 counts | High rate bins dominated by noise | Noise dominated (total time) | Noise dominated (detector-on time) | Marked lightcurve |
|---|---|---|---|---|---|---|---|
| A | 7389 | 7260 | 0 | 0 | 0.00% | 0.00% | 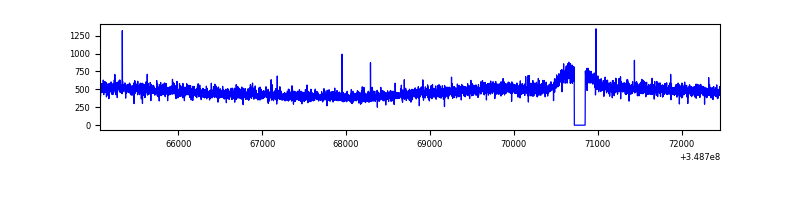 |
| B | 7390 | 7260 | 25 | 25 | 0.34% | 0.34% | 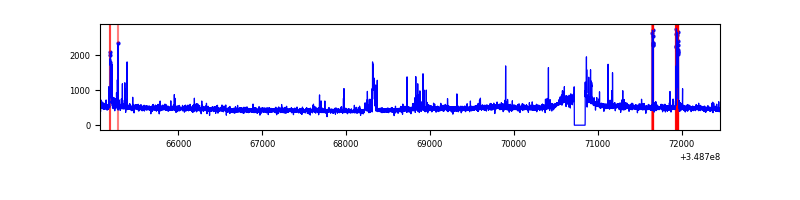 |
| C | 7390 | 7260 | 0 | 0 | 0.00% | 0.00% | 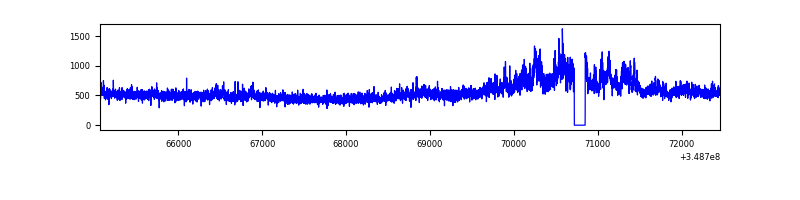 |
| D | 7390 | 7260 | 251 | 251 | 3.40% | 3.46% | 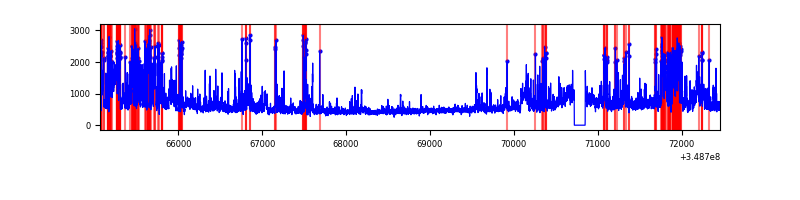 |
Top three noisy pixels from each quadrant. If the there are fewer than three noisy pixels in the level2.evt file, extra rows are filled as -1
| Pixel properties | Quadrant properties | ||||||
|---|---|---|---|---|---|---|---|
| Quadrant | DetID | PixID | Counts | Sigma | Mean | Median | Sigma |
| A | 13 | 254 | 13080 | 67.86 | 890 | 870 | 179.9 |
| A | 15 | 174 | 12207 | 63.01 | 890 | 870 | 179.9 |
| A | 3 | 137 | 8655 | 43.27 | 890 | 870 | 179.9 |
| B | 4 | 80 | 132475 | 793.25 | 876 | 854 | 165.9 |
| B | 5 | 172 | 76862 | 458.09 | 876 | 854 | 165.9 |
| B | 12 | 111 | 20306 | 117.23 | 876 | 854 | 165.9 |
| C | 3 | 233 | 638316 | 3220.85 | 845 | 849 | 197.9 |
| C | 14 | 238 | 136859 | 687.2 | 845 | 849 | 197.9 |
| C | 8 | 128 | 9947 | 45.97 | 845 | 849 | 197.9 |
| D | 1 | 52 | 1311565 | 6337.53 | 852 | 825 | 206.8 |
| D | 8 | 195 | 555347 | 2681.16 | 852 | 825 | 206.8 |
| D | 12 | 233 | 207055 | 997.14 | 852 | 825 | 206.8 |
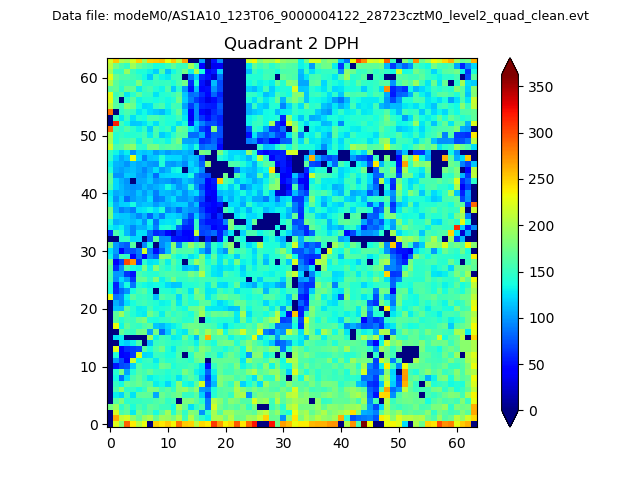
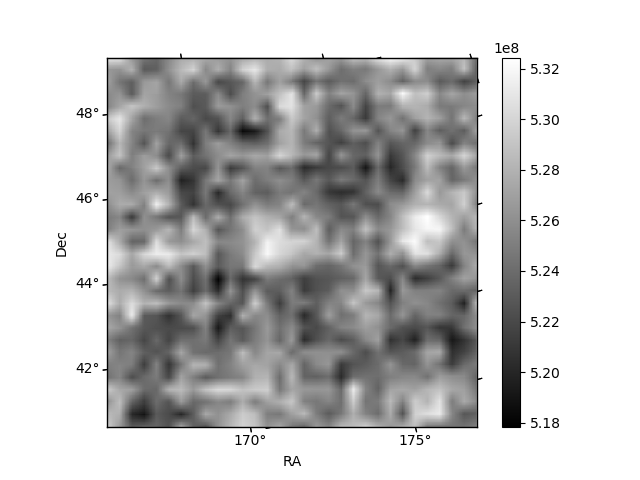
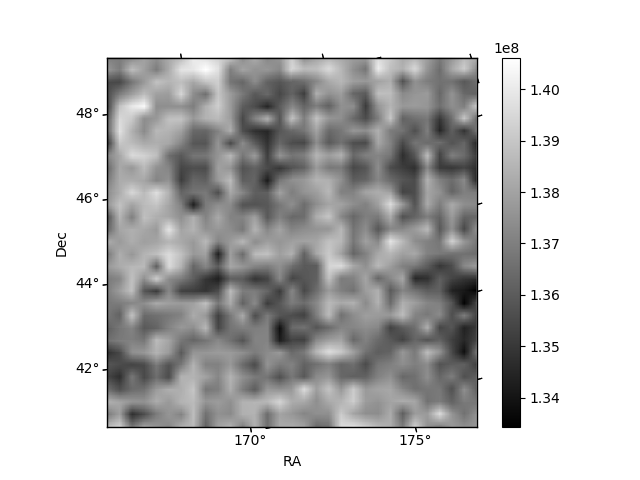
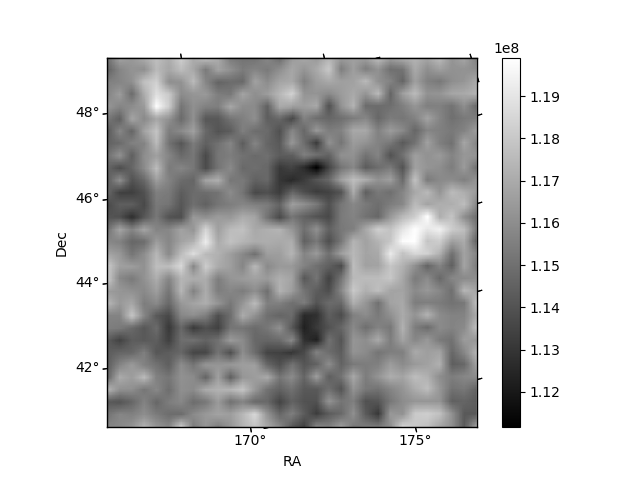
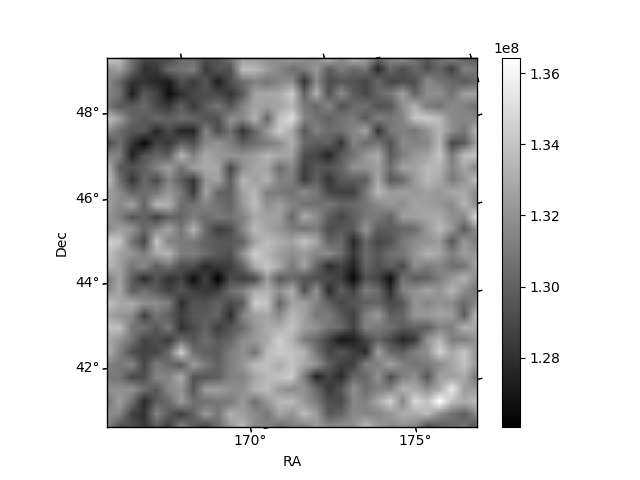
Histogram calculated using DETX and DETY for each event in the final _common_clean file
| Quadrant A | 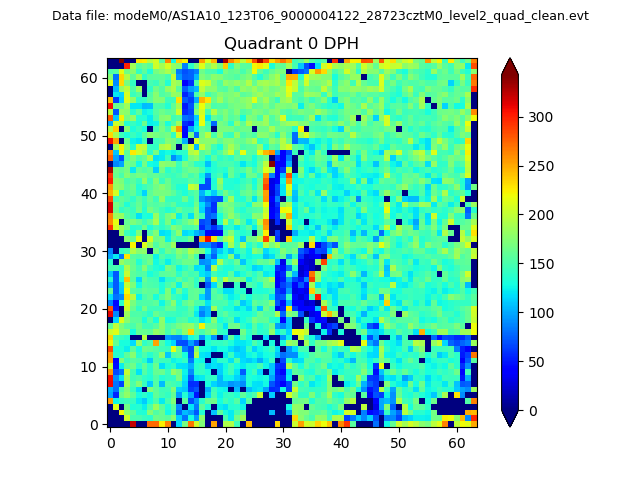 |
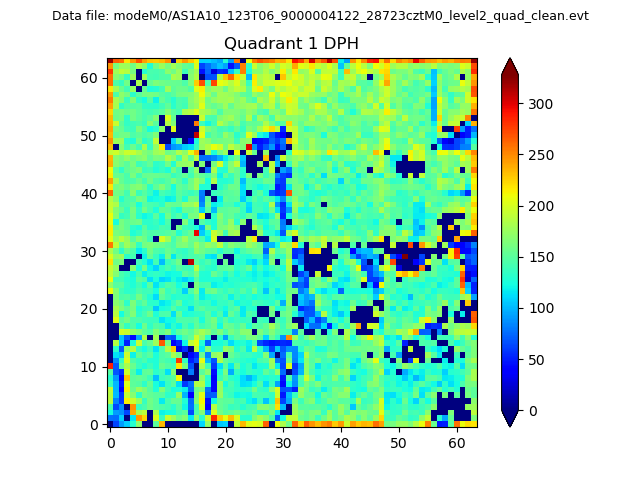 |
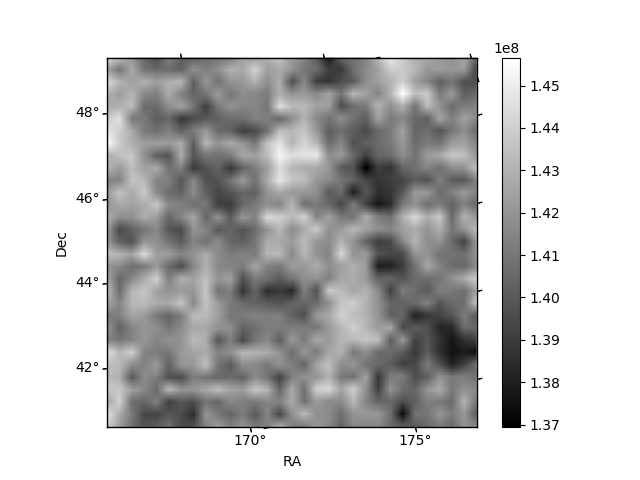
Quadrant B |
|---|---|---|---|
| Quadrant D | 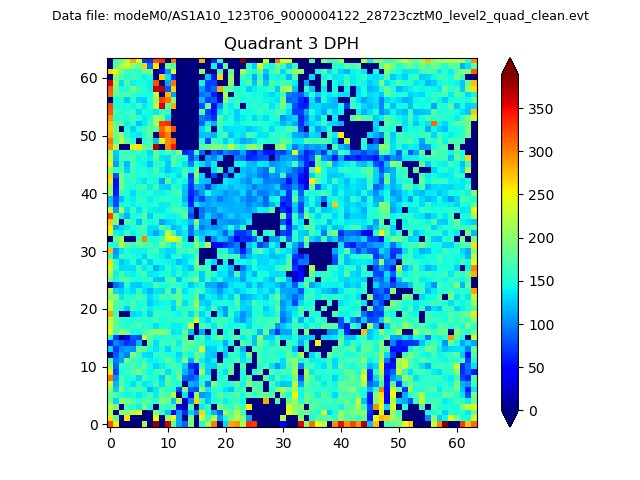 |
 |
Quadrant C |
| Plot type | Count rate plots | Images |
|---|---|---|
| Comparison with Poisson distribution Blue bars denote a histogram of data divided into 1 sec bins. Red curve is a Poisson curve with rate = median count rate of data. |
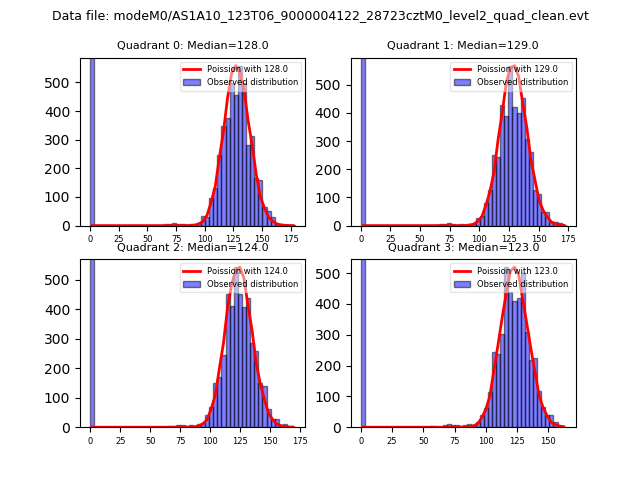 |
 |
| Quadrant-wise count rates Data is divided into 100 sec bins |
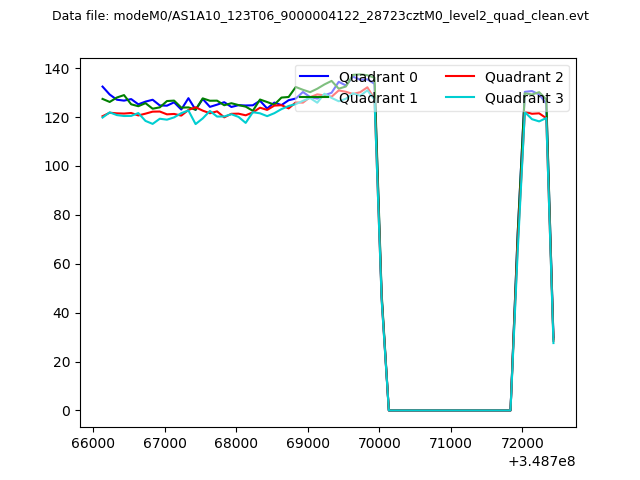 |
|
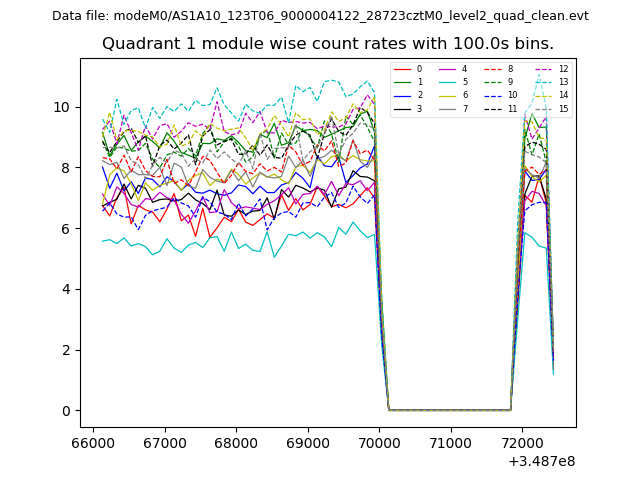
| Module-wise count rates for Quadrant A Data is divided into 100 sec bins |
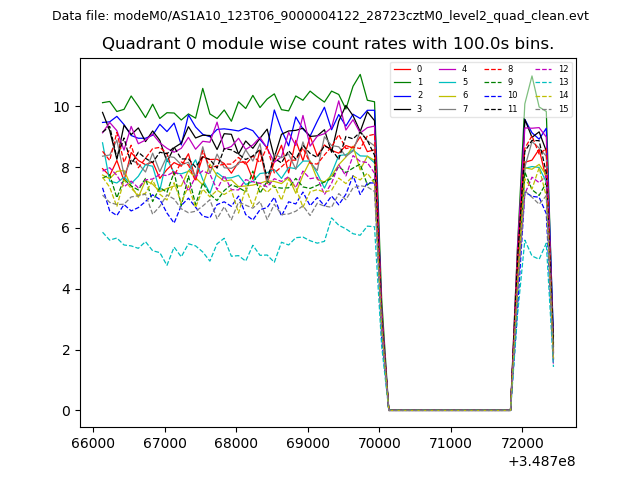 |
 |
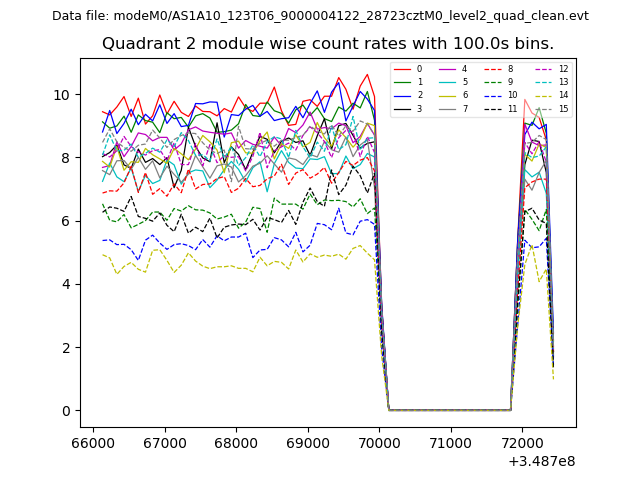
| Module-wise count rates for Quadrant B Data is divided into 100 sec bins |
 |
 |
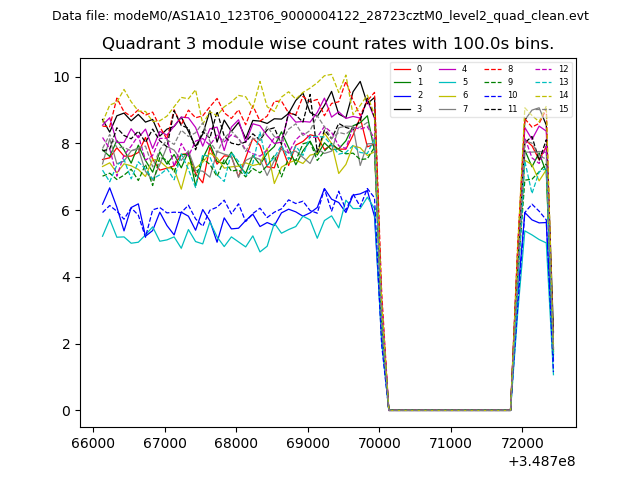
| Module-wise count rates for Quadrant C Data is divided into 100 sec bins |
 |
 |
| Module-wise count rates for Quadrant D Data is divided into 100 sec bins |
 |
 |
| Parameter | Plot |
|---|---|
| CZT HV Monitor | 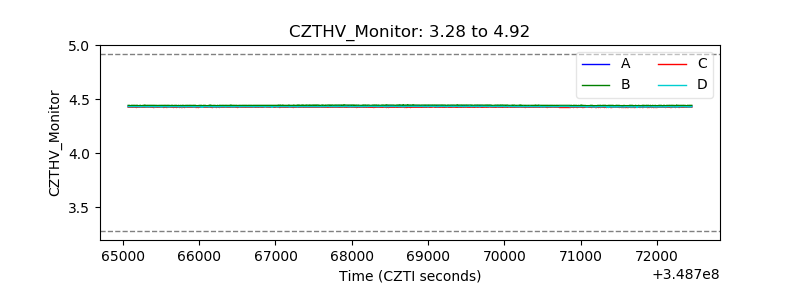 |
| D_VDD | 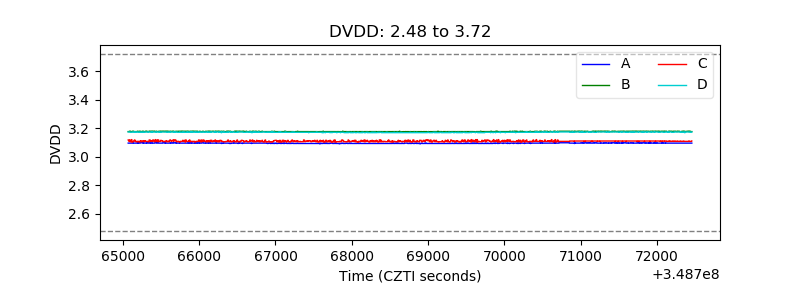 |
| Temperature 1 | 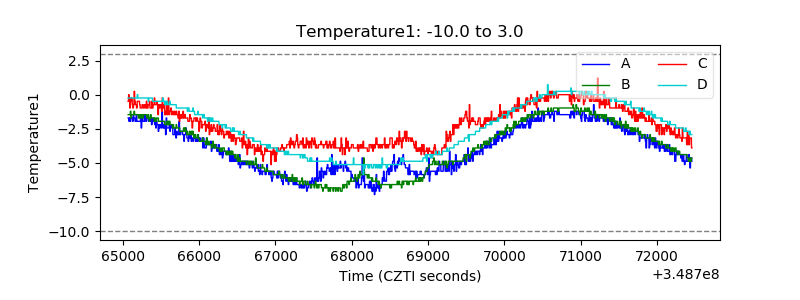 |
| Veto HV Monitor | 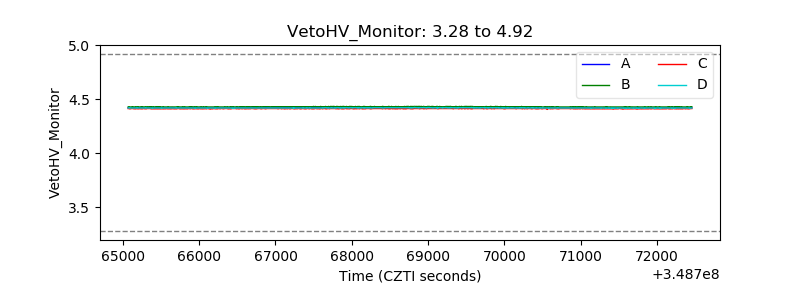 |
| Veto LLD | 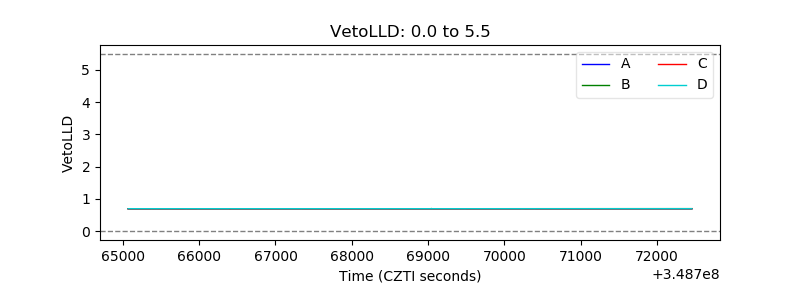 |
| Alpha Counter | 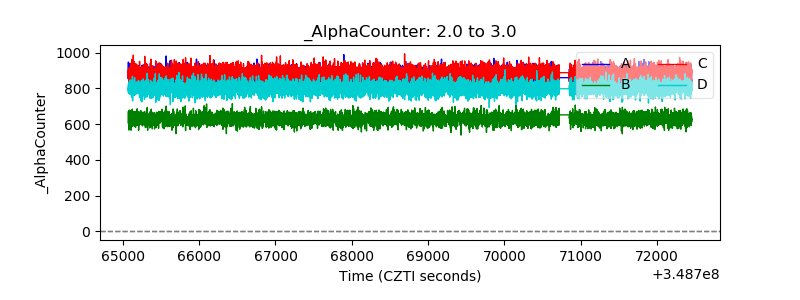 |
| _CPM_Rate | 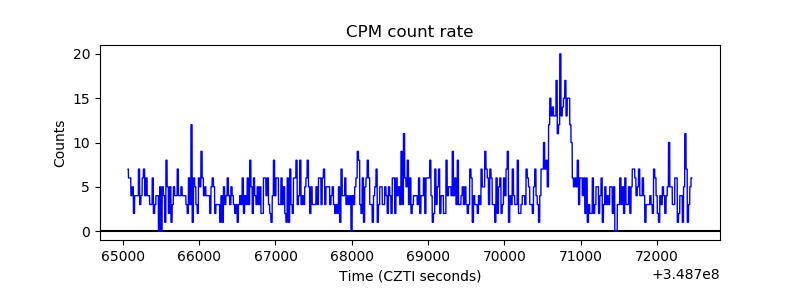 |
| CZT Counter | 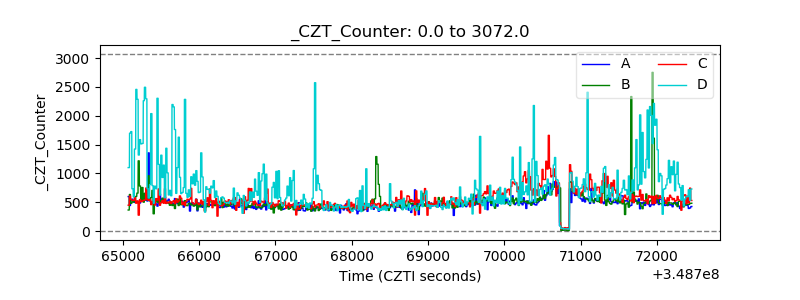 |
| +2.5 Volts monitor |  |
| +5 Volts monitor |  |
| _ROLL_ROT | 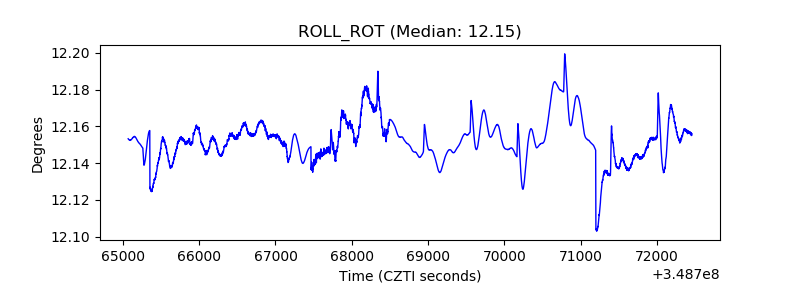 |
| _Roll_DEC | 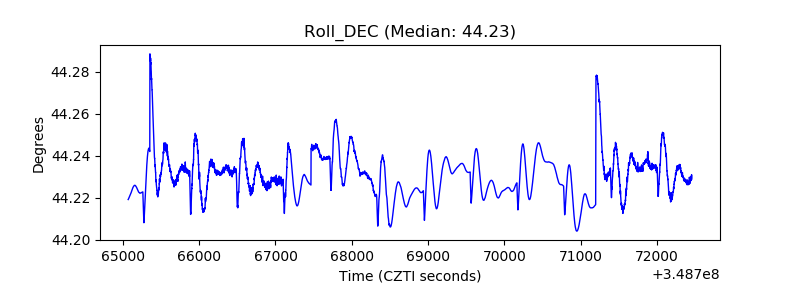 |
| _Roll_RA | 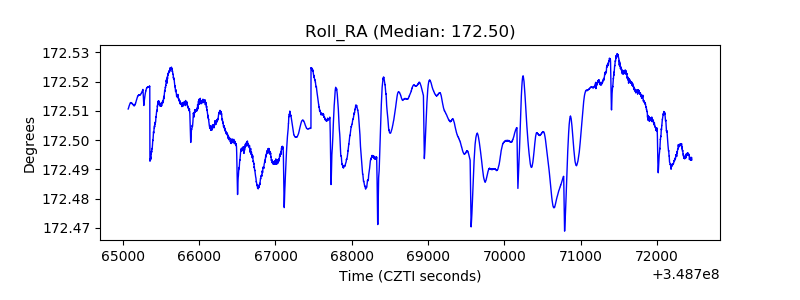 |
| Veto Counter | 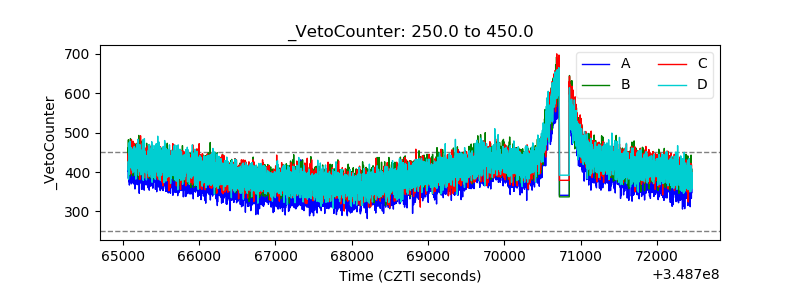 |